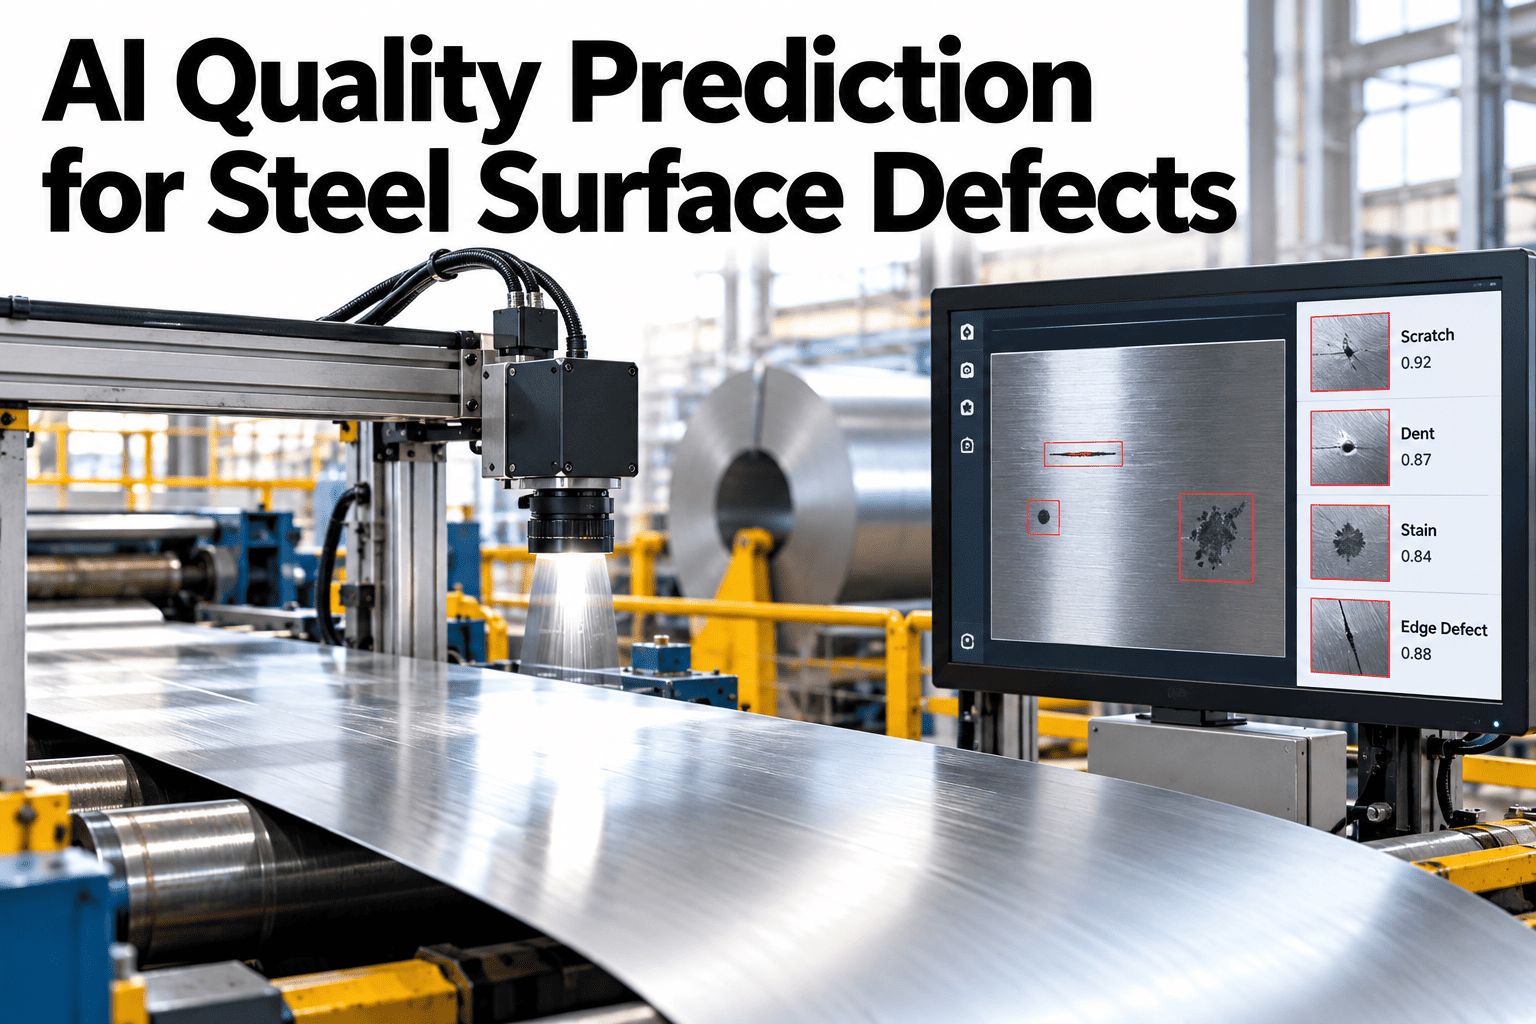
Surface defects on steel, scale, laps, scratches, and rolled-in material, usually get caught at the inspection station, well after the coil has already consumed furnace time, rolling passes, and energy to get there. By the time a defect is flagged, the only options left are downgrading, reworking, or scrapping the coil, none of which recover the cost already sunk into production. Quality prediction flips that sequence by using upstream process data, temperature profiles, roll force, and reduction schedule, to flag a coil as high-risk before it ever reaches the inspection line, giving operators a chance to adjust while the coil is still in process. If you want to see this kind of prediction applied to your own furnace and rolling data, our team can walk you through it.
Steel quality prediction, 2026
Flag Surface Defect Risk Before the Coil Reaches Inspection
AI quality prediction that reads upstream process data to flag high-risk coils in process, giving operators time to adjust before scale, laps, or rolled-in defects ever reach the inspection line.
Process data read
→
Risk score assigned
→
Operator alerted
→
Adjustment made in process
Caught too late
Why Inspection-Stage Detection Costs More Than It Should
Inspection is necessary, but relying on it as the first line of defect detection means every flagged defect has already consumed the full cost of production up to that point.
Sunk production cost
Furnace energy, rolling passes, and handling are all spent before a defect is ever flagged.
No chance to adjust
Once a coil is fully rolled, the process conditions that caused the defect can no longer be corrected for it.
Downgrade or scrap only
Post-inspection options are limited to accepting a lower-grade sale or losing the material entirely.
Delayed root cause signal
By the time a pattern of defects is noticed, the upstream condition causing it may have already changed.
What drives the risk score
The Defect Types and Their Upstream Signals
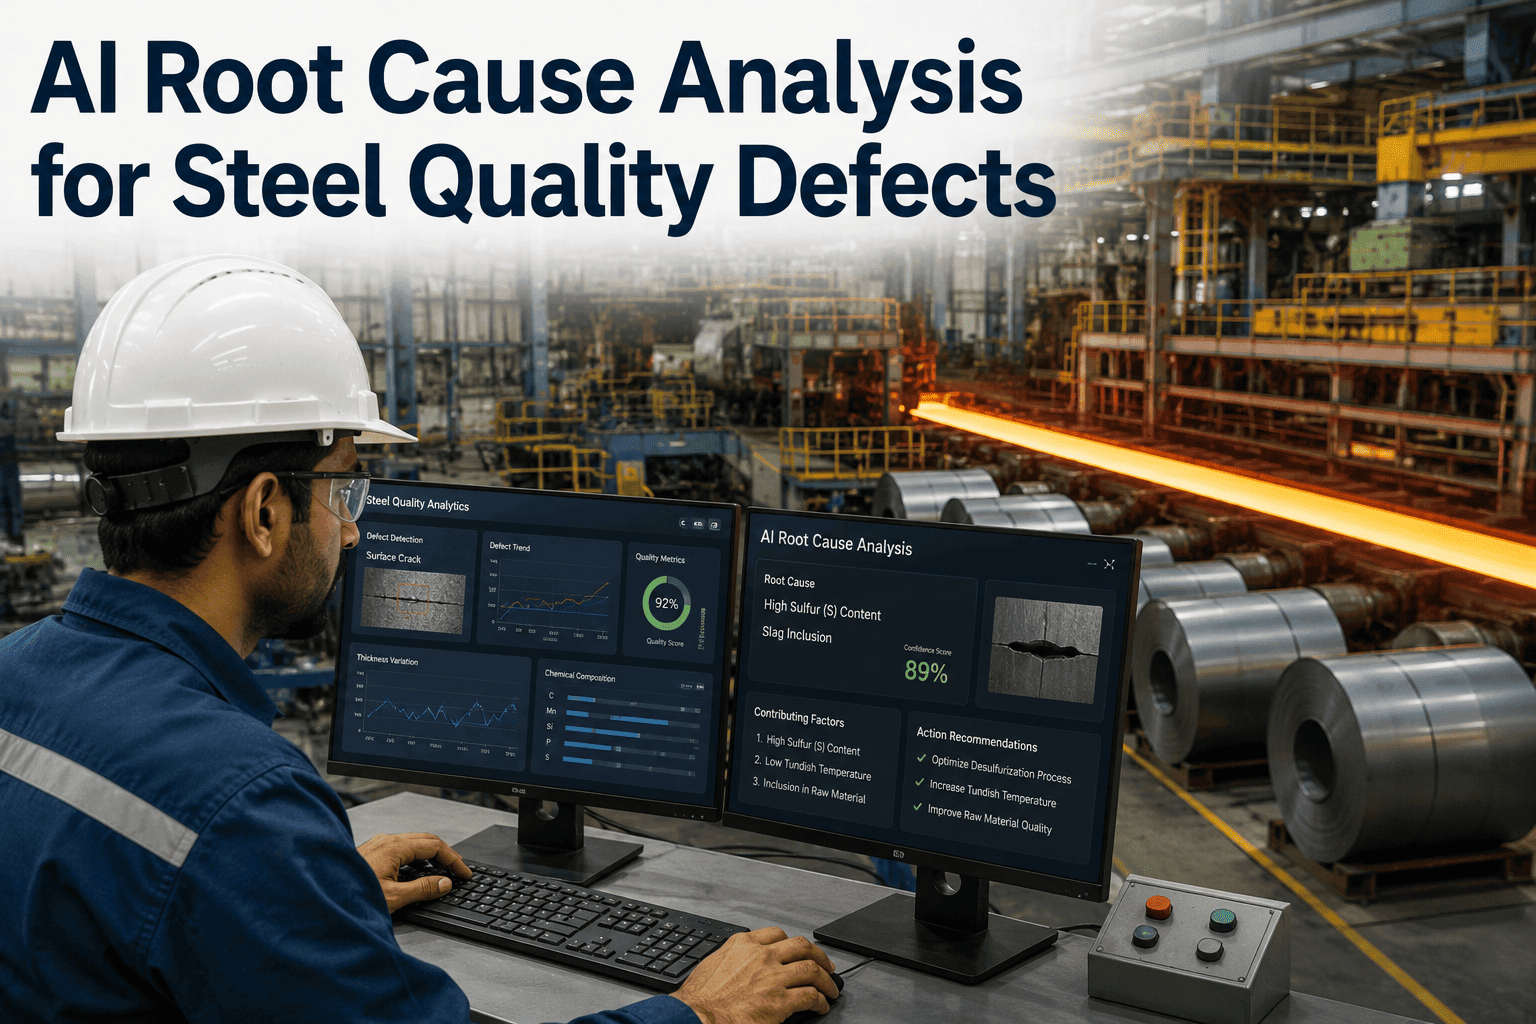
Each common surface defect type tends to correlate with a specific pattern in upstream process data, which is what makes prediction possible before the defect physically appears.
| Defect type | Common upstream signal | Typical stage affected |
| Scale and scale pits |
Furnace temperature profile deviation |
Reheat furnace |
| Laps and folds |
Roll force and reduction schedule mismatch |
Rolling mill |
| Rolled-in material |
Descaling pressure or timing deviation |
Descaling station |
| Surface scratches |
Roll wear pattern and tension control signals |
Finishing mill |
These associations are general planning references, since the exact signal pattern that predicts each defect type on your own mill depends on your specific equipment and product mix.
How it works
From Process Data to a Risk Score
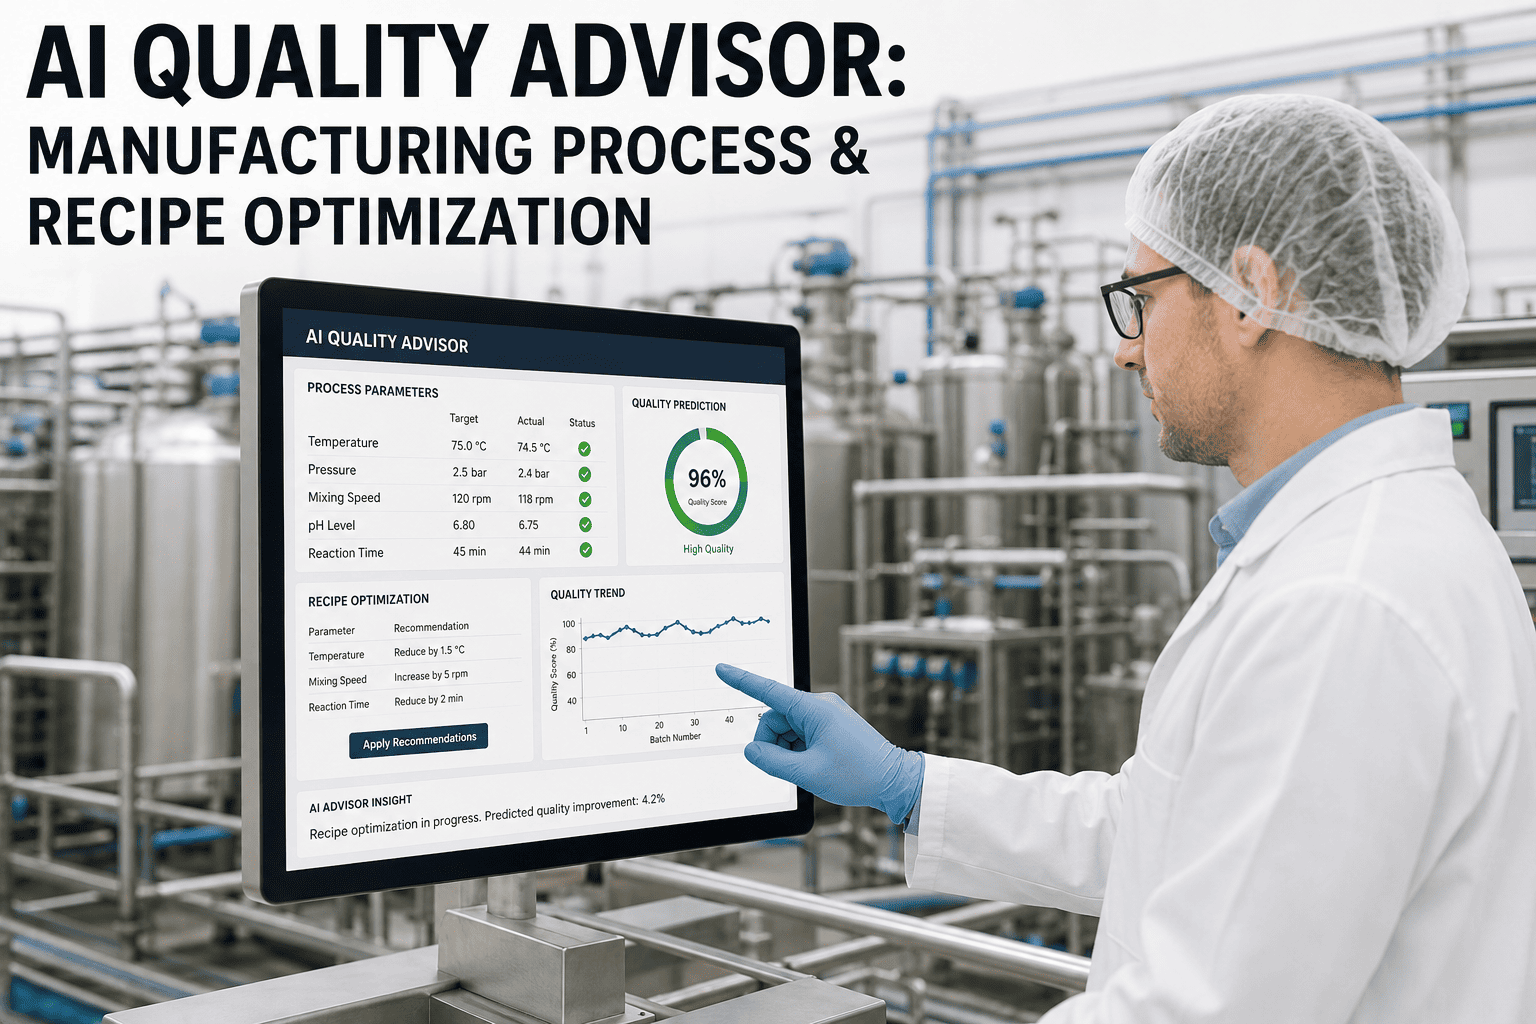
Prediction does not require replacing existing sensors, it works by combining data already being collected across the furnace and rolling line into a single risk assessment.
1
Temperature, roll force, and reduction schedule data are pulled continuously as the coil moves through the line.
2
Current readings are compared against known patterns associated with each defect type.
3
A risk score is calculated and attached to the coil record while it is still in process.
4
High-risk coils trigger an operator alert with enough lead time to adjust process conditions if possible.
See Prediction Applied to a Real Coil Run
Share a recent furnace and rolling data set and we will show what the risk scoring would have flagged.
What changes
Inspection-Only Detection vs Prediction-Assisted Detection
The inspection step itself does not go away, but the point at which a defect is first identified shifts significantly earlier in the process.
Inspection-only detection
Defect identified only after full production is complete
No opportunity to adjust process conditions in time
Options limited to downgrade or scrap
Prediction-assisted detection
Risk flagged while the coil is still in process
Operators have a window to adjust conditions
Inspection becomes a confirmation step, not the first catch
What it takes to implement
Getting Ready for Quality Prediction on Your Line
Implementation readiness depends mostly on data, not new hardware, since most mills already collect the signals prediction needs.
Process data history
A recent period of furnace and rolling data, ideally linked to inspection outcomes for the same coils.
Defect classification records
Inspection results tagged by defect type, which the model uses to learn upstream patterns.
Alert routing plan
A clear path for a high-risk alert to reach the right operator in time to act on it.
Feedback loop
A way to confirm whether a flagged coil's actual inspection result matched the prediction, improving accuracy over time.
Expert review
What iFactory Steel Specialists See Across Rolling Lines
iFactory steel specialists who review quality data across multiple mills find that scale-related defects are usually the easiest to predict reliably first, since furnace temperature data tends to be the most consistently available and well-correlated upstream signal.
They recommend starting prediction efforts on whichever defect type currently causes the most downgrades, rather than trying to cover every defect category at once, since an early, focused win builds the confidence needed to expand coverage further.
Frequently asked questions
What Quality Teams Ask Before Adopting Prediction
How accurate is a risk score compared to actual inspection results?
Accuracy improves as more confirmed inspection outcomes feed back into the model, so early predictions should be treated as a flag for closer attention rather than a certain outcome.
Discuss accuracy expectations for your defect types.
Can operators actually act on a risk flag while the coil is still in process?
For some defect types, yes, adjusting furnace temperature or roll force in time can reduce the risk, though the available window depends on how early in the process the signal is detected.
Ask about actionable lead time with our support team.
Does this require new sensors on our furnace or rolling line?
Most mills already have the core sensors needed, temperature, roll force, and reduction schedule data, so prediction typically connects to existing instrumentation rather than requiring new hardware.
Review your current instrumentation with our team.
How much historical data is needed before predictions become reliable?
A few months of process data linked to confirmed inspection outcomes is a reasonable starting point, with accuracy continuing to improve as more confirmed outcomes accumulate.
Discuss your data history with our support team.
Can this cover multiple defect types at once, or does it need to be rolled out one at a time?
Multiple defect types can be tracked in parallel, though most mills find it practical to start with one or two high-impact defect types and expand coverage once the initial rollout proves out.
Plan a rollout sequence for your defect categories.
Catch the risk before it becomes a scrapped coil
Bring Quality Prediction to Your Steel Surface Inspection
Book a session with iFactory AI to see defect risk scoring applied to your own furnace and rolling process data.