Alarm management in automotive plants is about making sure that when a screen demands attention, it deserves it. Paint shops, utilities and automated lines can throw far more alarms and fault messages than a person can handle, and people learn to ignore them. ISA-18.2 is the standard that sets out how to fix this: decide which alarms are real, give each a priority and an action, and measure the result. This guide explains the standard in plain terms and how to apply it to automotive lines. To see your alarm data analyzed, book a short walkthrough.
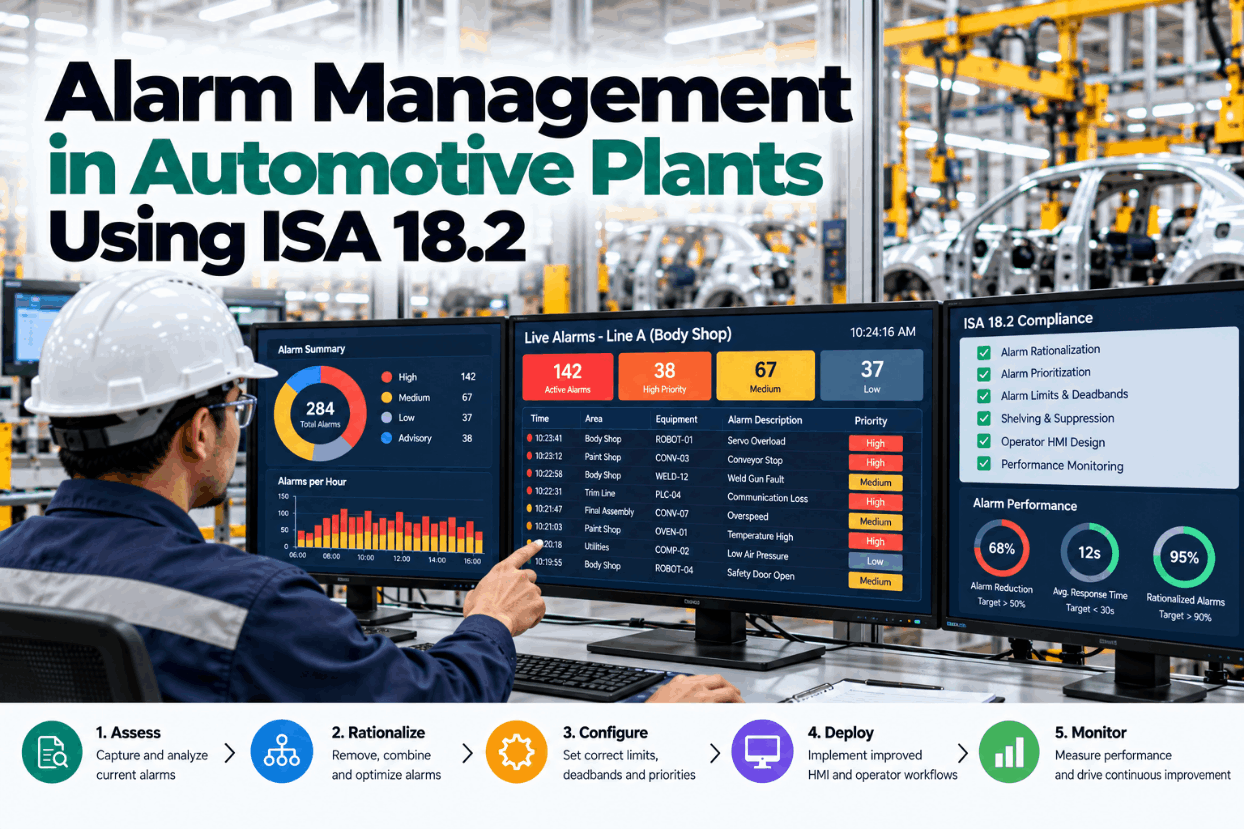
Alarm Management in Automotive Plants Using ISA 18.2: Fewer Alarms, Faster Response
Find the alarms that matter, remove the ones that do not and measure alarm load against ISA-18.2 targets, so operators trust what the screen tells them.
If nobody has to do anything, it is not an alarm and should not sound like one.
About 6 alarms an hour per operator is acceptable; more than 10 in 10 minutes is a flood.
Fixing the top ten usually removes a large share of the load.
The standard’s methods are used for batch and discrete processes too.
What Counts as an Alarm?
An alarm tells the operator that something is wrong and that they need to respond.
An audible or visible means of indicating to the operator an equipment malfunction, process deviation or abnormal condition requiring a response.
| Message type | Needs operator action? | Should it alarm? |
|---|---|---|
| Alarm | Yes, in a limited time | Yes |
| Alert or warning | Maybe, not urgent | Show quietly, no sound |
| Event | No, information only | Log only |
| Maintenance prompt | Yes, but for maintenance | Route to maintenance, not the operator |
Much alarm noise comes from messages that fail this test. They are events or status changes dressed up as alarms.
Sorting messages by this test is the first step. We can run it on your alarm history on a call.
Why Automotive Plants Have Alarm Noise
Every machine builder and integrator adds messages, and nobody removes them.
Booth air, temperature, humidity, oven and bath conditions, often on a central control system.
Compressed air, chilled water, boilers and waste treatment.
Weld faults, part-present errors and safety gate messages from hundreds of robots.
Jams, sensor faults and starved or blocked messages.
Torque results, interlocks and andon calls.
The same message firing again and again without a fix.
Published alarm studies come mostly from process and power plants. ABB, for example, notes power plant operators typically see about 2,000 alarms a day. Automotive figures are rarely published, but paint shops and utilities run the same kind of control systems.
Your own alarm log will show where you stand. See a sample analysis in a demo.
What Is ISA-18.2, and Does It Apply to Automotive?
ISA-18.2 is the leading standard for managing alarm systems. It was written for the process industries, and its methods are used more widely.
Most automotive lines run on PLCs, HMIs and SCADA, not on a distributed control system. The principles are the same whatever the platform.
Our specialists can show how the standard maps to your control systems.
The ISA-18.2 Alarm Management Lifecycle
The standard describes ten stages that keep an alarm system healthy over time.
| Stage | What happens |
|---|---|
| Philosophy | Write the rules: what is an alarm, priorities, roles |
| Identification | Collect candidate alarms from design, incidents and reviews |
| Rationalization | Check each alarm against the rules; set priority and response |
| Detailed design | Define setpoints, deadbands, delays and display |
| Implementation | Configure, test and train |
| Operation | Alarms in service; operators respond |
| Maintenance | Alarms out of service for repair or testing |
| Monitoring and assessment | Measure performance against targets |
| Management of change | Control any change to alarms |
| Audit | Check periodically that the process is followed |
Most plants start in the middle, with monitoring. Measuring the current load shows where rationalization will pay first.
We follow the same lifecycle in every rollout.
ISA-18.2 Alarm Performance Targets
The standard gives numbers to measure against.
| Measure | Target |
|---|---|
| Alarms per operator, average | About 6 per hour, or 150 per day, is acceptable |
| Alarms per operator, maximum manageable | About 12 per hour, or 300 per day |
| Peak alarms in any 10 minutes | 10 or fewer |
| Time in flood | Less than about 1% |
| Priority split | About 80% low, 15% medium, 5% high |
| Stale alarms, active over 24 hours | Fewer than 5 on any day |
| Chattering and fleeting alarms | Zero |
| Share from the top 10 alarms | About 1–5% of the total at most |
Recommended priority distribution. If most alarms are high priority, none of them are.
Comparing your figures with these takes minutes once the alarm log is loaded. Ask our team for a sample report.
Start With the Bad Actors
In most alarm systems, a small number of alarms produce a large share of the total.
Illustrative. Fixing ten alarms is a week’s work, not a year’s project.
- Chattering alarms switch on and off repeatedly. Add a deadband or delay.
- Stale alarms stay active for days. Fix the cause or remove the alarm.
- Duplicate alarms report one problem several times. Keep one.
- Mode alarms fire in standby or changeover when no action is needed. Suppress by state.
Bad actors are the fastest win in alarm management. Our engineers can rank yours from a month of data.
How Alarm Rationalization Works
Rationalization means reviewing each alarm against the same questions and recording the answers.
Does it indicate a real malfunction or deviation?
What must the operator do in response?
The consequence sets how serious it is.
The time available to respond sets the urgency.
Consequence and urgency together give the priority.
Cause, action and priority go into a master alarm record.
These are process industry results. They show how much of a typical alarm load is avoidable once each alarm has to justify itself.
See a rationalization worksheet in a session.
Alarm Floods and Why They Are Dangerous
A flood is when alarms arrive faster than anyone can read them.
More than 10 alarms in 10 minutes for one operator. In a flood, important alarms are lost among the rest.
had to be handled by two operators in the last 11 minutes before the 1994 explosion at the Milford Haven refinery.
- Floods follow upsets. One failure sets off dozens of dependent alarms.
- First-out helps. Show which alarm came first; it is usually the cause.
- Suppress by state. When a zone is stopped, its downstream alarms add nothing.
- Group related alarms. One message for one problem.
Automotive lines have the same pattern: one conveyor stop sets off starved and blocked faults along the line. Discuss flood handling with our advisors.
Applying the Ideas to Robot Cells and Assembly
On discrete lines the words differ, but the logic is the same.
| Process plant term | Automotive line equivalent | Same rule |
|---|---|---|
| Alarm | Fault that stops or threatens the station | Must need action |
| Alarm priority | Fault severity: line stop, quality risk, information | Few high, most low |
| Bad actor | Repeat fault on one robot or sensor | Fix the top ten first |
| Flood | Fault cascade after a conveyor or zone stop | Show first-out; suppress the rest |
| Stale alarm | Bypassed or permanently active fault | Fix or remove |
| Shelving | Temporary, recorded suppression | Time-limited and approved |
Fault messages should be in plain words with the first response step beside them. A code that needs a manual is not much help mid-shift.
Ranking repeat faults by station is often where body shops start. We can produce the ranking in a working session.
Unmanaged Alarms Versus a Managed Alarm System
The difference shows in how operators behave.
- Everything is an alarm
- Most are high priority
- Operators acknowledge without reading
- Same alarms every shift
- Floods during every upset
- Changes made without record
- Only messages needing action alarm
- Priorities follow consequence and time
- Operators trust and respond
- Bad actors fixed and tracked
- Floods rare and readable
- Changes controlled and audited
Trust is the real result. An operator who believes the screen acts on it. An alarm review shows how far you are from that.
Alarm Management Checklist
A short check against the standard.
Most plants can tick the first box in each group and little else. We can help with the rest in a pilot.
How iFactory Supports Alarm Management
iFactory reads alarm and fault logs from your control systems, measures them against ISA-18.2 targets and shows which alarms to fix first.
Rate per operator, floods, priorities and stale alarms.
Top alarms by count, with likely cause.
Worksheet for cause, action and priority.
First-out and cascade patterns.
Codes translated with the first response step.
Every alarm change recorded.
It runs on premises and reads from PLC, SCADA and control system logs. Share a month of alarm history and we will rank it in a trial.
Find the Ten Alarms Causing Most of Your Noise
Share a month of alarm or fault history. We measure it against ISA-18.2 targets and rank the alarms to fix first.
One alarm, booth 2 supply air low flow, fired 312 times and made up 28% of all alarms. In standby mode it needs no operator action.
One Alarm, 28% of the Load
This is how a controls engineer might use the analysis.
iFactory ships as a pre-configured NVIDIA AI server, racked and ready with the alarm and fault analytics models loaded. Rack it, plug in power and Ethernet, and the AI is live. Scope covers data connections across press, body, paint, assembly and machining areas, PLC/SCADA, MES, CMMS and ERP integration, cabling and network setup, team training and 24×7 remote monitoring.
Server installed, PLC, MES and CMMS links live, history loaded.
Models tuned on your own lines, then piloted in one area with your team reviewing every output.
Rollout to the agreed lines, team training done, 24×7 remote monitoring in place.
Software, server and integration come as one package. For pricing, contact our sales team.
Frequently Asked Questions
The ANSI/ISA standard for managing alarm systems in the process industries. It defines what an alarm is, a ten-stage lifecycle and performance targets. Its international version is IEC 62682.
ISA-18.2 guidance treats about 6 alarms an hour per operator as acceptable and about 12 an hour as the maximum manageable.
More than 10 alarms in 10 minutes for one operator. Time in flood should be below about 1%.
It was written for process industries, and ISA says its methods also apply to batch and discrete processes. Paint shops and utilities fit most directly; discrete lines apply the same principles to fault messages.
Reviewing each alarm against set rules to confirm it needs operator action, then recording its cause, response and priority.
Measurement and a first round of bad actor fixes typically fit within a 6–12 week rollout. Plan it with our specialists.
Make Every Alarm Worth Reading
iFactory measures your alarm load against ISA-18.2, ranks the alarms to fix first and tracks the result, so operators trust the screen again.
Illustrative. ISA-18.2 guidance treats about 6 an hour as acceptable and 12 as the most an operator can manage.