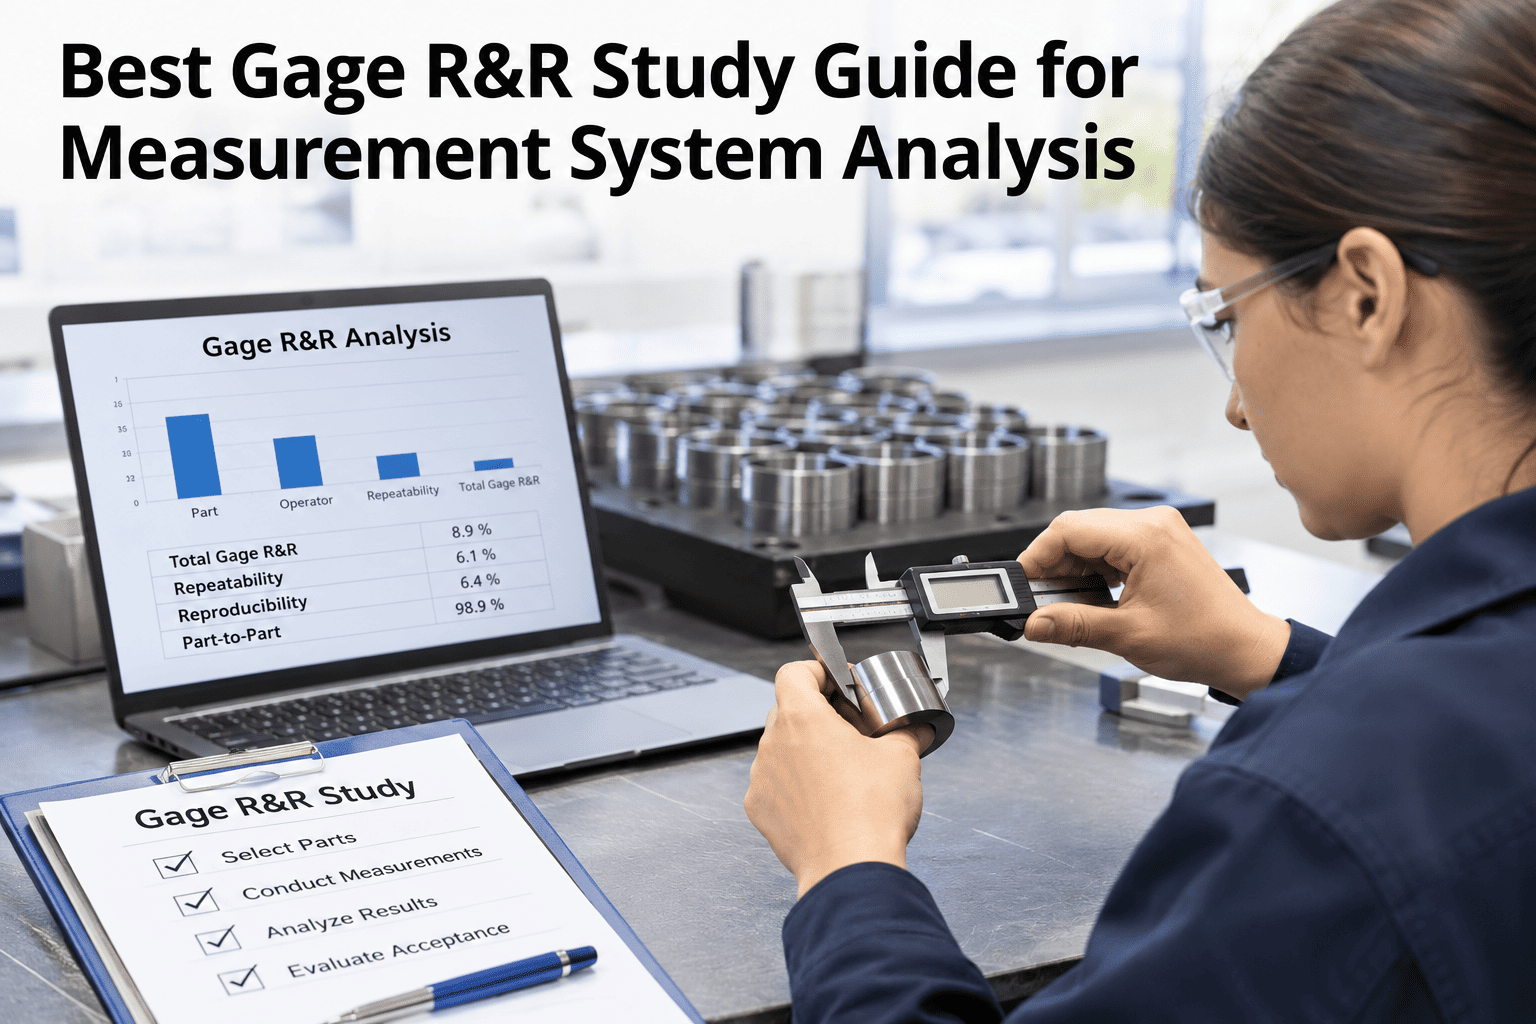
If the measurement system eats a third of the tolerance, every capability number calculated after it is fiction — the Cpk looks real, the SPC chart looks stable, and none of it reflects the part. A Gage R&R study is how a quality team finds out how much of their observed variation actually comes from the parts, versus from the gage or the operator holding it. Under AIAG MSA guidelines, a result under 10% is acceptable, 10–30% is conditionally acceptable, and anything above 30% means the measurement system cannot be trusted for the decisions riding on it (AIAG MSA 4th Edition). You can walk through a Gage R&R study on your own gauge with our team.
Measurement System Analysis, 2026
Your Cpk Is Only as Honest as the Gage That Measured It
iFactory, an on-premise AI platform for quality control and inspection management, automates Gage R&R data collection, ANOVA calculation and AIAG-format reporting, so every study is audit-ready the moment it is complete.
Under 10% — Acceptable
10–30% — Conditional
Over 30% — Unacceptable
What it is
What Is a Gage R&R Study?
Gage R&R — repeatability and reproducibility — is a study that separates total measurement variation into two sources: repeatability (how much the same operator's readings vary when measuring the same part twice) and reproducibility (how much readings vary between different operators measuring the same part).
Total observed variation is the sum of part-to-part variation and measurement system variation. A study that skips this split cannot tell whether a chart showing instability reflects a real process problem or just a noisy gauge.
Acceptance criteria
What the AIAG Thresholds Actually Mean
| %GRR (of study variation) | Verdict | What it means |
|---|
| Under 10% | Acceptable | Measurement system variation is small enough to trust for SPC and capability work |
| 10% to 30% | Conditionally acceptable | Usable depending on application cost and risk, but worth improving |
| Over 30% | Unacceptable | The gauge cannot reliably distinguish good parts from bad ones |
A second number matters as much as %GRR: Number of Distinct Categories (NDC) should be 5 or higher, confirming the system can actually tell parts apart across the tolerance range, not just pass a single blended percentage (AIAG MSA 4th Edition).
Running the study
Five Steps to a Study That Produces a Trustworthy Result
1
Select 10 parts spanning the full range of expected variation, not just parts near nominal.
2
Assign 2–3 operators who normally run this measurement, not whoever is available that day.
3
Randomize the measurement order so operators cannot see or anticipate each other's readings.
4
Collect 2–3 trials per operator per part under the study's crossed design.
5
Run the ANOVA calculation and document the result against the acceptance criteria before using the gauge for SPC.
Common mistakes
Four Mistakes That Produce a Misleading Result
Operators seeing each other's readings
Breaks the independence the study depends on and inflates apparent agreement.
Parts measured in a predictable order
Lets operators anticipate results rather than measure blind, same problem as above.
Parts too close to nominal
A sample that does not span the tolerance range understates part-to-part variation and inflates %GRR.
Treating %GRR alone as the full picture
A gauge can pass %GRR and still have a bias or linearity problem that a complete MSA program would catch.
Expert review
What a Quality Engineer Would Check First
Holds up
The AIAG ANOVA method is the industry-standard approach for variable Gage R&R, well validated across decades of automotive and general manufacturing use.
Watch for
A gauge that clears the generic 10% threshold but still fails a specific customer's tighter PPAP acceptance band — always check the applicable customer-specific requirement.
Do next
Prioritize studies on gauges feeding SPC charts or capability reports first, since those are where a bad gauge does the most downstream damage.
FAQ
What Quality Teams Ask About Gage R&R Studies
What %GRR is acceptable under AIAG guidelines?
Under 10% is generally acceptable, 10% to 30% is conditionally acceptable depending on application risk and cost, and over 30% is unacceptable (AIAG MSA 4th Edition). NDC should also be 5 or higher.
Check your own gauge's %GRR with our team.
How many parts and operators does a standard study need?
The standard AIAG crossed design uses 10 parts spanning the tolerance range, 2 to 3 operators who normally run the measurement, and 2 to 3 trials per operator per part.
Ask about study design for your specific gauge type.
What does Number of Distinct Categories (NDC) actually measure?
NDC estimates how many distinct groups of parts the measurement system can reliably separate across the tolerance range. AIAG recommends an NDC of 5 or higher; a lower number means the gauge cannot tell meaningfully different parts apart, even if %GRR looks acceptable.
Can a gauge pass %GRR and still have a measurement problem?
Yes. %GRR only covers repeatability and reproducibility — a gauge can pass that test and still carry a bias or linearity problem, which is why a complete MSA program includes those studies too, not %GRR alone.
Discuss a full MSA program for your gauges.
How often should a Gage R&R study be repeated?
Most quality systems repeat studies annually, after any gauge repair or recalibration event, or when a customer's PPAP requires a current study. Chronically borderline gauges warrant more frequent checks.
Set a study schedule with our team.