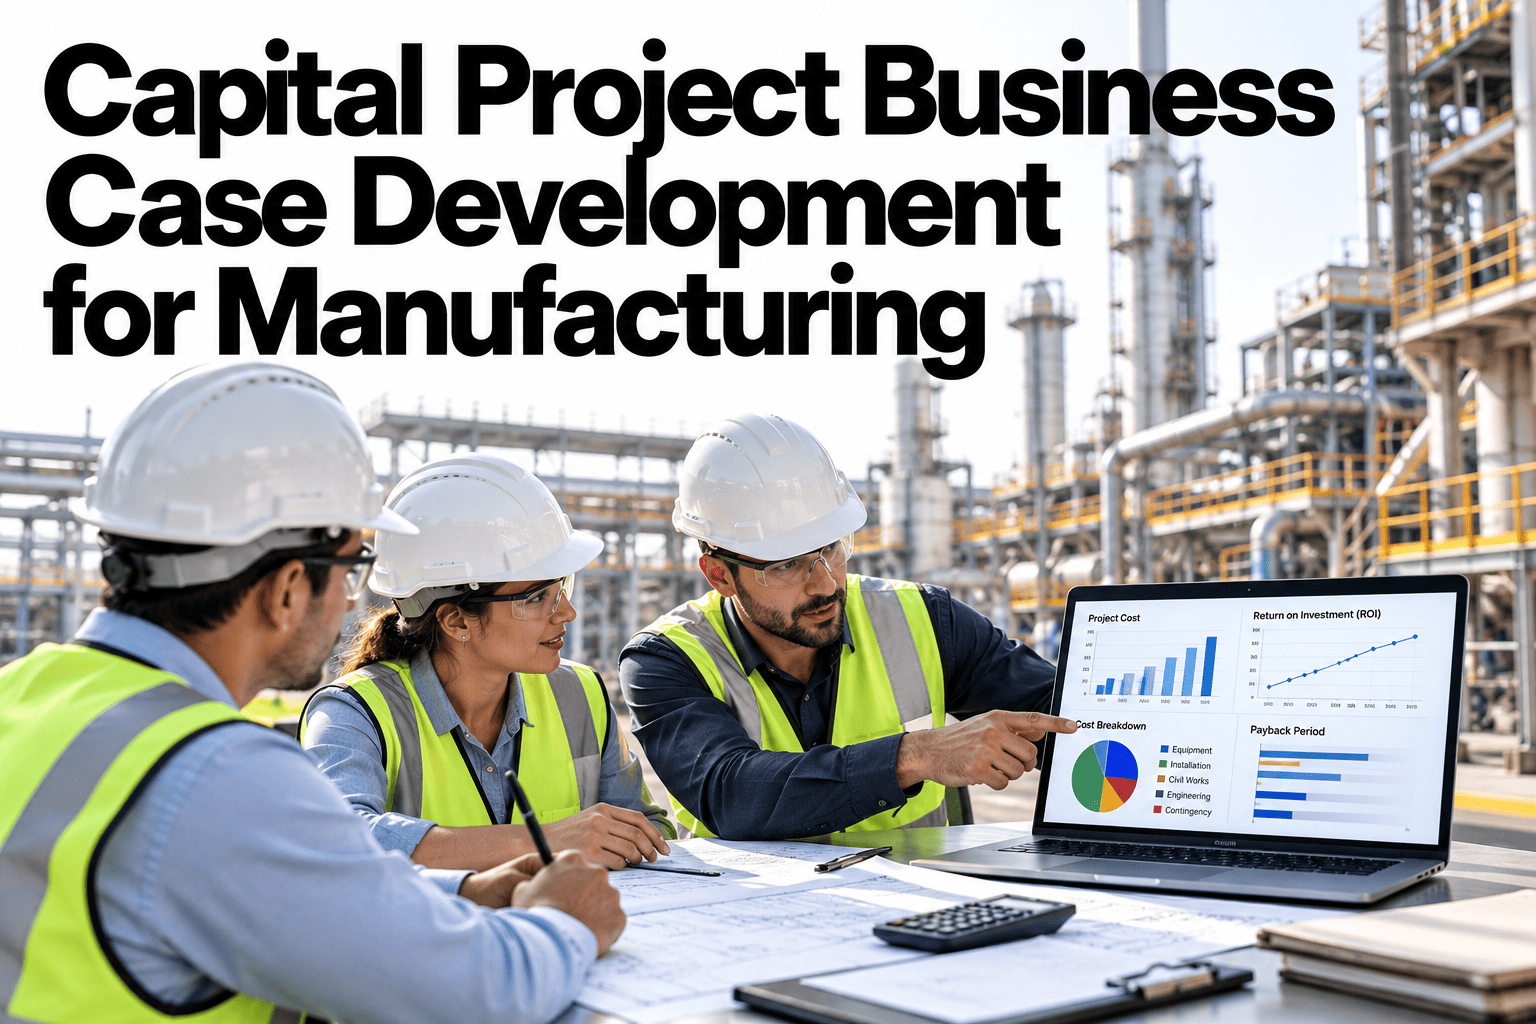
A capital project is usually approved on a story of volumes, prices and start dates, and judged years later on numbers nobody agreed at the time. A strong business case states each assumption clearly enough to test, names who owns it, and shows what would change the decision. That makes the approval meeting sharper and the later review fair to everyone. See how iFactory AI helps test capital project assumptions against plant data.
Approve the Project on Assumptions You Can Test
iFactory AI helps greenfield and capital teams record each assumption, attach its evidence and owner, and track it after approval, so the case stays honest through each gate to start-up.
Why Approved Cases Disappoint Later
Most business cases are built to win approval, and the numbers are chosen to fit. Years later, the plant is judged on figures that were never tested, owned or reviewed.
Optimism
Costs are set low and benefits high, because the project needs to be funded.
Vague claims
An assumption such as strong demand cannot be proved or disproved.
No owner
Nobody is named for each number, so nobody answers for it later.
No review
After start-up the team moves on, and the case is never compared with results.
Flyvbjerg and colleagues argue that the root cause of overrun is behavioral bias, not scope change or complexity, and they recommend de-biasing estimates with reference class forecasting or similar methods. You do not need to accept every claim to use the lesson. Compare each estimate with the record of your own past projects.
Give the Case a Clear Structure
Public-sector guidance uses a five case model, as summarized in a CIO wiki article. The idea carries well into plant projects, with simple questions for each part.
| Case | Question it answers | Plant project evidence | Usual owner |
|---|---|---|---|
| Strategic | Why do this, and why now? | Link to site strategy, demand outlook, constraints today | Business unit lead |
| Economic | Which option gives the best value? | Option costs and benefits, with a do-nothing baseline | Finance partner |
| Commercial | Can it be bought and built on these terms? | Quotes, contract form, supplier capacity, risk split | Procurement lead |
| Financial | Is it affordable, and when is cash needed? | Capex phasing, funding approval, effect on budgets | Controller |
| Management | Can we deliver it and know if we are on track? | Plan, team, milestones, risks, review points | Capital projects director |
Build an Assumption Register
The register is the heart of a checkable case. Each assumption becomes a row with a value, a source, a confidence level and an owner, so the case can be argued with facts.
| Field | What to record | Example wording |
|---|---|---|
| Statement | One clear sentence with a number and a unit | Line reaches 90% of rated output within six months of start-up |
| Source | Origin of the number | Vendor guarantee, pilot run or past project |
| Confidence | High, medium or low, with a reason | Medium, based on one similar line |
| Owner | One named person | Plant operations manager |
| Test and date | How and when it will be checked | Compare with commissioning data at month six |
| Effect on result | How much the case moves if it is wrong | Payback changes by about four months |
Turn Your Next Business Case Into a Checkable One
Book a 30-minute session and iFactory AI will walk through an assumption register for one of your planned projects.
Appraise With NPV, Payback and Sensitivity
Net present value discounts each year's cash to today's value, and payback counts the years to recover the outlay. Show both, and show how fast they move when an assumption changes.
| Case | Annual net inflow | NPV at 10% | Reading |
|---|---|---|---|
| Expected | 3,500 | about 3,268 | Positive, with room to spare |
| Weaker | 3,000 | about 1,372 | Still positive, with less margin |
| Break-even | about 2,638 | about 0 | Roughly 25% below the expected inflow |
Check Estimates Against Your Own History
Reference class forecasting asks one plain question: how did similar past projects turn out? Build a small grid using your own portfolio before trusting a new estimate.
List similar projects
Pick completed projects of a like type, size and technology.
Record plan against actual
Cost, schedule, ramp-up and benefit at approval and at one year after start.
Find the usual gap
Note how far, and in which direction, estimates missed on average.
Adjust the new case
Set contingency and benefit ranges using that gap, then explain the logic.
Use Stage Gates With Evidence Rules
Gates work when each one asks for stronger evidence than the last. Early gates are cheap to stop, and late gates are costly, so test the shaky assumptions first.
| Gate | Decision | Evidence expected | Cost to stop |
|---|---|---|---|
| G1 Concept | Study the idea further? | Clear need, rough range of cost and benefit | Very low |
| G2 Feasibility | Develop the preferred option? | Option comparison, first register, quotes in range | Low |
| G3 Approval | Commit the funds? | Tested key assumptions, firm quotes, owners named | Medium |
| G4 Start-up review | Did the plan hold? | Commissioning data against the register | High, so learn for the next project |
Inputs Specific to Greenfield Projects
Site and utilities
Land, power, water, gas and drainage, with the lead time for each connection.
Permits
Approvals, their dates and the risk of delay on the critical path.
Supply chain
Material sources, logistics and supplier capacity at planned volume.
People
Hiring, training and the learning curve before rated output.
Ramp-up
A curve starting at first product to rated output, not a single start date.
Systems
ERP, MES, quality and maintenance setup, planned and costed starting on day one.
Scenarios and Kill Criteria
Track the Case After Approval
A case that stops at approval teaches nothing. Keep the register alive, and compare each assumption with real data as the project moves.
Baseline
Record plant performance before the project, using live data.
Build
Track cost, schedule and scope changes against the register.
Commission
Compare test results with the performance assumptions.
Ramp
Follow output, yield and cost against the ramp curve.
Review
Hold a post-investment review at a set date, with owners present.
Learn
Add the result to your reference class for the next case.
Common Mistakes in Capital Cases
Most weak cases fail in familiar ways. Reading this list before the next submission costs ten minutes and often saves a hard conversation at the review.
| Mistake | What it looks like | Better habit |
|---|---|---|
| One-point forecast | A single volume and price, with no range | Show low, expected and high values and the break-even point |
| Missing baseline | Benefits counted against a plant that never existed | Measure current output, yield, energy and downtime first |
| Benefits counted twice | Two projects both claim the same saving | Keep one portfolio register and name the claimant |
| Ignored running cost | Capex is precise, while maintenance and staffing are guesses | Model whole-life cost with the same care as the build |
| No end-of-life view | The asset is assumed to last forever | State a life, a refurbishment point and a residual value |
| Review never held | The team moves on after start-up | Book the review date before the money is released |
Contingency, Risk and Who Carries It
Contingency is a number that tends to be argued about and rarely explained. A clear case separates three ideas, and each belongs to a different person.
As a project moves through the gates, the estimate allowance should shrink because the design firms up. If it stays the same size at Gate 3 as at Gate 1, either the design has not progressed or the number was never based on anything. Both are worth asking about.
Risk reserves work best as a short register of named events. Each row carries a chance, a cost and an owner, and the sum is compared with the reserve. This turns an argument about a percentage into a review of specific, checkable risks, which is a far better use of a committee's time.
Benefits That Are Easy to Overstate
Cost estimates get the scrutiny, while benefits are often taken on trust. Test each benefit line with the same questions you would ask about a quote.
Demand and share
Is the extra output sold, or only possible? Ask sales to sign the number.
Margin per unit
Check the price against recent contracts, not the best quarter on record.
Scrap and rework
Compare the claimed gain with measured losses on the current line.
Utility savings
Use metered use and the tariff in force, plus a view on tariff changes.
Headcount effects
Say whether roles are removed, moved or simply less busy.
Claims and returns
Count avoided cost using your own complaint and warranty history.
Working With Finance Without Losing the Plant View
Finance owns the discount rate, the depreciation rules and the tax treatment, and plant leaders own the physical story. Good cases keep both views visible and agree on the rules early.
Agree the discount rate, the evaluation period and the treatment of working capital before building the model. Changing them late makes every comparison with earlier projects unfair. Ask finance to publish a standard set of rules so that a packaging line and a new furnace are judged on the same basis.
Next, agree how benefits will be measured after start-up. A saving that cannot be seen in a plant report will not be believed in a review. Choose the measure, the data source and the owner now, and record them in the register next to the assumption. When the review arrives, nobody needs to debate the method.
Finally, agree what counts as success. A project can miss payback by a few months and still be a good decision, while another can meet payback and leave the plant worse off. Writing down the pass mark at approval, with a tolerance, removes much of the later argument and keeps the review focused on learning.
Reading the Register at Each Gate
The same register serves every gate, and the questions change as the project matures. Use the pattern below to keep meetings short and focused.
Which numbers are guesses?
Mark every open assumption and pick the three that could end the idea.
What has been tested?
Show the evidence gathered since the last gate, and the rows that moved.
Who will answer for it?
Confirm that each key row has an owner, a test date and a break-even value.
What did we learn?
Compare plan and actual by row, then store the gaps for the next case.
Over time the register becomes a record of how your own organization estimates. Patterns appear quickly, such as ramp-up that always runs long or quotes that always rise between feasibility and award. Those patterns are worth more than any outside benchmark, because they describe your suppliers, your people and your sites.
Share the findings openly. When project teams see that a missed estimate leads to a better next estimate, and not to blame, they begin to write honest assumptions on the first draft. That change in behavior is the real prize, and the tooling only makes it easy to sustain.
Governance Checklist
How to Judge the Program
| Measure | How to count it | What good looks like |
|---|---|---|
| Tested assumption share | Key assumptions with evidence at approval, divided by all key assumptions | High at G3, and rising |
| Estimate accuracy | Final cost and benefit against approved values | Gap narrowing over projects |
| Reviews completed | Post-investment reviews held, divided by projects due | Close to all of them |
| Early stops | Projects stopped or reshaped at G1 or G2 | Some, showing the gates work |
| Time to decision | Days between gate submission and decision | Short and steady |
How iFactory AI Supports the Business Case
iFactory AI holds the plant baseline, links it to the assumption register, and tracks results after start-up.
Plant baseline
Live data on output, yield, energy and downtime before the project.
Assumption register
Statements, sources, owners and test dates in one place.
Scenario view
Low, expected and high cases with break-even values.
Gate pack
Evidence summaries for each gate decision.
Ramp tracker
Output and yield against the planned ramp curve.
Review record
Plan against actual by assumption, saved for the next case.
A 90-Day Starting Plan
Pick a live case
Choose one planned project and agree the register template.
Fill and test
Write the assumptions, name owners and gather first evidence.
Model the range
Build scenarios and break-even values, and check against past projects.
Take it to the gate
Present the case, record the decision and set review dates.
Frequently Asked Questions
How many assumptions should a business case list?
List the ten or fewer that move the result most, and keep minor ones in an appendix. Focus effort on the assumptions with the largest effect. Book a demo to rank your key assumptions by effect on the result.
Should payback or NPV drive the decision?
Show both, plus break-even values. Payback is easy to read, and NPV counts the full life and the cost of capital. Book a demo to see both measures side by side, or ask support about model setup.
How do we set contingency without padding?
Base it on how similar past projects ended, and explain the logic in the case. That keeps it honest and open to challenge. Book a demo to build a reference class using your own projects.
Who should own the post-investment review?
The project sponsor owns it, with finance and operations present, and the register provides the agenda. Book a demo to see a review record built on the register.
How long does a pilot take?
The turnkey build runs 6–12 weeks, with the first register live after the baseline is built. Book a demo to plan your pilot around your next gate dates.
Approve Projects You Can Prove Later
iFactory AI links plant data to a checkable business case and tracks it after start-up. Book a walkthrough on one of your own projects.