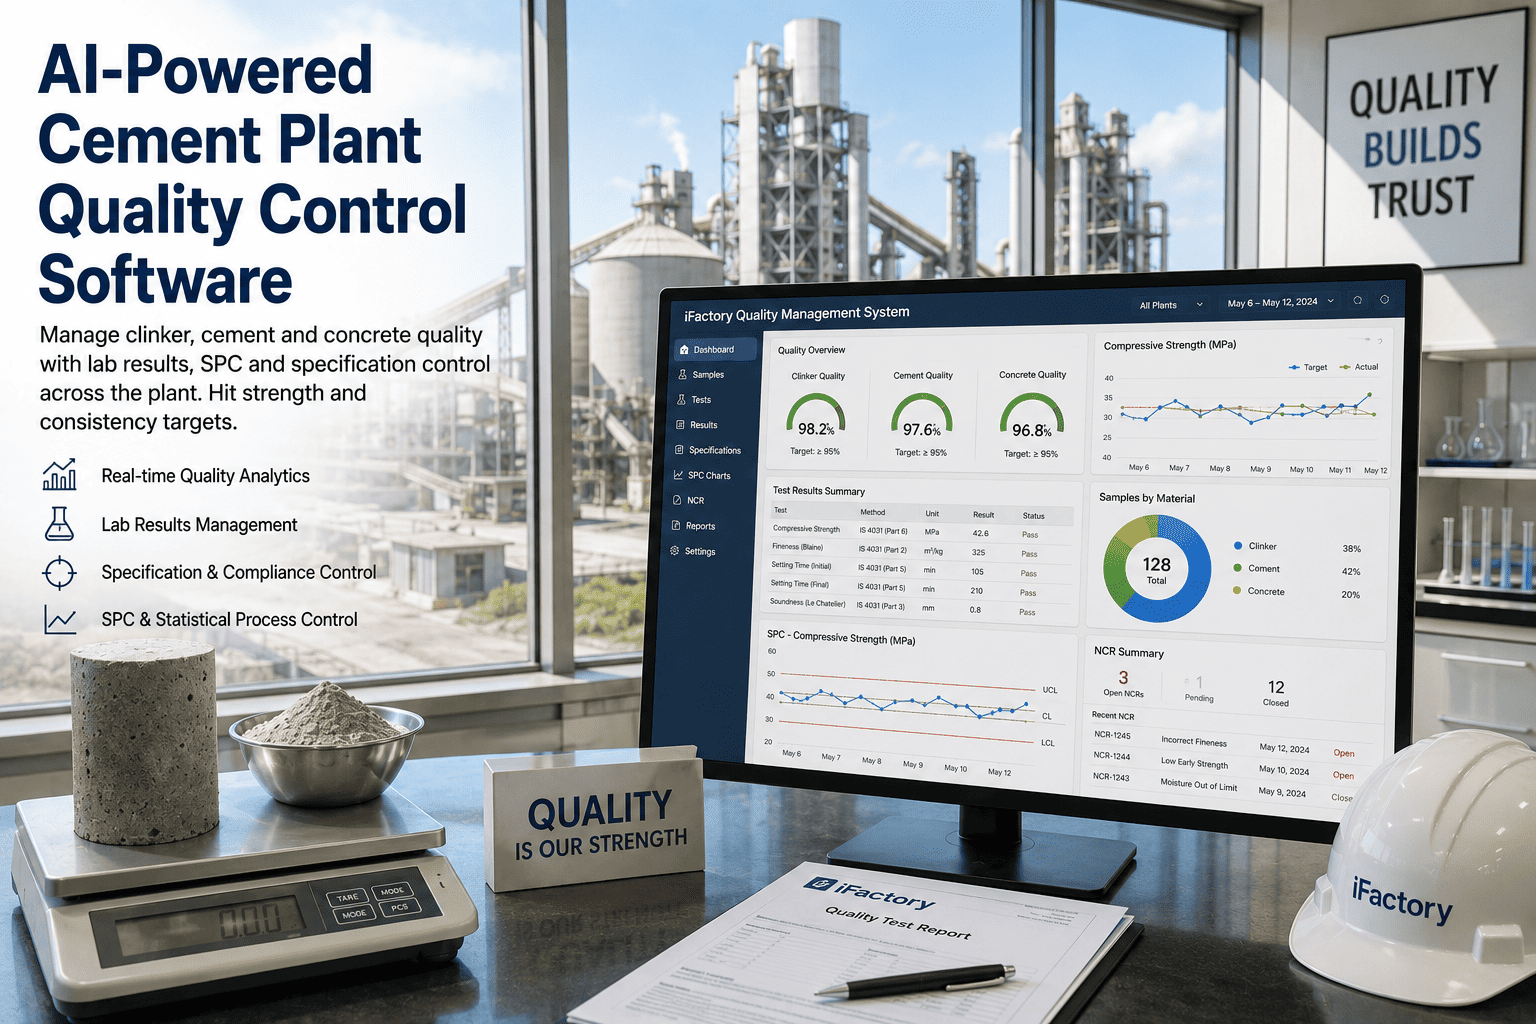
Every tonne of cement is a chemistry promise: free lime held between 1.0 and 1.5%, LSF inside 92 to 98, C3S in its optimal band, and a 28-day strength the customer will not test until the structure is already poured. Yet in most plants, the lab result that confirms the promise arrives hours after sampling — by which time 200 to 400 tonnes of clinker have left the burning zone unverified, and a quality miss means downgrading product at $5 to $15 per tonne. iFactory\'s Quality Management System connects lab results, SPC charts, and specification control across clinker, cement, and concrete — so every result lands against its spec the moment it exists, drift gets caught before the silo fills with it, and audits stop taking weeks to assemble.
iFactory Quality Management System
Cement Quality Control, From Quarry to 28-Day Strength
Lab results, SPC, and specification control on one platform across raw meal, clinker, cement, and concrete — hit strength targets, cut variability, and turn every out-of-spec result into a tracked NCR with a corrective action.
1.0-1.5%
free lime window to hold
200-400t
clinker leaves unverified per lab lag
$5-15/t
lost when product is downgraded
28 days
until the strength promise is proven
Quality Is Decided in Four Places — Track All of Them
Cement quality is not one checkpoint; it is a chain. A drifting quarry face changes the raw meal, the raw meal changes the clinker, the clinker changes the cement, and the cement changes the concrete a customer pours months later. A QMS that only sees the cement mill is auditing the middle of the story. iFactory holds the specification at every link.
Stage 1
Raw Meal
LSF · Silica Modulus · Alumina Modulus · Fineness
Quarry variability enters here. XRF results checked against blend targets keep kiln feed chemistry inside the recipe before it burns.
Stage 2
Clinker
Free Lime · C3S / C2S · Liter Weight · LSF 92-98
The burning report card. Free lime between 1 and 2% confines the variability that inconsistent burning passes downstream to strength.
Stage 3
Cement
Blaine · SO3 · PSD · Setting Time · Early Strength
Grinding, gypsum, and additions tuned per type and grade — with every dispatch-silo sample logged against its specification limits.
Stage 4
Concrete & Dispatch
2 / 7 / 28-Day Strength · Consistency · Customer Spec
Mortar and concrete results close the loop — proving conformity per ASTM C150 / EN 197-1 and per customer, lot by lot.
The Lab Lag Is Where the Money Leaks
Quality labs are accurate but slow relative to a kiln making thousands of tonnes a day. When results live in instrument screens, paper, and personal spreadsheets, the lag compounds: transcription introduces 3 to 5% error rates, trends are visible only to whoever built the spreadsheet, and a single mistyped LSF can steer raw mix corrections the wrong way for hours.
Hours
Result Latency
Free-lime results arrive hours after sampling — hundreds of tonnes have already moved on by the time anyone can react.
3-5%
Transcription Errors
Hand-copying XRF, Blaine, and strength values into spreadsheets corrupts the very data quality decisions depend on.
$50-300K
Annual Downgrades
Off-spec material reprocessed or sold down-grade quietly drains value every year the lag persists.
40+ hrs
Per Audit Cycle
Assembling conformity records from scattered sources turns every audit into weeks of compilation work.
How much is your lab lag costing per year? Book a demo and we\'ll map your sample-to-decision time.
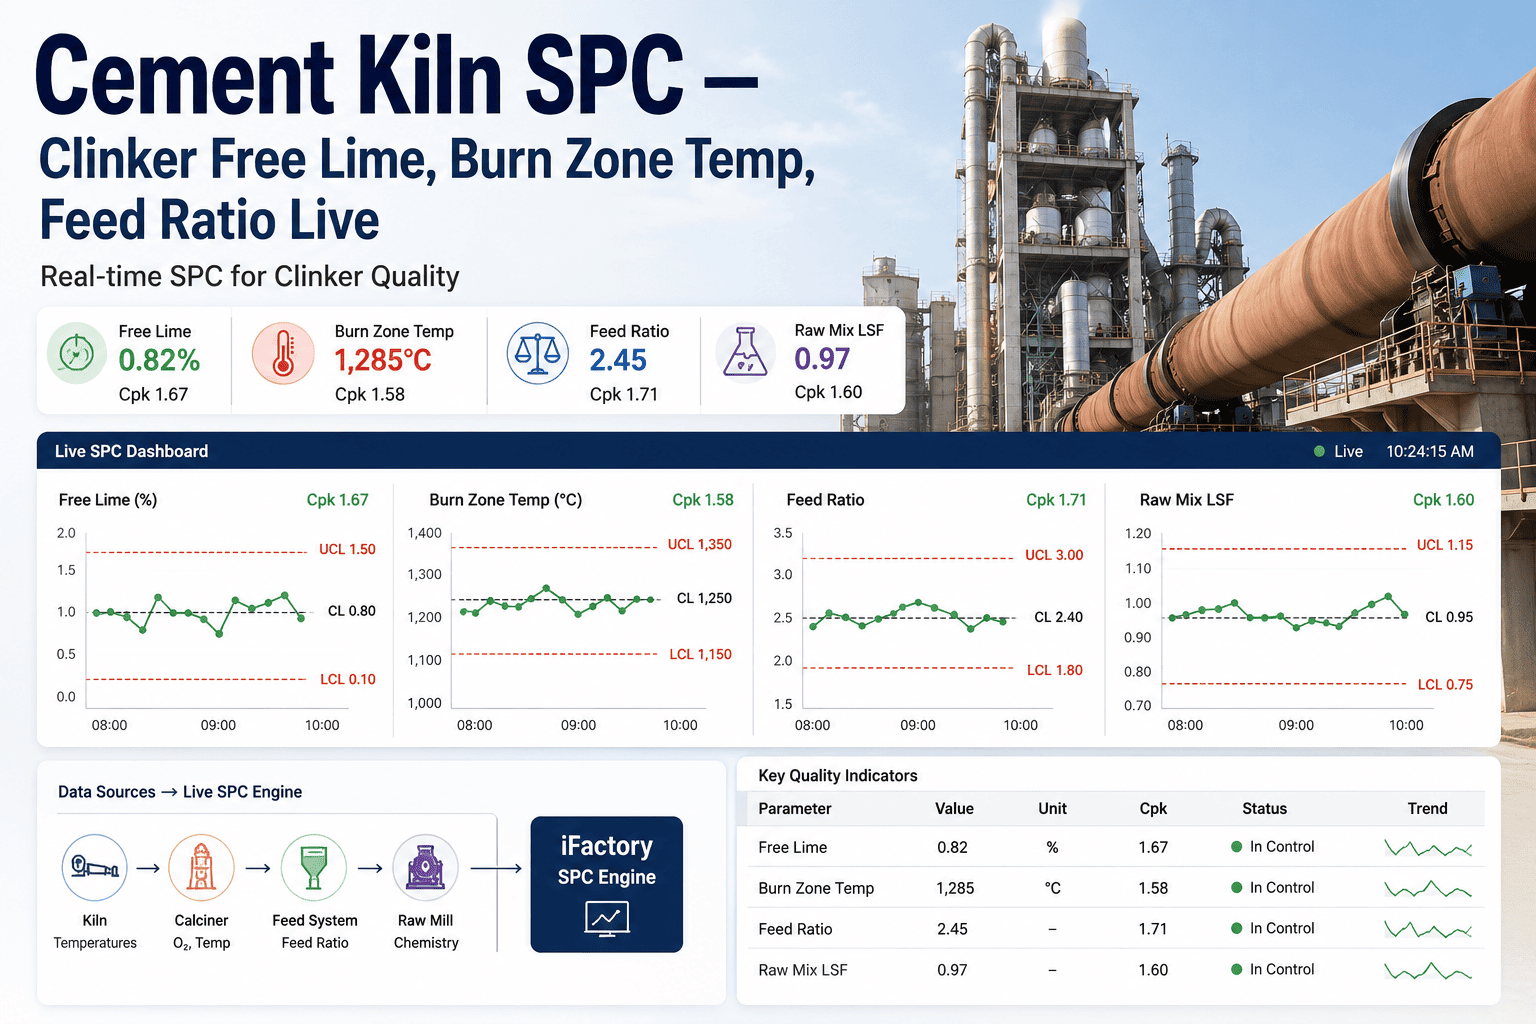
SPC: See the Drift Before It Becomes a Downgrade
A result inside the spec limit can still be a warning. Statistical process control charts every parameter against its own behavior — center line, control limits, run rules — so a free-lime creep or a Blaine trend is flagged while it is still a process adjustment, not yet a non-conformance. That is the difference between steering and firefighting.
Clinker Free Lime — Control Chart
Target 1.2% · Window 1.0-1.5%
UCL 1.5%
Target 1.2%
LCL 1.0%
In control
Run-rule warning: 4 rising points
Limit breach: NCR raised automatically
Every Parameter Charted
Free lime, LSF, Blaine, SO3, setting time, and strengths each get live control charts fed directly by lab results.
Run Rules, Not Just Limits
Trends, shifts, and runs trigger alerts inside the spec window — drift is caught while correction is still cheap.
Variability as a KPI
Standard deviation and Cpk per parameter, per shift, per silo — because consistency sells cement as much as strength does.
Strength Correlation
Early results and chemistry correlate to 28-day outcomes, so a weak lot is suspected at day 2, not discovered at day 28.
Specification Control for Every Type, Grade, and Customer
One plant ships many promises — OPC and blended types, multiple strength classes, and customers with limits tighter than the standard. iFactory holds each specification as a living document: every sample auto-checked against the right spec for its product, lot, and destination.
| Parameter | Stage | Typical Window | Checked Against |
|---|
| LSF | Raw meal / Clinker | 92 - 98 | Plant recipe target |
| Free Lime | Clinker | 1.0 - 1.5% | Burning control window |
| C3S | Clinker | 55 - 75% | Strength potential band |
| Blaine Fineness | Cement | Per type & grade | Product specification |
| SO3 | Cement | Optimum per recipe | Standard + plant limit |
| 28-Day Strength | Cement / Concrete | Per strength class | ASTM C150 / EN 197-1 + customer spec |
Multiple types, grades, and customer specs on one line? Talk to our quality team about specification control that keeps them straight.
When a Result Fails, the NCR Runs Itself
Out-of-spec is inevitable; untracked out-of-spec is optional. The moment a result breaches its limit, iFactory opens a non-conformance, holds the affected lot, and walks the team through disposition and corrective action — with the full trail an auditor expects already written.
1
Auto-Detect
Failing result raises the NCR instantly, tagged to sample, silo, lot, and shift.
2
Contain
Affected material is flagged and held before it ships or blends onward.
3
Disposition
Retest, regrind, blend down, or downgrade — decided and recorded with ownership.
4
Correct & Close
Root cause and corrective action tracked to closure, feeding the audit trail automatically.
One Quality Backbone for Lab, Process, and Maintenance
Quality findings should move the plant, not sit in a report. iFactory links lab results to process context and maintenance action — running on-premise, inside your firewall, with read-only connections to your instruments and systems.
Instrument-Direct Results
XRF, Blaine, and strength-press results land digitally — no transcription, no 3-5% error tax on your data.
Quality-Triggered Work Orders
A free-lime spike or Blaine drop can raise a maintenance work order automatically — kiln, separator, or mill checked while the signal is fresh.
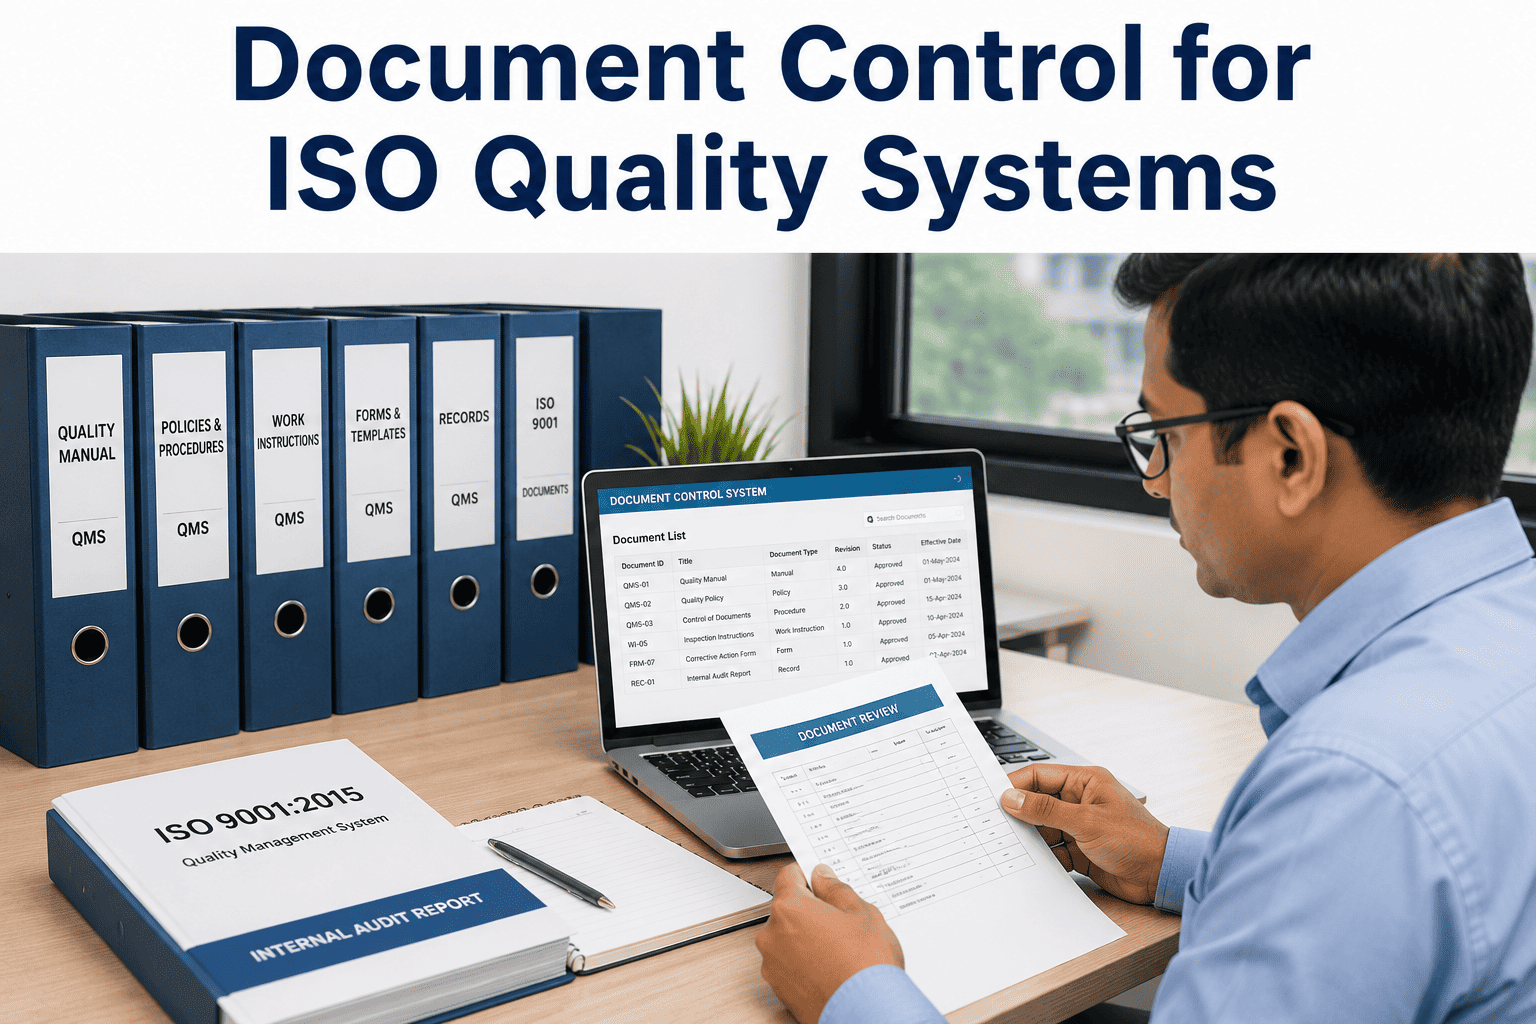
Audit-Ready by Default
Every result, spec check, NCR, and signature is one query away — conformity packs in minutes, not 40-hour compilations.
On-Prem, Read-Only
Runs on a pre-configured edge server inside your firewall; integrations are inbound-only, and your quality data stays in the plant.
What Plants Get From Connected Quality Control
Closing the gap between sample and decision converts directly into fewer downgrades, steadier strength, and audits that defend themselves. These reflect the outcomes cement plants pursue when lab, SPC, and specification control share one system.
Fewer
Downgrades
drift caught by SPC before it becomes off-spec tonnes at $5-15 each
Tighter
Strength COV
lower 28-day variability from controlled free lime, LSF, and fineness
100%
Results spec-checked
every sample lands against the right specification automatically
Minutes
To audit evidence
conformity records assembled on demand instead of 40-hour scrambles
Want your strength variability benchmarked against a connected QMS? Talk to our quality team and bring last quarter\'s COV.
Frequently Asked Questions
What does a cement QMS cover that a generic LIMS doesn\'t?
Cement-specific chemistry and workflow: LSF, silica and alumina moduli, Bogue phases, free lime windows, Blaine, SO3 optimization, and 2/7/28-day strength tracking — checked against ASTM C150 / EN 197-1 plus plant and customer specs. Generic lab software stores results; a cement QMS judges them against the right specification at every stage from raw meal to dispatch.
How does SPC reduce 28-day strength variability?
Strength variability is mostly upstream variability arriving late. Holding clinker free lime between 1 and 2% confines the inconsistency that burning passes to strength, and control charts on LSF, C3S, Blaine, and SO3 flag trends and shifts inside the spec window — so corrections happen while the parameter is drifting, not after a lot has already set the 28-day result.
What happens when a result fails specification?
An NCR opens automatically, tagged to the sample, silo, lot, and shift. The affected material is flagged for containment, disposition is recorded — retest, regrind, blend down, or downgrade — and root cause plus corrective action are tracked to closure. The entire trail is preserved for audits without anyone assembling it manually.
Can quality data trigger maintenance action?
Yes — that\'s the point of one connected backbone. A free-lime spike can raise a kiln-related work order, a falling Blaine can flag the separator or mill, and a strength trend can prompt investigation while the lot is still in the silo. Quality findings become assigned, scheduled work instead of remarks in a meeting.
What does deployment involve, and where does our data live?
The platform runs on a pre-configured edge server on-premise, inside your firewall, with read-only inbound-only connections to lab instruments and plant systems — no external egress. The fastest way to evaluate fit is a demo against your own parameters; bring your spec sheets and a quarter of lab results.
Spec It. Chart It. Prove It.
See Your Quality Chain on One Platform
Bring your spec sheets and last quarter\'s lab results. We\'ll chart your free lime, LSF, and Blaine on live SPC, show specification control across every type and customer, run an NCR end to end, and pull an audit pack in minutes — all on an on-prem server inside your firewall.
4 stages
one quality chain
Live SPC
on every parameter
Auto NCR
on every failure
On-prem
inside your firewall