A dairy plant is really five plants stitched together. A tanker bay racing to empty milk before it warms. A separator and pasteurizer that legally cannot be rushed. A filling hall where bottles fly past at thousands per hour and a half-second seal fault becomes a thousand rejects. And running through all of it, the clock on clean-in-place that no food-safety officer will let you skip. Chase OEE the way a dry-goods plant does and you will either break food safety or measure the wrong thing entirely. Lifting dairy OEE means knowing which losses are real, which are the price of safety, and where the minutes actually hide — and an iFactory analytics layer is what makes those minutes visible across the whole line.
iFactory · Dairy Manufacturing OEE
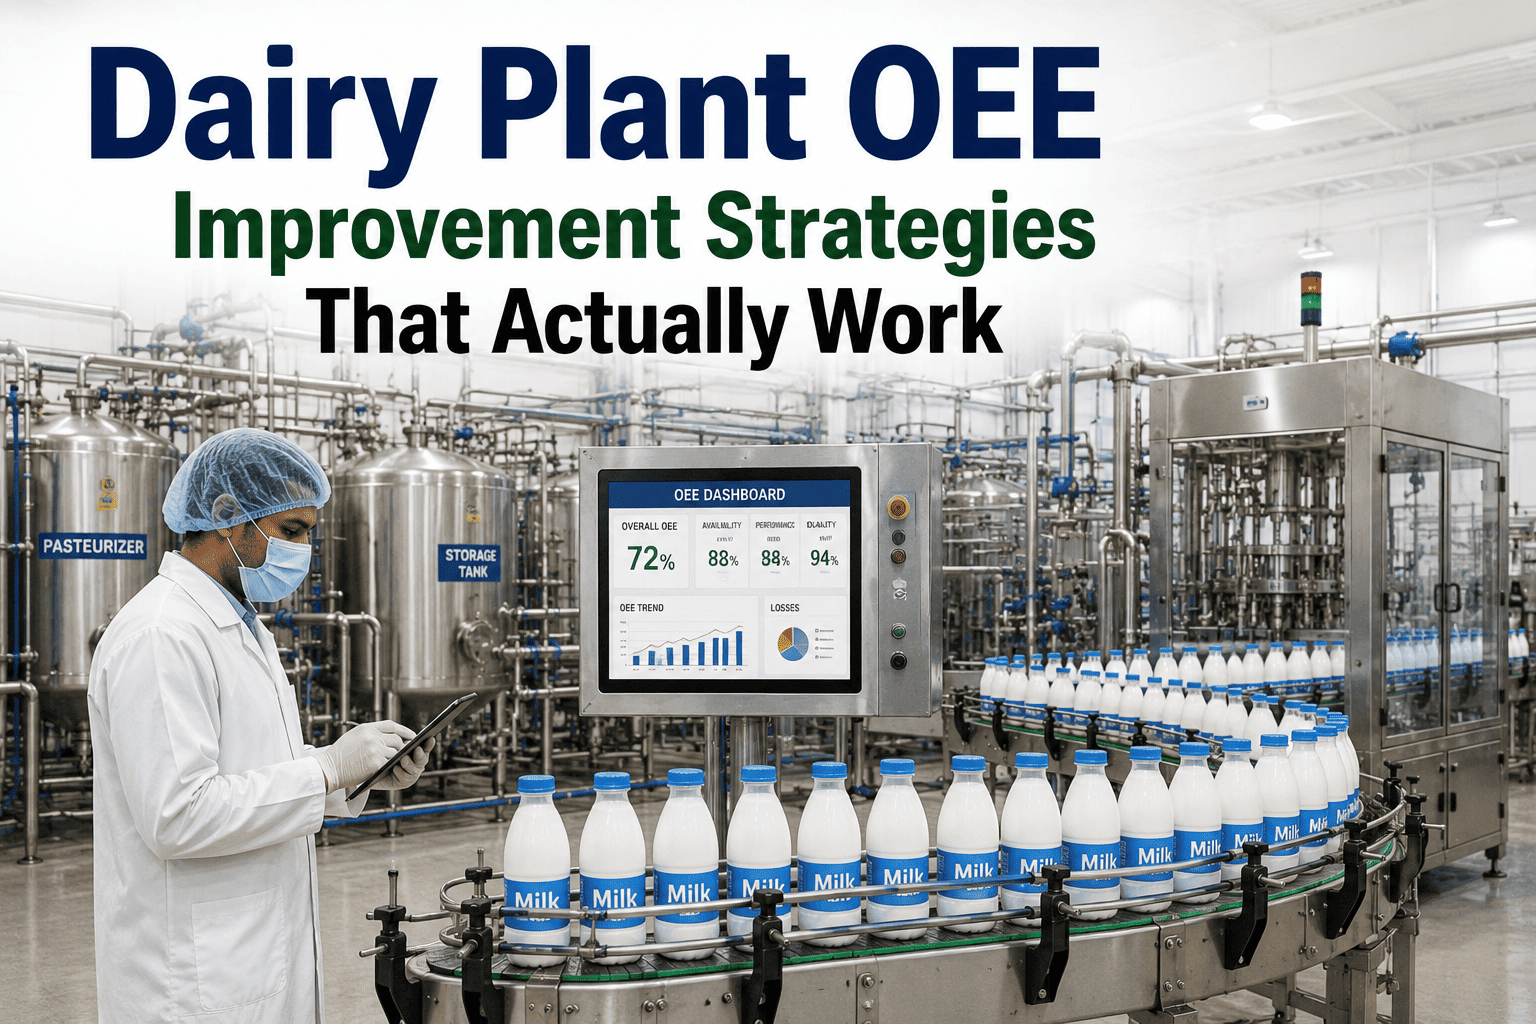
Dairy Plant OEE Strategies That Lift Output Without Breaking Food Safety
Milk reception, separation, pasteurization, high-speed filling — each stage hides its losses differently. Here is how to raise dairy OEE by attacking the real losses and leaving the safety-mandated ones alone.
82-85%
world-class F&B OEE benchmark
~10%
efficiency micro-stops hide on dairy fillers
3
components: availability x performance x quality
72°C
HTST hold you cannot rush
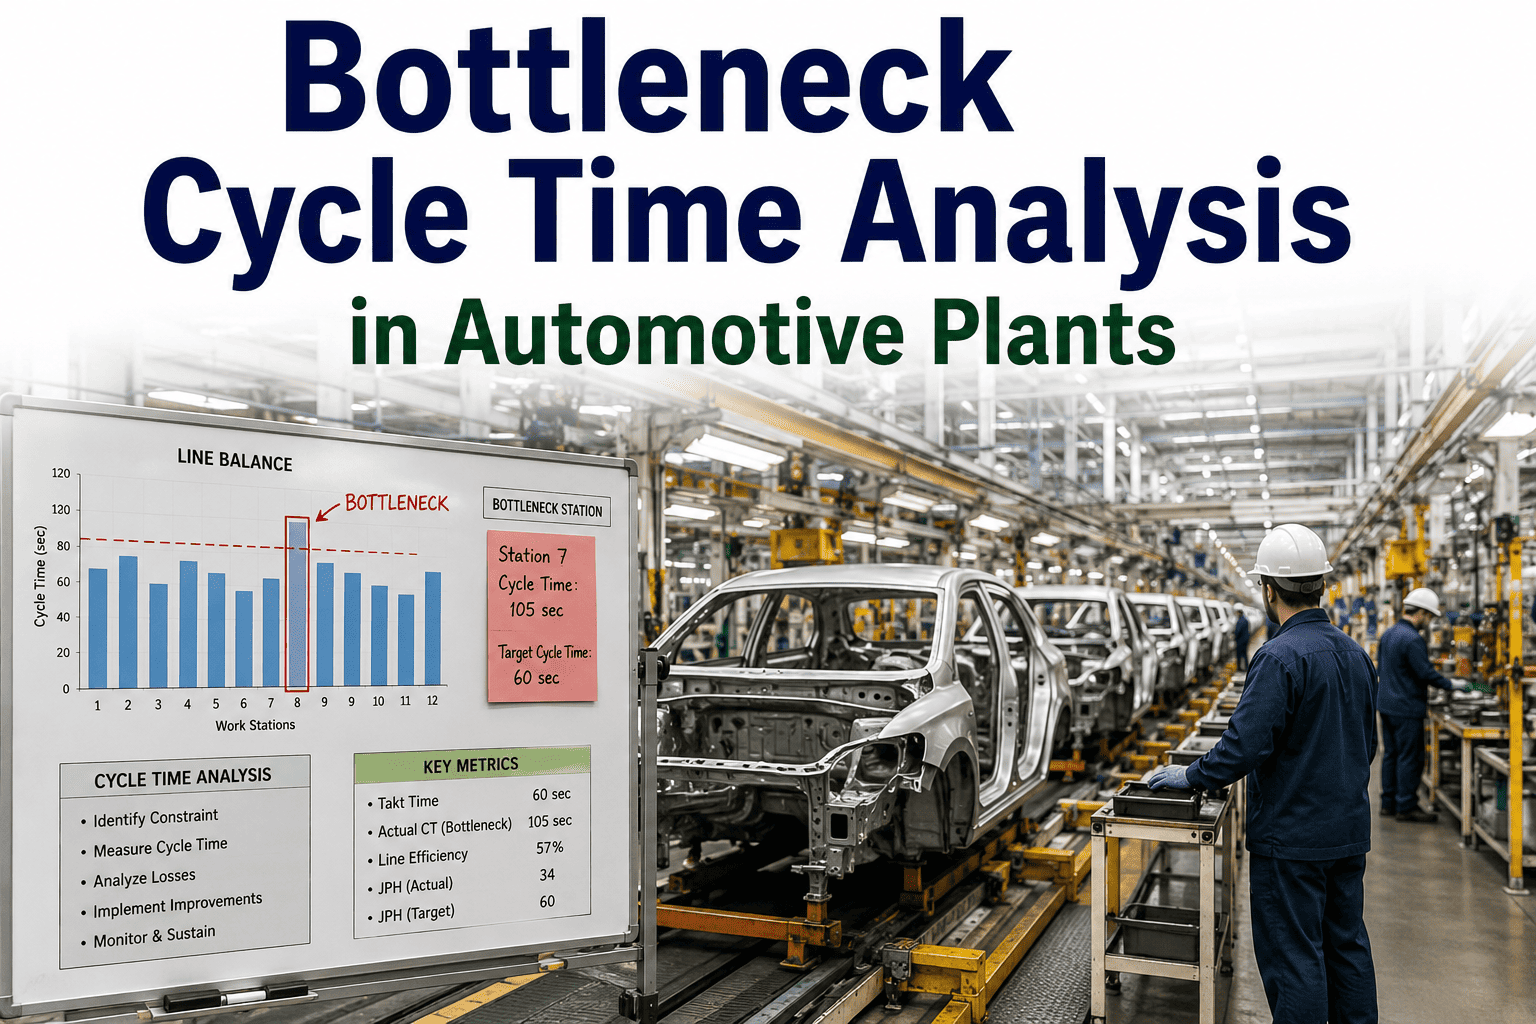
OEE in 30 Seconds — and Why Dairy Bends the Rules
OEE is three numbers multiplied together: availability times performance times quality. Availability is the share of scheduled time the line actually runs. Performance is how close it runs to its rated speed. Quality is the share of product good on the first pass. Multiply them and you get one honest percentage of your true potential. The trap in dairy is that two of those three are partly governed by food safety, not by your maintenance team. Pasteurization has a legally mandated time-temperature hold. CIP is non-negotiable. So before you can improve dairy OEE, you have to separate the loss you can fix from the loss that is the cost of making milk safe — and that distinction is where most plants go wrong.
Follow the Milk: Where Each Stage Loses OEE
The losses are not spread evenly. They cluster, and they cluster differently at each step of the milk's journey. Walk the line from the tanker bay to the pallet and the pattern becomes obvious — and so does where to point your effort first.
Availability Tankers queue, bays sit idle, warm milk risks spoilage
Fix: schedule arrivals to the bay's real unload rate, monitor flow so a slow tanker shows up as data, not a guess
02
Separation & Standardization
Performance Separator throughput drifts, fat standardization variance forces rework
Fix: trend throughput and component recovery so a 1-2% yield gain is captured, not lost in the tank
Safety limit HTST hold is legally fixed; fouling cuts regeneration efficiency over weeks
Fix: do not chase the hold time. Catch fouling early and you protect both throughput and the CCP
All three Micro-stops, conservative speed, seal and fill-weight rejects — the real bottleneck
Fix: automated downtime capture surfaces the micro-stops manual logs miss; this is where OEE is won
Want to see which of your four stages is dragging OEE the most? Talk to a dairy operations specialist and we will baseline each one on your data.
The Filling Hall: Where Dairy OEE Is Actually Won or Lost
Upstream is mostly tanks and continuous flow. The packaging line is the high-speed race against the clock, and it is almost always the true bottleneck. It is also where the most OEE hides in plain sight, because the losses are small, frequent, and nearly invisible to a manual logbook.
Micro-stops
Label web breaks, jams, a sensor fault — each a few seconds, none logged. Together they can quietly bury up to 10% of efficiency a manual log never sees.
Attack with: automated downtime tracking
Hidden speed loss
Fillers run below nameplate to dodge spillage and seal failures. Some of that is wise; some is just an old conservative setting nobody revisited.
Attack with: find the spill-free speed sweet spot
Quality rejects
Out-of-spec fill weights, failed seals, mislabels. In dairy these often cannot be reworked, so every reject is product destroyed, not recovered.
Attack with: in-line checkweigh and seal verification
Startup waste
After every CIP the line runs off-spec until it stabilizes. That product is scrapped. Frequent short runs multiply the loss across a shift.
Attack with: fewer, smarter changeovers and faster stabilization
The Loss You Must Not "Fix": Safety Is Not Inefficiency
This is the single most important idea on the page. Not every minute the line is not making product is a loss to eliminate. Some of those minutes are the price of safe milk, and coding them as waste leads to exactly the wrong actions — like pressuring a pasteurizer hold or skipping a CIP step. The skill is telling the two apart.
Attack these — real losses
CIP overrun beyond the planned, validated cycle time
Changeover minutes past a well-run SMED standard
Micro-stops and jams on the filler and labeler
Heat-exchanger fouling that slows flow over time
Fillers run slow out of habit, not physics
Respect these — the cost of safe milk
The pasteurization time-temperature hold itself
The planned, validated CIP cycle
Allergen-segregation validation between SKUs
Process slowdowns to prevent spill or seal failure
CCP verification holds on the pasteurizer
Set your ideal cycle time honestly against what the line can safely do, not against a fantasy nameplate. An OEE above 85% in dairy is usually a sign the ideal cycle time was set too soft — not that the plant is world-class.
Four Strategies That Actually Move the Number
With the real losses separated from the safety-mandated ones, four moves do most of the work. None of them touch a food-safety boundary.
1
Capture micro-stops automatically
Manual logs miss the seconds-long stops that bury up to a tenth of filler efficiency. Automated downtime tracking turns invisible loss into a ranked list of fixes.
2
Separate planned CIP from CIP overrun
Planned CIP is the cost of safe milk; overrun is loss. Coding that one distinction correctly is most of the OEE-improvement conversation in a dairy plant.
3
Shift fillers and pasteurizers to condition-based PM
Trigger maintenance on vibration, temperature, and motor current instead of the calendar. Breakdown availability losses fall sharply when PM follows the asset, not the date.
4
Link every downtime event to a cause
Three micro-stops on one conveyor in a week is not chance. Tie each event to a failure mode and PM history, and repeating losses become one-time fixes with clear ROI.
Want these four strategies scoped to your filling line and your CIP schedule? Book a demo and we will map them to your assets.
Frequently Asked Questions
What is a good OEE for a dairy plant?
World-class in food and beverage sits around 82–85%, and dedicated high-volume liquid lines can approach it. But the honest benchmark is your own line type, set against a safely achievable ideal cycle time. If a dairy line reports above 85%, the first question is whether the ideal cycle time was set too generously — the number may be flattering, not world-class.
Should CIP and pasteurization count against OEE?
The planned, validated portions are the cost of making milk safe — treat them as scheduled, not as loss to eliminate. What you do count is the overrun: CIP that runs past its validated cycle, or a pasteurizer slowed by fouling. Coding the difference between planned CIP and CIP overrun is one of the highest-value moves in dairy OEE.
Why is the filling line usually the bottleneck?
Upstream the milk moves as continuous flow through tanks and heat exchangers, which buffer variation. The packaging hall is a high-speed, discrete race where micro-stops, conservative speeds, and rejects all stack up. Because those losses are small and frequent, manual logs miss them — which is exactly why automated tracking pays back fastest there.
How do we lift OEE without risking food safety?
By attacking only the losses that have nothing to do with safety: micro-stops, CIP overrun, changeover excess, fouling, and habitual slow speeds. The pasteurization hold, validated CIP cycle, and allergen-segregation steps stay untouched. Done right, OEE improvement and food safety move in the same direction, because cleaner data also strengthens CCP verification.
Do we need to replace equipment to improve OEE?
Usually not. Improving OEE on existing assets is almost always cheaper than buying capacity. The gains come from seeing losses you currently cannot — automated downtime capture, condition-based PM triggers, and linking each event to a root cause. An analytics layer over your existing line and CMMS data is typically where dairy plants start.
Find the minutes hiding between the tanker bay and the pallet.
See Your Dairy Line's True OEE — Stage by Stage
Bring one line — reception to filling. We will baseline availability, performance, and quality at each stage, separate the real losses from the safety-mandated ones, and show you exactly where the recoverable OEE is. Turnkey analytics over your existing data: pre-configured, integrated to your line and CMMS, with CIP and CCP tracking built in. Live in weeks, not quarters.
~10%
filler efficiency micro-stops hide
4
stages, mapped and baselined
CIP
overrun split from planned
Weeks
to live on your line