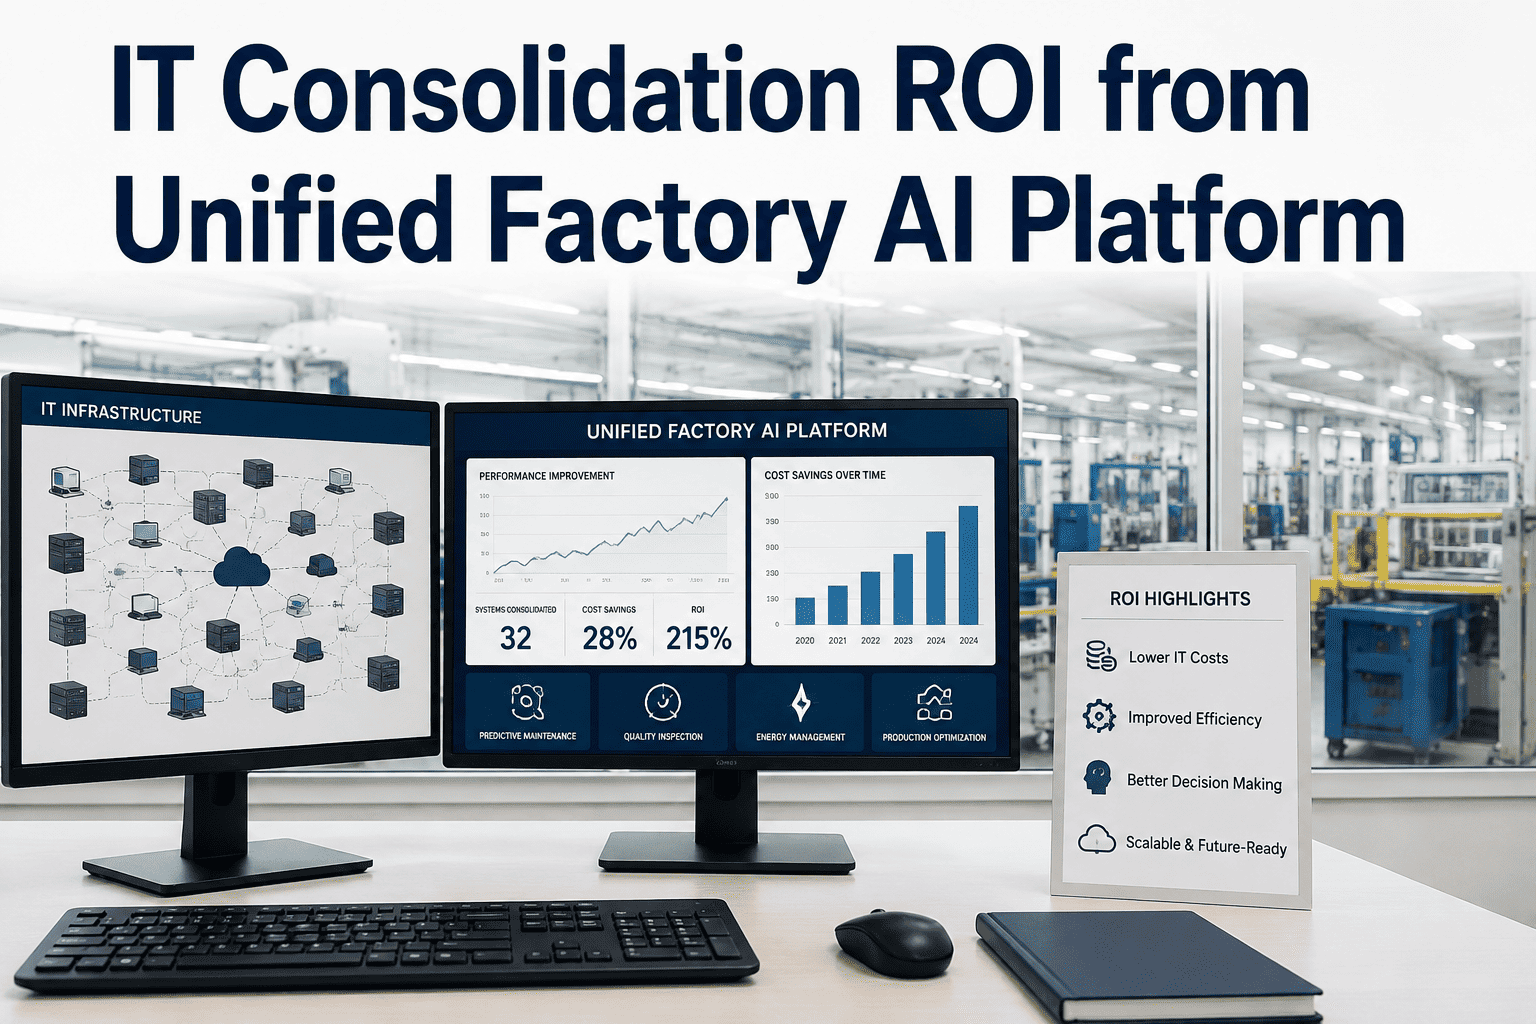
Most manufacturing IT budgets account for what shows up on a vendor invoice — the MES license, the annual CMMS renewal, the QMS support contract. These visible costs represent roughly half of what a 10-tool point-solution stack actually costs to operate. The other half sits underwater: integration labor, middleware subscriptions, duplicate training, data reconciliation hours, and the IT headcount consumed keeping connections alive between systems that were never designed to talk to each other. When a finance team builds a business case for IT consolidation, they almost always undercount these hidden costs — which means they also undercount the savings available from eliminating them. iFactory's unified factory AI platform replaces the entire point-solution stack with one connected system — and this page gives you the formulas, input variables, and worked example to prove it to your CFO.
Visible software costs — license fees, annual support, user seats — represent the tip of the iceberg. The following seven cost categories sit below the waterline and are systematically excluded from point-solution TCO analyses. Including them changes the consolidation ROI calculation entirely.
The consolidation ROI formula has two components: total annual savings from retiring the point-solution stack, and the total investment in the unified platform. The formula below uses standard finance conventions so it drops directly into a CFO presentation or capital appropriation request.
| Variable | Meaning | Typical Range | Where to Find It |
|---|---|---|---|
| IL | Integration labor eliminated | $80K–$250K/yr | IT ticket system; ask IT manager for hours × loaded rate |
| MW | Middleware subscriptions retired | $30K–$120K/yr | IT budget; vendor invoices for integration platforms |
| DL | Duplicate license overlap eliminated | 20–35% of license total | Compare feature matrices of overlapping tools |
| RL | Reconciliation labor eliminated | $15K–$60K/yr per analyst | Survey analytics team on weekly reconciliation hours |
| TO | Vendor management overhead eliminated | $40K–$90K/yr | IT director estimate: hours/vendor/month × vendors × rate |
| TR | Training redundancy eliminated | $400–$1,200/user/system/yr | Training department records; HR onboarding data |
| TI | Time-to-insight delay cost eliminated | $260K–$1,040K/yr | Decisions/week × avg decision value × delay hours |
| Variable | Meaning | Typical Range | Note |
|---|---|---|---|
| PL | Platform license cost | $90K–$180K/yr | Replaces all point-solution licenses |
| IM | Implementation cost | $60K–$130K one-time | Amortize over 3 years in NPV model |
| TRp | Platform training (Year 1) | $15K–$40K one-time | One system to learn vs eight — typically 60–70% less than stack training |
| CH | Change management cost | $15K–$35K one-time | Process documentation, workflow mapping, user adoption |
The table below models a representative 400-employee discrete manufacturer running 10 point solutions. All figures are conservative mid-range estimates; your plant's actual numbers will differ based on stack complexity, IT team size, and user count. Use this as a starting structure, then replace each row with your own data.
| Cost Category | Point Solutions Yr 1 | Point Solutions Yr 3 | iFactory Yr 1 | iFactory Yr 3 | 3-Yr Saving |
|---|---|---|---|---|---|
| Software licenses | $185,000 | $217,000 | $120,000 | $138,000 | $201,000 |
| Integration labor (internal IT) | $142,000 | $158,000 | $18,000 | $20,000 | $366,000 |
| Middleware subscriptions | $64,000 | $72,000 | $0 | $0 | $204,000 |
| Duplicate license overlap | $52,000 | $61,000 | $0 | $0 | $171,000 |
| Reconciliation labor | $38,000 | $42,000 | $6,000 | $7,000 | $96,000 |
| Vendor management overhead | $68,000 | $74,000 | $8,000 | $9,000 | $183,000 |
| Training (new hires + updates) | $44,000 | $49,000 | $11,000 | $13,000 | $108,000 |
| Security audit complexity | $22,000 | $26,000 | $5,000 | $6,000 | $54,000 |
| Implementation / migration | — | — | $95,000 | $0 | −$95,000 |
| Change management | — | — | $28,000 | $0 | −$28,000 |
| Total Annual TCO | $615,000 | $699,000 | $291,000 | $193,000 | $1,260,000 |
The following worked example uses a composite plant profile representative of a mid-market discrete manufacturer. Every cost figure is derived from the input variable ranges in the formula section above — replace the inputs with your own numbers to produce your plant's ROI.
Using the Meridian example above, the table below shows cumulative investment against cumulative savings across 36 months. The break-even point falls at approximately month 9, after which every month generates net positive return. Year 2 and Year 3 savings accelerate as implementation costs are fully absorbed.
| Period | Cumulative Investment | Cumulative Savings | Net Position | Status |
|---|---|---|---|---|
| Month 1–3 (Implementation) | $210,000 | $0 | −$210,000 | Implementing |
| Month 4 (Go-live) | $242,000 | $47,000 | −$195,000 | Ramping |
| Month 6 | $242,000 | $141,000 | −$101,000 | Ramping |
| Month 9 (Break-even) | $242,000 | $282,000 | +$40,000 | Break-Even |
| Month 12 (End of Year 1) | $242,000 | $326,200 | +$84,200 | Positive ROI |
| Month 24 (End of Year 2) | $360,000 | $652,400 | +$292,400 | Positive ROI |
| Month 36 (End of Year 3) | $478,000 | $1,260,000 | +$782,000 | Positive ROI |
Consolidation ROI is only realizable if the project is executed well. The following checklist identifies the eight organizational conditions that predict successful consolidation — and where gaps exist, highlights what needs to be resolved before committing to a platform migration.
The most common mistake I see when manufacturers build a consolidation business case is treating software licenses as the entire cost of the current stack. When I sit down with a plant controller and we actually map out integration labor, middleware costs, vendor management hours, and reconciliation time, the visible license costs typically represent 35–45% of the true TCO. The remaining 55–65% has been hiding in IT timesheets, analyst hours, and budget lines that were never labelled as software costs. The moment you surface those numbers, the consolidation ROI becomes obvious — not marginal. The payback calculation changes from "18–24 months" to "under 12 months" almost every time. The business case was always there; it just needed the right cost inventory to become visible.
Start with a complete hidden cost inventory before touching any license cost figures. The ROI formula is: Total Annual Savings (all seven cost categories eliminated) minus Total Platform Investment, divided by Total Platform Investment. The critical insight is that most plants undercount savings by 40–60% when they omit integration labor, middleware subscriptions, and reconciliation costs. Use the variable table above to collect inputs from your IT director, plant controller, and training department — the full data collection exercise takes 2–4 hours and produces a model that can withstand CFO scrutiny. For a structured walkthrough of your specific stack, book a 30-minute platform audit session with iFactory's solutions team.
A complete point-solution TCO includes seven categories that vendor-provided TCO calculators almost never include: integration labor (IT hours maintaining connections between tools), middleware subscriptions (MuleSoft, Boomi, Azure Logic Apps, ETL pipelines), duplicate license overlap (functionality covered by two tools simultaneously), data reconciliation labor (analyst hours resolving discrepancies between systems), vendor management overhead (renewal cycles, support escalations, security audits), training redundancy (each system requiring separate onboarding for every new hire), and time-to-insight delay cost (production decisions slowed by manual data assembly across disconnected systems). For a 10-tool stack, these hidden categories typically add $250,000–$600,000 to the annual TCO that license-only analyses miss entirely. Contact iFactory support for a customizable hidden cost template in spreadsheet format.
A well-managed consolidation for a 200–600 employee manufacturer with 8–12 point solutions typically runs 90–180 days from contract signature to go-live, with the following phase structure: data preparation and integration mapping (weeks 1–4), platform configuration and workflow setup (weeks 4–10), parallel running and user acceptance testing (weeks 10–14), and cutover with hypercare support (weeks 14–20). The single most common cause of timeline extension is undocumented integrations discovered after the project starts — which is why the readiness checklist above includes integration architecture documentation as a pre-project requirement. Plants that complete the readiness checklist before signing consistently achieve faster go-lives than those that start with gaps. Book a demo to see the iFactory implementation methodology and typical timeline for your stack profile.
For a plant running 8–12 point solutions with active middleware and a dedicated IT integration function, the realistic payback range is 7–14 months when all seven hidden cost categories are included in the savings model. The Meridian worked example above shows 9-month payback on a conservative savings estimate. Payback is faster when: the existing stack has high middleware costs, IT headcount is partially dedicated to integration maintenance, and the current stack has significant license overlap between tools. Payback extends beyond 14 months when: the stack is relatively lean (fewer than 6 tools), middleware costs are low, or the plant is paying below-market license rates on existing tools through long-term contracts. Request the iFactory ROI model template to build your plant's specific payback projection.
Frame the business case as IT consolidation first and AI capability second — CFOs who are skeptical of AI claims respond much better to a defensible TCO comparison than to productivity improvement projections that require assumptions about AI performance. Lead with the hidden cost inventory: show the current 10-tool stack TCO including all seven cost categories, compare it to the unified platform TCO, and let the math make the argument. Only after establishing the consolidation ROI should you introduce the AI-specific value (predictive quality, vision inspection, production optimization) as additional upside that is not required for the payback calculation to work. This framing — "the consolidation alone pays back in 9 months; the AI capabilities are incremental value on top" — is the approach that consistently converts skeptical CFOs into approvers. Book a session and we can help you prepare the financial presentation for your specific CFO's priorities.