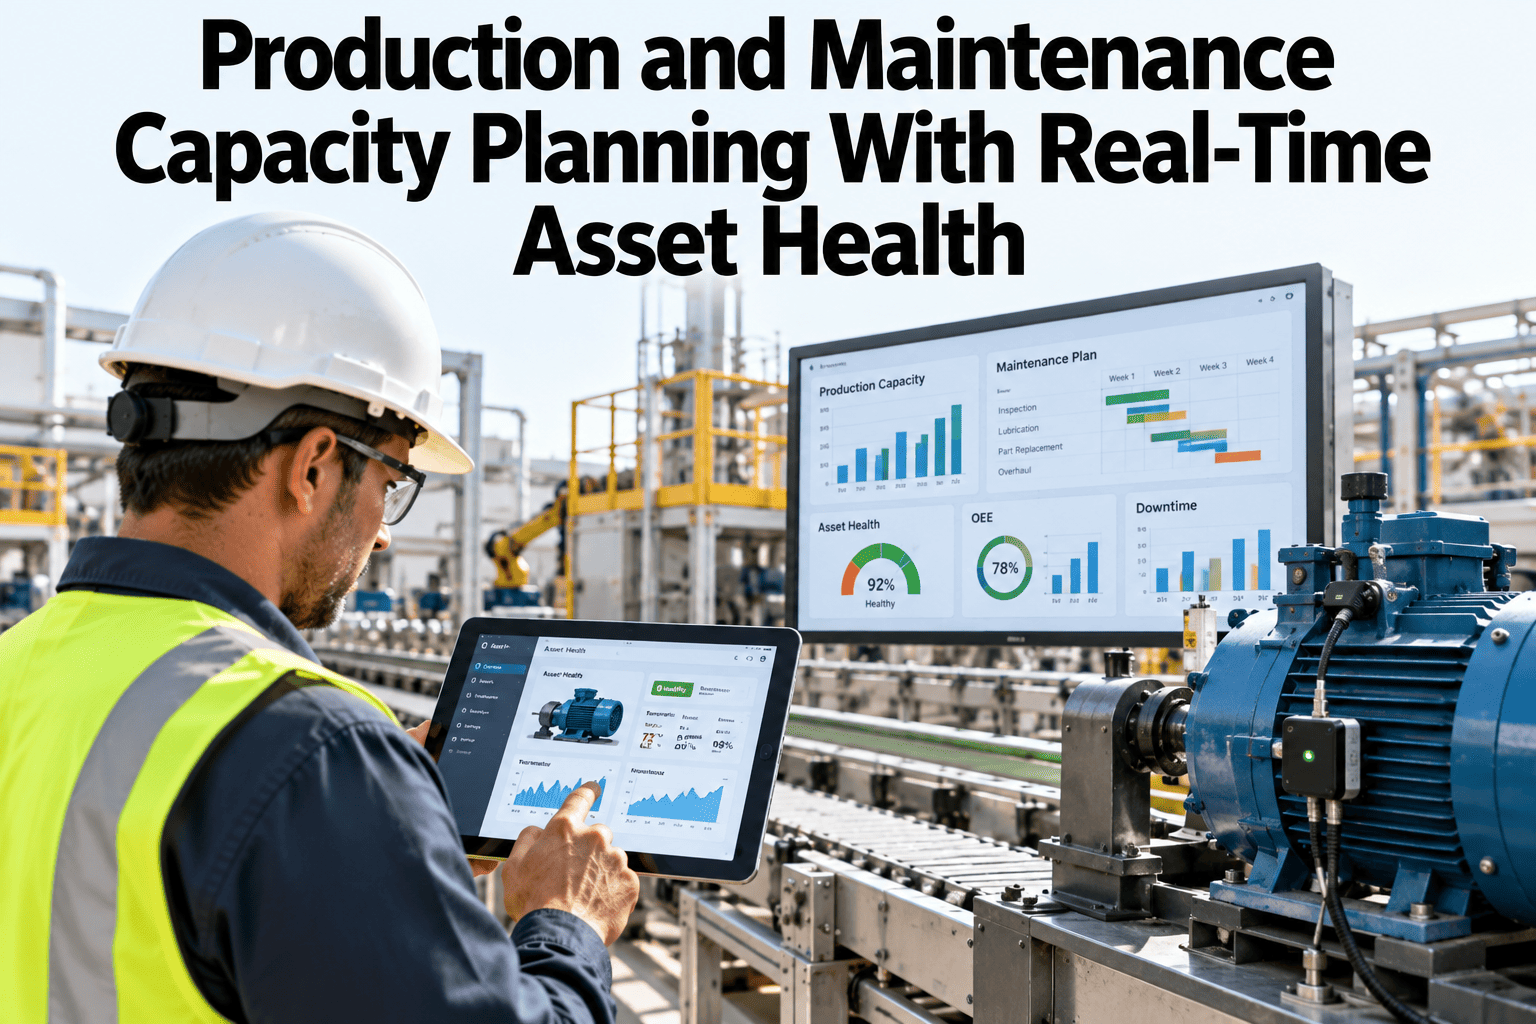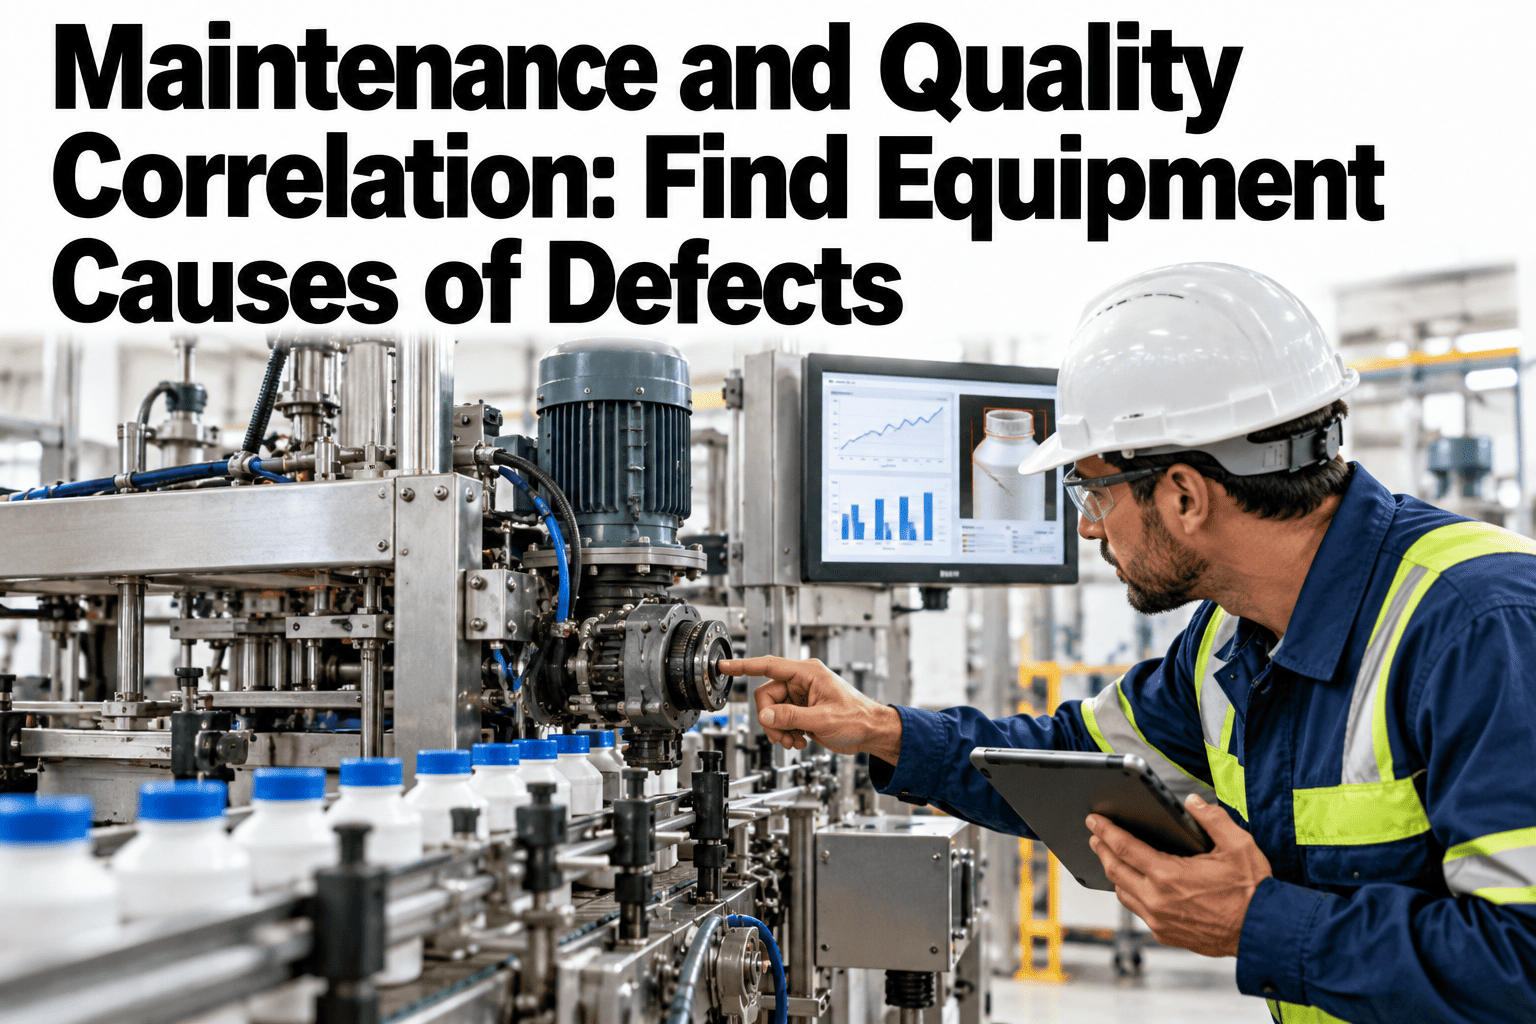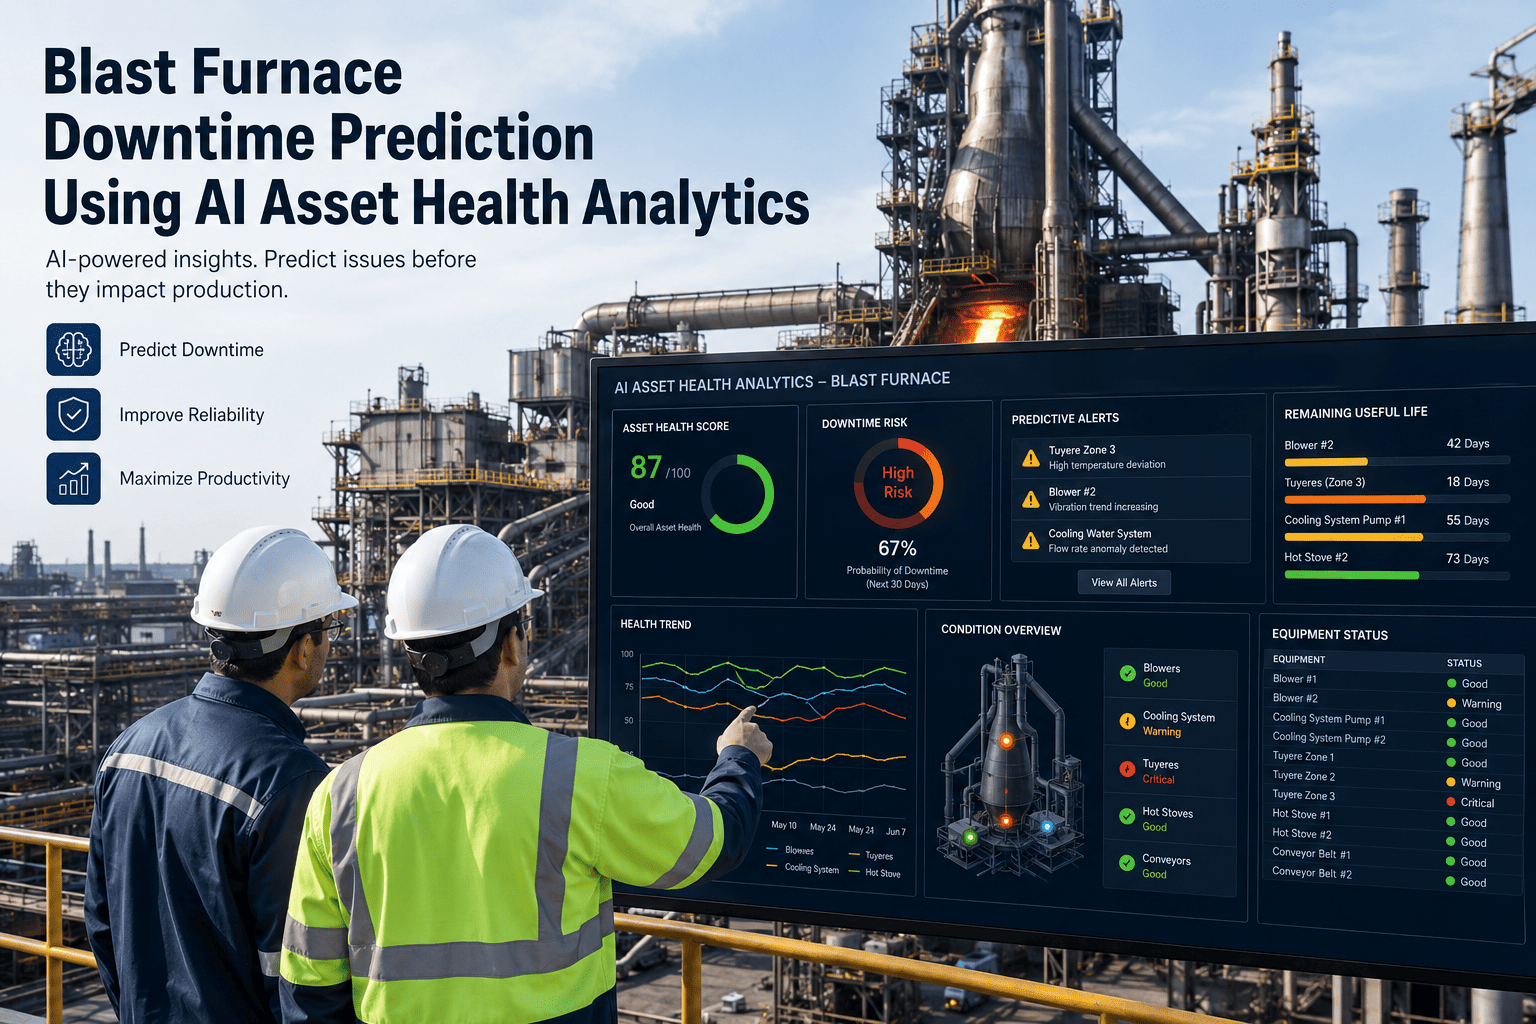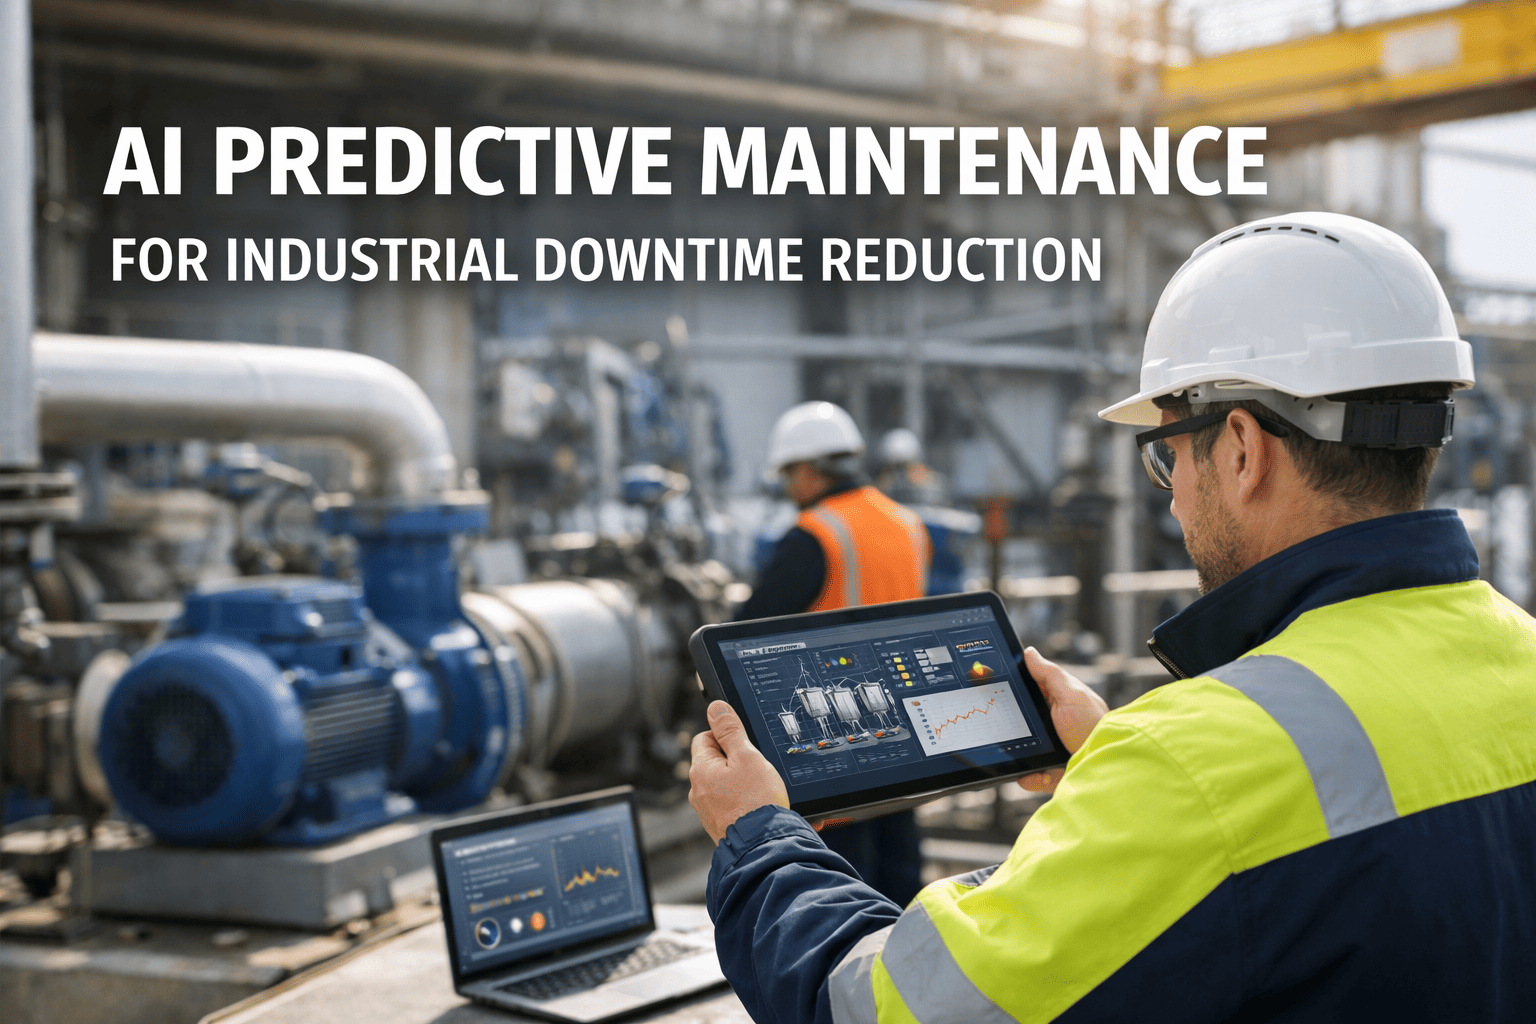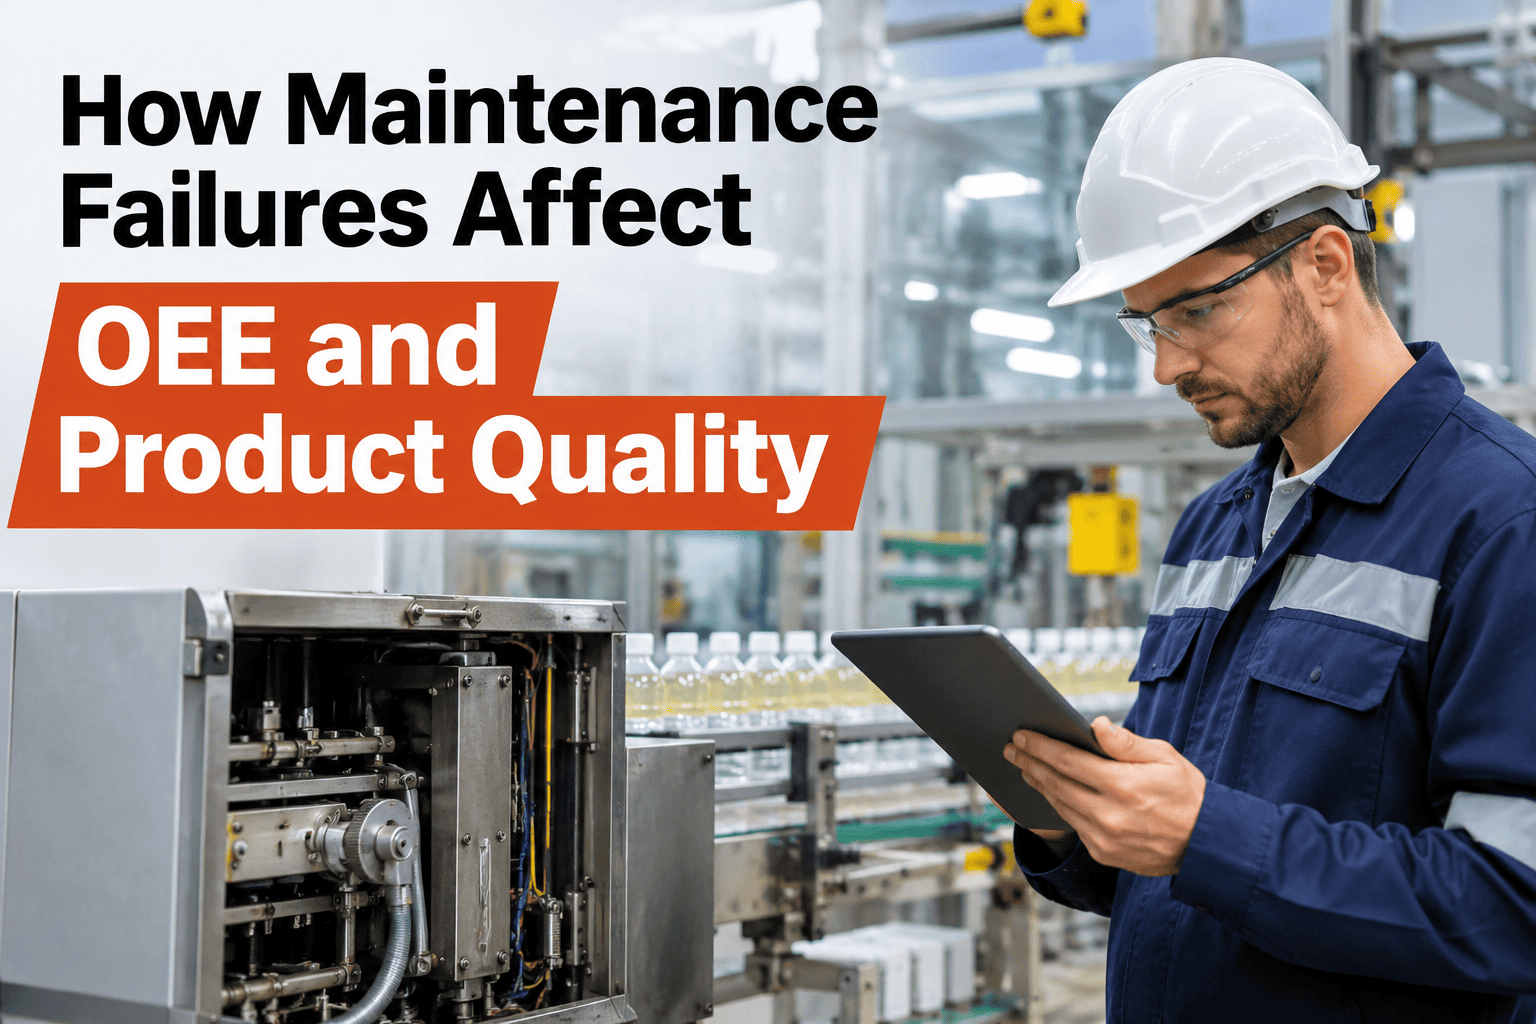
Maintenance failures hurt OEE and product quality in three ways: they stop the line and cut availability, they slow it with small stops and reduced speed, and they let worn equipment drift until process variation produces defects. The last pathway is the least visible, because a machine can keep running while it slowly makes worse product. Heavy industry and building materials plants typically run at 50 to 60 percent OEE, and unplanned downtime is the biggest loss driver (TeepTrak, 2026). iFactory, an on-premise AI platform for smart manufacturing, links asset health to quality and OEE, and teams can follow a real wear pattern from sensor signal to defect on their own equipment in a short session.
A Machine Does Not Fail in a Day. It Fades, and Quality Fades With It.
iFactory AI tracks asset condition against product quality, so wear is caught while the line is still running well.
How Do Maintenance Failures Reduce OEE?
Each OEE factor has its own maintenance pathway. Overall equipment effectiveness (OEE) is availability times performance times quality, so a failure that touches all three costs more than it appears.
Most plants track the first pathway well and the third barely at all. To see all three on your assets, ask our team how maintenance data is linked to OEE factors.
What Do 2026 Benchmarks Say About Losses?
The biggest loss driver differs by sector, but equipment condition appears in most of them.
| Sector | Typical OEE | World-Class OEE | Biggest Loss Driver |
|---|---|---|---|
| Automotive and tier-1 | 60–70% | 85%+ | Changeovers, micro-stops |
| Food and beverage | 55–65% | 80–85% | Sanitation, speed loss |
| Packaging | 55–65% | 80–85% | Jams, minor stops |
| Heavy industry and building materials | 50–60% | 75–80% | Unplanned downtime |
Find the Wear Hiding Inside Your Quality Loss
Share asset history and defect records. iFactory AI will show which machine conditions travel with your rejects.
How Does Equipment Wear Turn Into a Defect?
The chain runs through physical change. Each link is something a different team sees.
No one team sees the whole chain, so the cause is rarely named. For a view that joins the links, review a wear-to-defect chain with our specialists.
Which Asset Conditions Lead to Which Quality Problems?
| Asset Condition | Early Signal | Quality Symptom | OEE Factor Hit |
|---|---|---|---|
| Worn bearing | Vibration and heat rise | Surface marks, size drift | Quality, availability |
| Degraded seal or gasket | Pressure or flow instability | Leaks, fill variation | Quality, performance |
| Misaligned guide or belt | Rising jams and skew | Damaged or misplaced product | Performance, quality |
| Weak heater or cooler | Temperature lag and swing | Poor seal or cure | Quality |
| Worn cutting tool | Rising motor current | Burrs, rough finish | Quality, availability |
Which Maintenance Approach Protects Quality Best?
Reactive repair protects nothing in advance. Condition-based maintenance acts on the signal, so it fixes wear before variation begins.
Predictive maintenance is the same idea powered by AI, forecasting when a condition will cross a limit. To discuss it for your assets, ask support how condition signals are chosen.
What Should Maintenance Do Differently for Quality?
iFactory is delivered on an on-premise NVIDIA server, live in 6–12 weeks, with integration, training and 24×7 remote monitoring in scope.
What Mistakes Hide the Link Between Maintenance and Quality?
Most plants hold the evidence but never join it. Six habits keep the link hidden.
Small changes to work-order habits often reveal the link within weeks. For ideas, ask our team about quality checks after repairs.
Which Terms Connect Maintenance and Quality?
Eight terms help both teams talk about the same problem.
To apply these terms to your assets, walk through an asset health review with our team.
Linking Maintenance and Quality Responsibly
Frequently Asked Questions
Fix the Machine Before It Spoils the Product
Book a session to see iFactory AI connect asset health, OEE and quality on your own equipment.