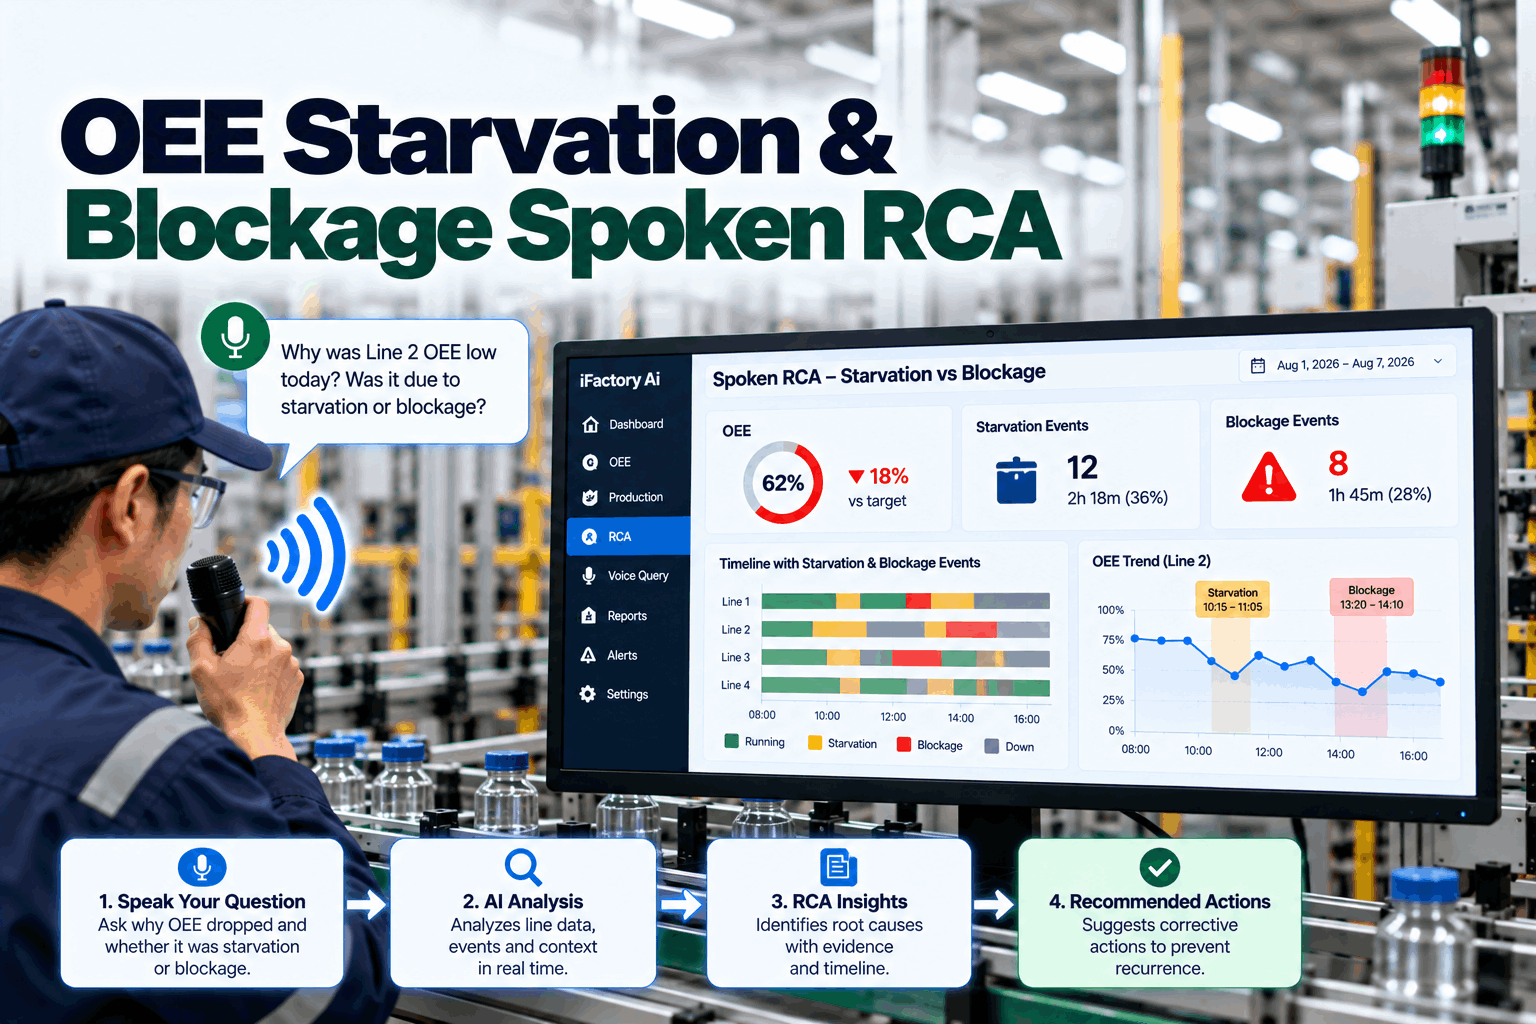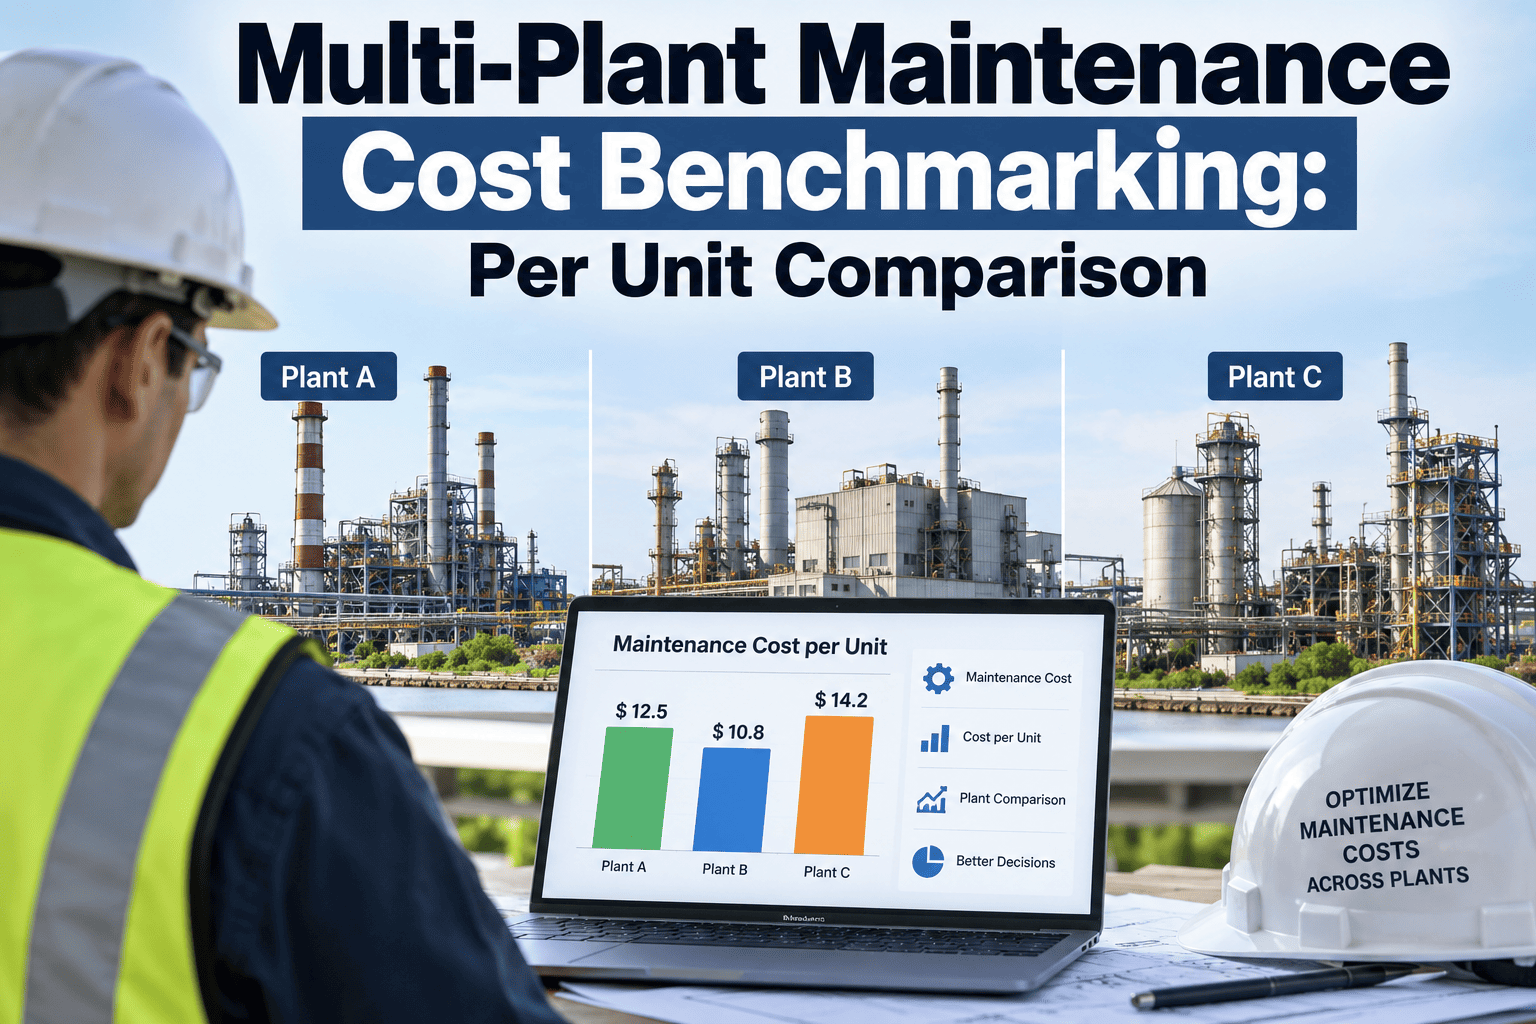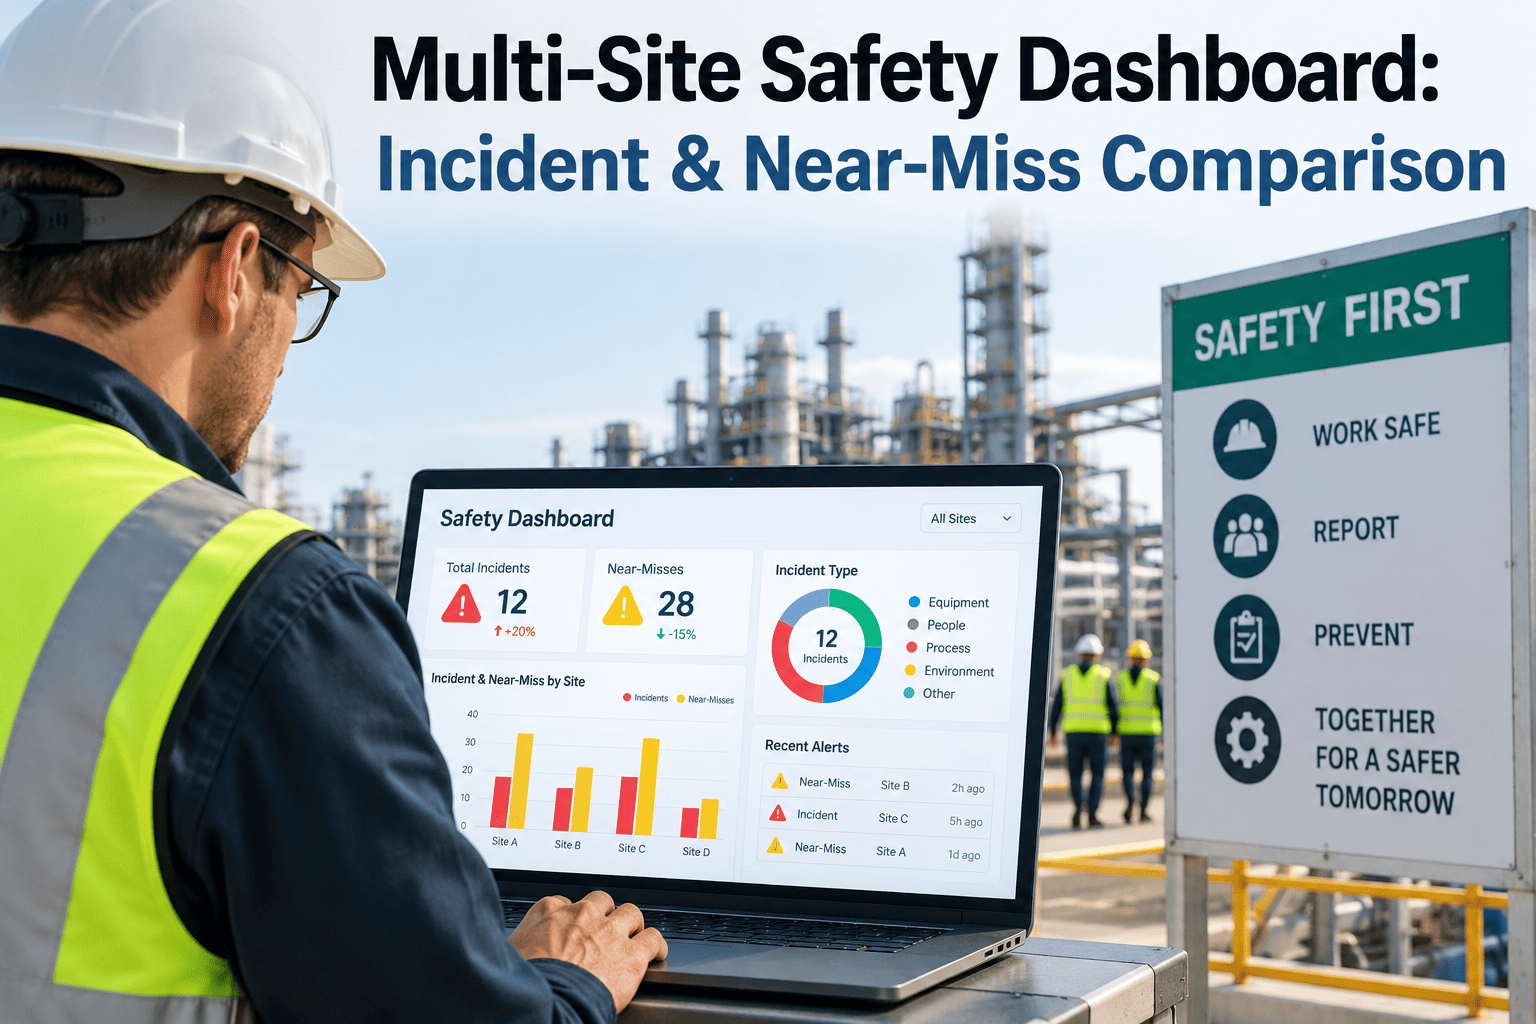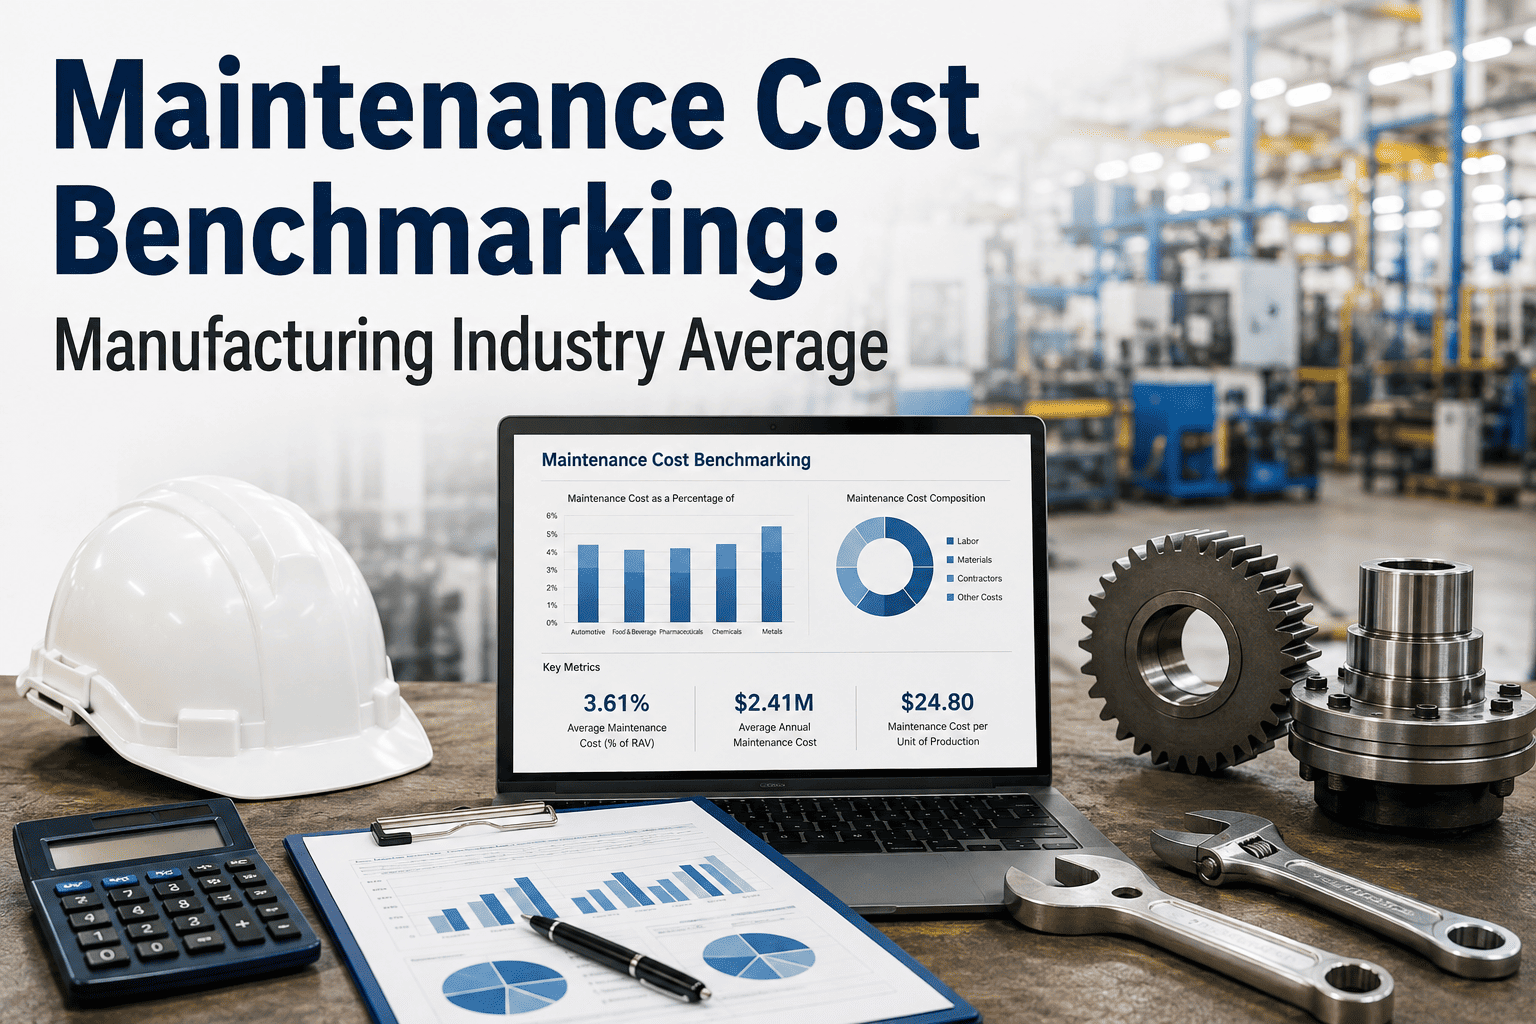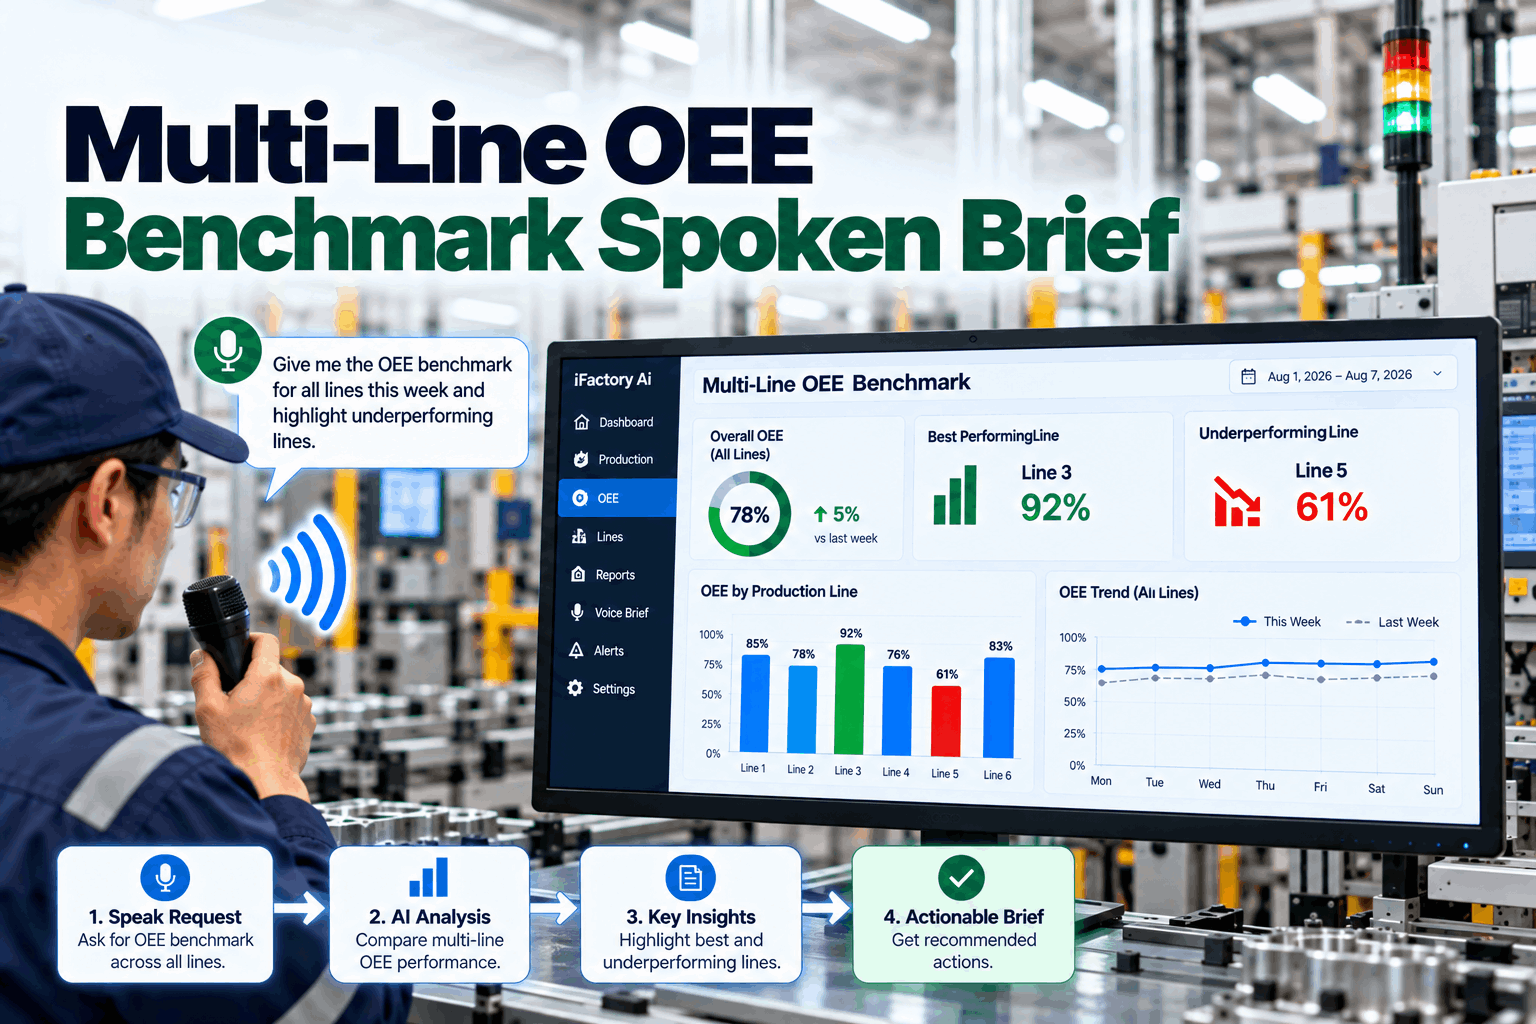
Three lines report the same OEE for the same week, and the operations excellence director needs a fair comparison rather than a debate over whose dashboard is right. In that moment, a multi-line OEE benchmark spoken brief has to turn mixed reporting logic into a clear, evidence-linked explanation the plant teams can act on. iFactory AI overlays your MES, QMS, historian, and SPC stack with a spoken analytics layer that labels every assumption, cites the evidence behind each claim, and keeps plant-team action ownership intact. Book a 30-minute walkthrough of three-line OEE comparison done fairly.
Three lines report the same KPI differently. The task is not to pick a winner — it is to compare like with like and label the rest.
At a Glance
Why the Same OEE Number Can Mean Different Things
OEE looks simple until you compare across lines. One line may count microstops as downtime; another may bury them inside performance loss. One line may include startup scrap in quality; another may separate it. One line may stop the clock at shift end; another may roll the event forward into the next shift. The KPI still says OEE, but the logic underneath is not the same. That is why a benchmark needs more than a scorecard. It needs the underlying definitions — planned production time versus scheduled time, run time versus downtime, speed loss versus stop loss, event boundary rules, and simultaneous event resolution.
Without that structure the comparison can look precise while being materially unfair. A good cross-line benchmark begins with the rulebook. Before the director asks which line is better, the team should confirm how each line data model works.
Comparability Checks Before Naming a Winner
A line running short, complex, frequent-changeover SKUs will rarely behave like a line running long stable campaigns. Compare product families first.
Shift coverage, handoffs, operator experience, maintenance presence, and break timing can distort a line-to-line read.
A line with more quality holds is not always worse — it may have tighter detection or a different inspection point.
If one line logs a 90-second interruption as microstop and another escalates it to downtime, the benchmark is not comparing the same thing.
Automation level, line age, upstream supply stability, and packaging constraints all matter — label them.
Are all lines using the same shift calendar, planned downtime, and production window?
What iFactory Delivers
iFactory builds the cross-line comparison your OpEx review needs: same rulebook, labeled assumptions, evidence behind every statement.
How each line counts microstops, defects and shift boundaries, side by side.
SKU mix, shift pattern, staffing and quality-hold logic stated for every comparison.
Every statement in the brief tied to MES, QMS, historian or SPC records.
A concise spoken brief for the director, with the detail one question away.
Each follow-up assigned to the plant team that owns it.
An emailed report for the network review, same rulebook every week.
Bring last week OEE from three lines. We walk through event contract, SKU mix, shift pattern, and evidence-linked brief — beside your existing MES and QMS.
A Spoken Brief That Labels Every Assumption
A spoken brief is useful when the director needs fast clarity without losing rigor. It should sound concise, but every statement must be backed by evidence and assumptions. The output is not a ranking — it is a review the plant teams can act on.
- Assumption label — what changed between lines and what stayed constant
- Event contract label — how stops and defects were counted
- SKU mix label — whether the lines are producing similar product complexity
- Shift label — which shifts are included and what the staffing patterns are
- Evidence label — which MES, QMS, historian, or SPC records support the statement
- Ownership label — which plant team owns the next action
Illustrative Scenario — Three Lines, Three Stories
Line A shows lower availability because its event contract counts microstops as downtime. Line B shows weaker quality because defects are recorded at final inspection and tied to genealogy. Line C appears strongest overall, but its SKU mix is simpler and its changeovers are less frequent. A superficial ranking says Line C wins. A defensible brief says Line A is losing time in short interruptions being classified as downtime, Line B is carrying more quality loss and should be reviewed with QMS and genealogy evidence, and Line C is not directly comparable unless the SKU mix and changeover burden are normalized or at least disclosed. That is the difference between a KPI and a decision-ready comparison.
Once the brief is delivered, the plant teams still own what happens next. Line A may work with maintenance and controls to review the microstop threshold and confirm whether classification changes are warranted. Line B may run a genealogy check with QMS to see whether the defect pattern points to a supplier lot, a specific machine window, or a shift changeover. Line C may simply be documented as strongest under its current SKU mix, with a note that the ranking is not directly transferable. Each of those follow-ups is a plant decision, not a headquarters decree. The role of the spoken brief is to make the reasoning visible so the plant teams can act with confidence and so the OpEx director can share progress across the network without misrepresenting what each line accomplished.
Frequently Asked Questions
Start by grouping like products, then compare the same time window, event contract, and loss taxonomy. If SKU complexity differs, label that assumption rather than hiding it.
Because the counting logic may differ — stop thresholds, defect timing, shift boundaries, quality-hold rules, or event classification can all change the result.
It is the rule set that defines what counts as a stop, a defect, a loss bucket, and how overlapping or boundary events are handled.
Shifts can change staffing, handoffs, maintenance timing, and start-up behavior. A fair brief should break out line performance by shift when possible.
It turns raw KPI data into a concise, reviewable explanation that labels assumptions, links evidence, and keeps action ownership with the plant team.
A fair multi-line comparison is not about forcing one number to dominate the conversation. It is about a spoken, evidence-linked brief that shows what each line counted, what it excluded, and what the plant team should do next.