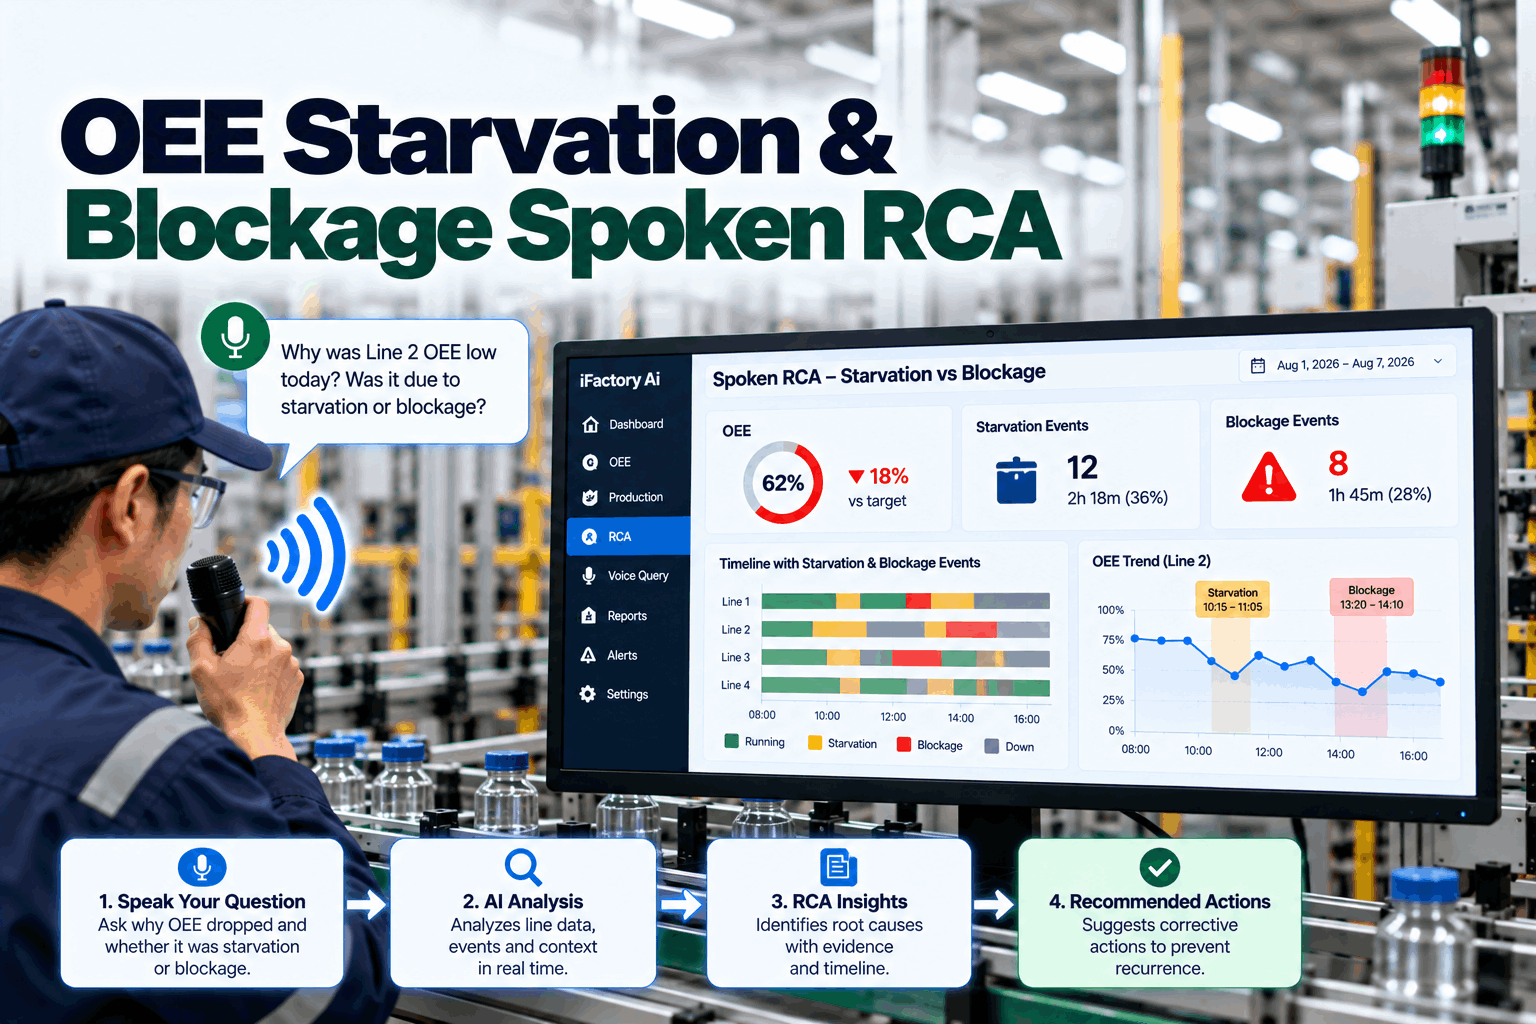
A morning leader stares at a dashboard full of tiny stops and asks the same question every plant eventually asks — why did the line lose minutes to starvation and blockage when nothing big failed? The answer is rarely one dramatic machine fault. It is a pattern hidden in line event history, buffer states, and shift context. iFactory AI overlays your MES, QMS, historian, and SPC stack so short starvation and blockage events become a testable RCA — with buffer states, upstream and downstream context, and shift boundaries all in one review. Book a 30-minute walkthrough of one shift RCA end to end.
The dashboard shows the totals. The event history shows the pattern. That pattern is what turns tiny stops into a testable hypothesis.
At a Glance
Why Small Events Matter More Than They Look
On the surface, a 20-second stop, a 40-second wait, or a brief blocked state may look like noise. In OEE terms those small interruptions can add up fast — especially when they repeat around the same machine, same buffer, or same shift handoff. Starvation means the process is waiting on material, parts, or flow from upstream. Blockage means the process cannot release output because downstream is not ready to receive it. Both are classic line-balance symptoms, and both show up as availability loss when the line is stopped, performance loss when the line runs below expected rate, and mixed loss behavior when short stops trigger repeated recoveries that degrade cycle consistency.
For a plant operations manager, the key question is not how many stops happened. It is what sequence of events caused those stops, and what condition repeats across shifts. Most dashboards summarize totals. Totals hide sequence. A line that shows 18 minutes of lost time across a morning shift may have upstream feeder running dry, downstream accumulation backing up, or a buffer repeatedly hovering near empty or full.
Line Event History — What to Read For
- Are starvation events clustered before a specific machine?
- Are blockage events clustered after a specific machine?
- Does the buffer empty before every starvation event?
- Does the buffer fill before every blockage event?
- Do these events repeat near breaks, end-of-shift, or material replenishment?
- Are the patterns different by product or SKU?
- Does the issue begin after a changeover or after a line restart?
What iFactory Delivers
iFactory turns a morning of tiny stops into a sequence your CI lead can test, using the event history and buffer signals you already store.
Short stops grouped by machine, buffer and time window instead of counted in isolation.
Empty and full transitions shown against each starvation and blockage event.
Breaks, changeovers and restarts marked on the same timeline.
A testable hypothesis in plain language for the supervisor or CI lead to confirm.
What to watch on the next run to confirm or reject the hypothesis.
Repeated starvation or blockage signatures carried into your CI backlog.
Bring one shift with a starvation or blockage cluster. We walk through event history, buffer state review, spoken summary, and verification plan for the next shift.
Signal to Structure to Human Review
A useful workflow starts with the signal — line event history, stop clusters, buffer transitions, upstream and downstream state changes, shift context. Then the assistant structures the data by grouping related short stops, labeling likely starvation or blockage sequences, separating isolated events from recurring patterns, and highlighting changes by shift, product, or operating window. A supervisor or CI lead then reviews the draft narrative — is the timing correct, did the buffer really empty before the stop, was the downstream line actually full, did a changeover or break explain the timing, is this a repeatable condition or a one-off. Once validated, the team decides whether to hold or contain affected product, open CAPA, adjust replenishment or staffing, or review changeover timing.
What a Good Spoken RCA Sounds Like
A practical spoken RCA should sound like an operations summary, not a model output. Specific, testable, and concise. For example: across the morning shift, the line shows repeated short starvation events before the bottleneck machine and brief blockage events after restart. The stops cluster around break return and the first changeover window. Buffer states indicate the line alternated between empty and near-full conditions rather than holding steady. This suggests a pacing and replenishment issue tied to shift context, not a single hard failure. Next step is to validate feeder timing, operator response time, and downstream release logic on the next run.
The strength of a spoken RCA is that it can be reviewed quickly by a supervisor at the line, a shift leader in the office, or a CI engineer preparing for a daily huddle — without needing everyone to open the same set of dashboards. It becomes a shared reference point for the day's discussion rather than a report to be assembled later. When paired with an evidence link back to the underlying event history and buffer traces, the summary is auditable. If the team disagrees with the framing, they can inspect the same signals and adjust. That review conversation is where operational judgment lives, and the workflow is designed to support it rather than to replace it. The verification loop — running the proposed change on the next shift and comparing the resulting event history — is what turns a hypothesis into a closed loop and keeps the CI cadence honest.
Frequently Asked Questions
Starvation means the process is waiting on input from upstream. Blockage means the process cannot release output because downstream cannot receive it.
Event history shows the sequence of states before and after each stop, which helps identify whether the issue repeats around buffers, shift timing, changeovers, or upstream and downstream constraints.
Empty or near-empty buffers often support a starvation hypothesis, while full or near-full buffers often support a blockage hypothesis. The pattern across time is more important than a single snapshot.
Yes. It can cluster events, draft a narrative, and surface a hypothesis for human review. The team still validates the conclusion before action.
If the line is fully stopped, the event often lands in availability loss. If the line keeps running but at a lower rate or with repeated micro-stops, the impact may also show up as performance loss.
A dashboard shows many small starvation and blockage events, but the pattern is where the answer lives. iFactory AI helps turn that pattern into a testable RCA and a closed loop for the next shift.