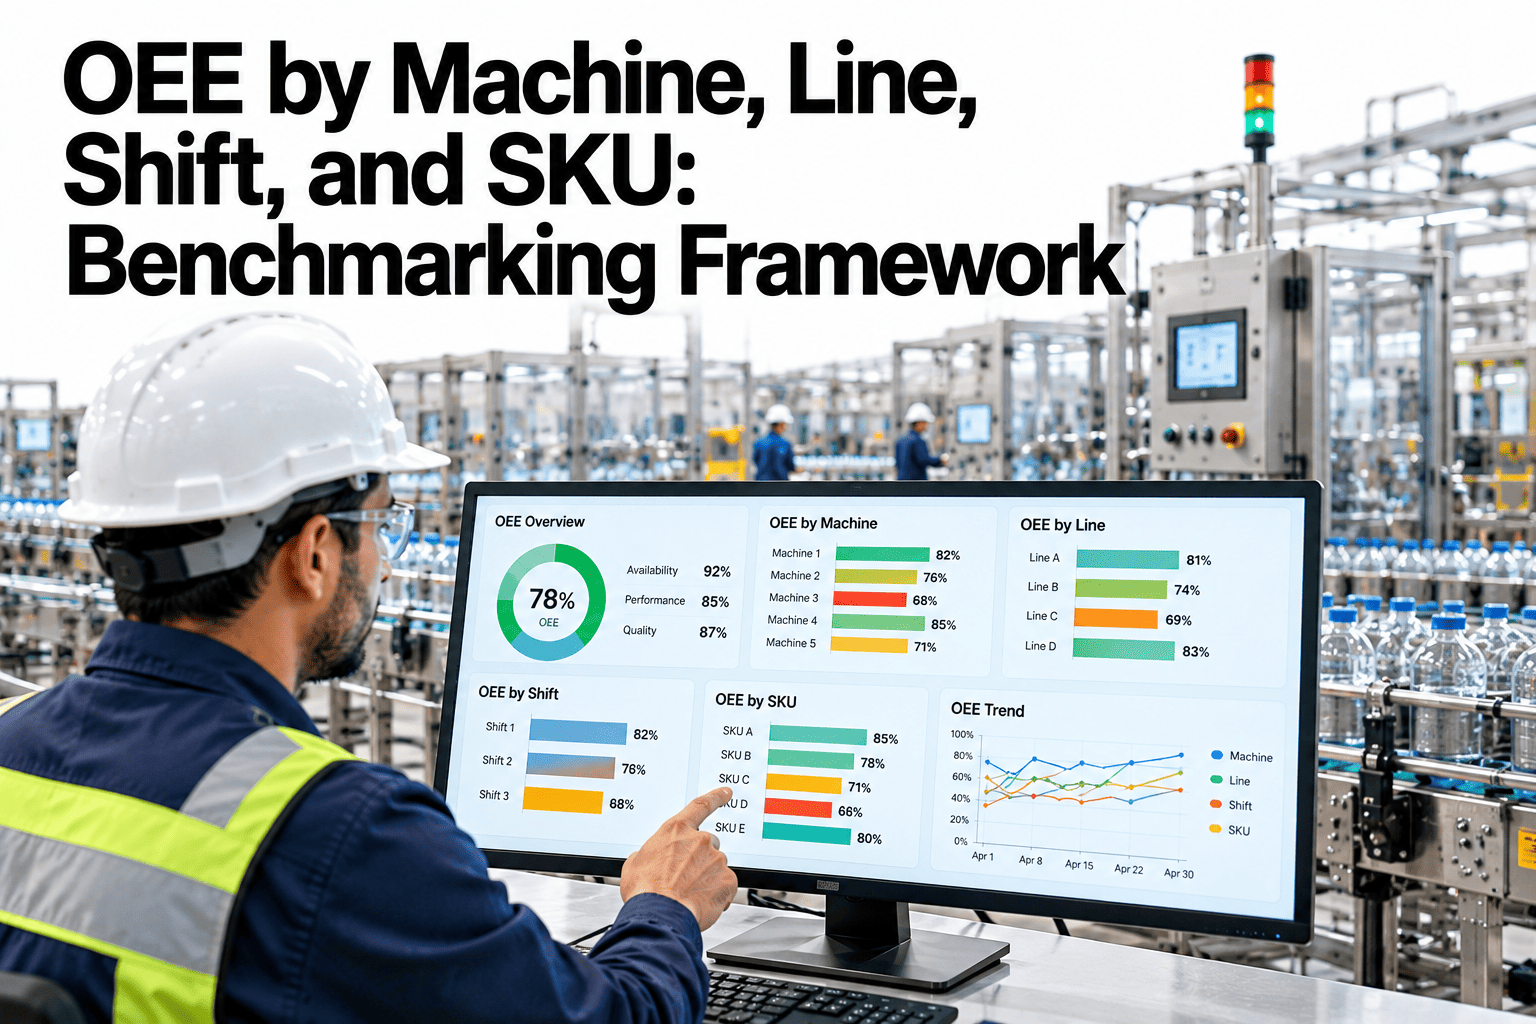
A single OEE number for a plant tells you very little. It tells you nothing about which machine is pulling the average down, whether the night shift is systematically weaker than the day shift, or whether one product family drives most of the quality loss. Disaggregated OEE — broken out by machine, line, shift, and SKU simultaneously — is what turns a lagging indicator into a targeting tool. iFactory AI tracks all four dimensions in real time, so the improvement priority list is always grounded in actual data rather than assumptions about where the losses are. See how multi-dimension OEE benchmarking works on your own production data.
OEE That Tells You Exactly Where to Look
Machine, line, shift, and SKU — four lenses that turn one aggregate number into a ranked list of improvement targets.
Why Aggregate OEE Is Not Enough
A plant OEE of 70% can mean almost anything. It might mean every machine is running at exactly 70%, or it might mean one machine at 55% is dragging down five others running at 80%.
Without disaggregation, improvement efforts default to broad interventions applied plant-wide rather than surgical actions aimed at the specific asset, shift, or product that accounts for the majority of the loss. Most plants find that 20% of machines, shifts, or SKUs account for 60–80% of their total OEE gap. Disaggregated benchmarking is how you find that 20% and stop spreading resources evenly across the wrong 80%.
The Four Benchmarking Dimensions
Each dimension answers a different question and unlocks a different category of improvement action. All four together paint a complete picture of where production efficiency is being lost.
Machine-level OEE identifies the specific equipment that is dragging the line average down. The gap between the highest and lowest OEE machines on a single line is typically large enough that improving the single worst machine recovers more capacity than modest improvements across all machines. Machine benchmarking directs maintenance and process improvement investment to the highest-return target.
Line-level OEE is the management view — it aggregates machine performance into a single score per line, making it straightforward to prioritize improvement projects across a multi-line facility. Line benchmarking also surfaces whether a performance gap is concentrated in one area of the process or spread across all machines on the line, which points to systemic versus asset-specific root causes.
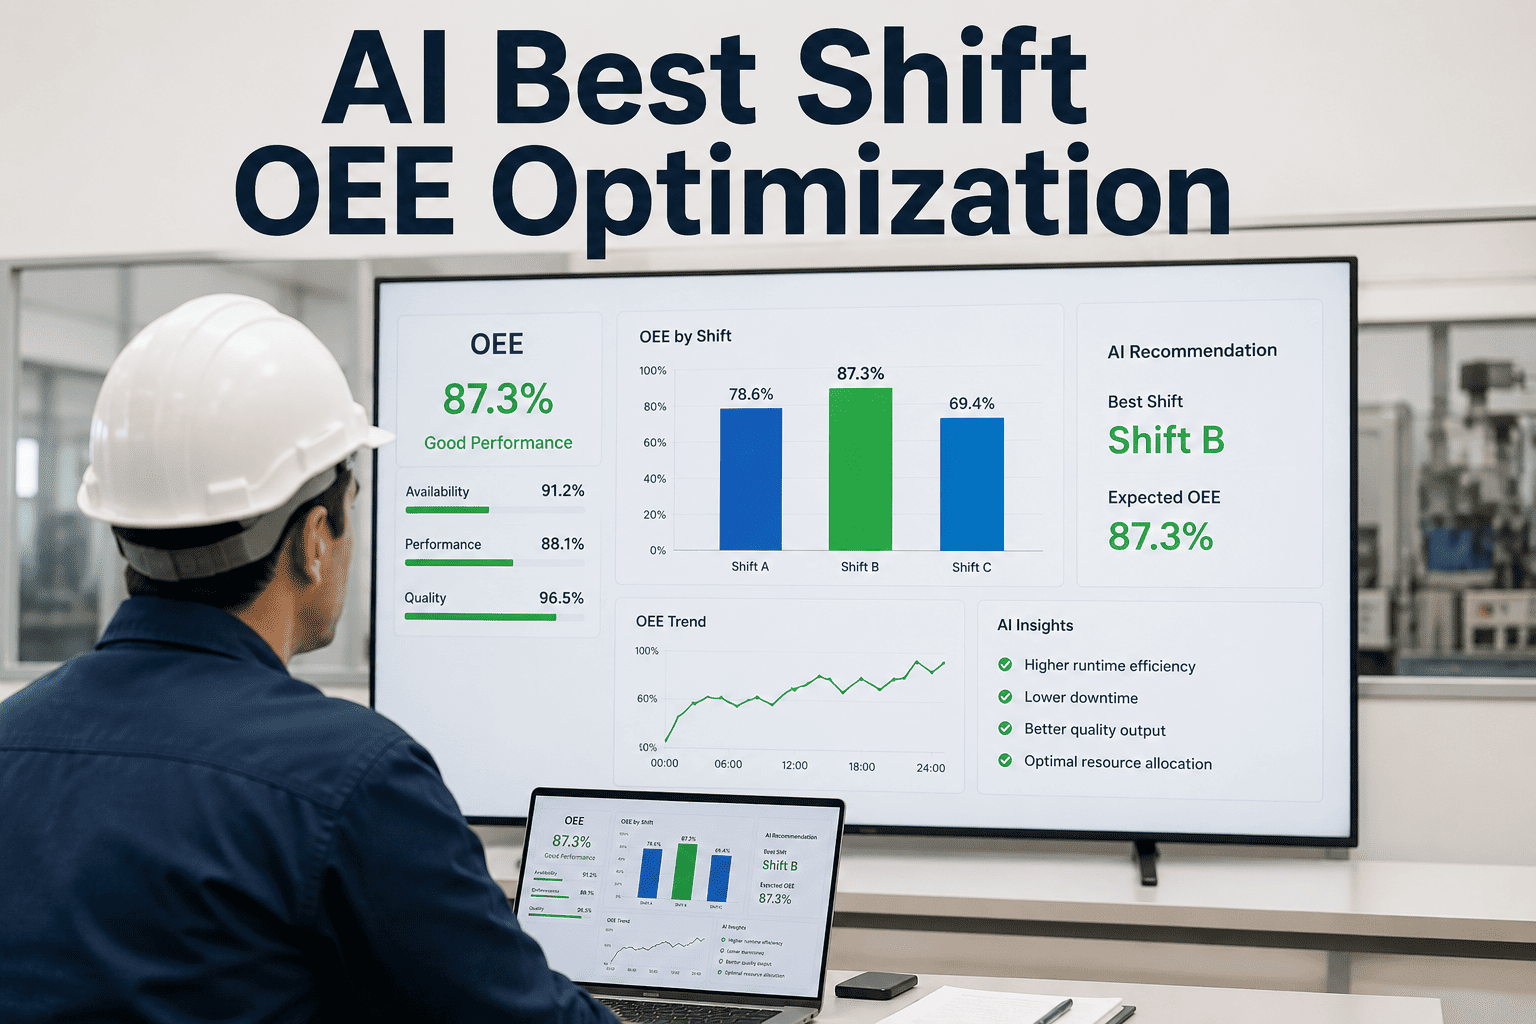
Shift OEE comparison is the most direct indicator of standard work consistency and supervision quality. When the same machine runs at 78% on day shift and 64% on night shift, the root cause is almost never the equipment — it is a difference in operator methods, startup procedures, response to minor faults, or shift handover quality. Shift benchmarking makes this visible and actionable without capital investment.
SKU-level OEE connects production efficiency to product mix, revealing which products drive disproportionate changeover time, higher defect rates, or reduced speeds. This data feeds directly into production scheduling decisions — sequencing high-OEE SKUs before low-OEE SKUs, batching similar products to reduce changeover frequency, or triggering process improvement projects on the specific formulations or materials that cause performance degradation.
Building the Benchmarking Framework
A useful benchmarking framework needs three things: accurate measurement at each dimension, a reference point to benchmark against, and a ranking method that keeps the improvement list short.
| Benchmark Dimension | Internal Reference | External Reference | Ranking Method |
|---|---|---|---|
| Machine | Best machine on same line | OEM-rated throughput | Sort by OEE ascending — lowest first |
| Line | Best-performing line at facility | World-class 85% OEE | Gap from target in absolute OEE points |
| Shift | Best shift on same line, same machine | Not applicable — shift is internal | Variance from top shift score |
| SKU | Best-performing SKU on same line | Product family benchmark where available | OEE weighted by production volume |
Using iFactory AI for Cross-Dimension OEE Analysis
iFactory AI tracks all four OEE dimensions simultaneously from real equipment signals, without requiring separate data collection for each view.
Automatic Dimension Splitting
A single data stream from a machine is automatically attributed to its line, shift, and associated SKU, so machine, line, shift, and SKU OEE are always consistent with each other rather than calculated from separate sources that can diverge.
Ranked Worst-Performer Lists
For each dimension, iFactory AI maintains a ranked list of underperformers sorted by OEE gap from the internal best. The improvement priority list is generated automatically and updated in real time — no manual analysis required to identify the focus area for this week's improvement meeting.
Loss Attribution by Dimension
When a machine's OEE is low, iFactory AI breaks the gap into availability, performance, and quality components and shows which loss type is dominant at that specific dimension — different from the plant-level breakdown, because machine-level losses often have a different character than line or shift-level patterns.
Shift Trend Overlay
Shift comparison overlays the OEE trend for all shifts on the same chart, making gradual drift — where one shift is getting slowly worse rather than suddenly dropping — visible weeks before it becomes an obvious gap. Drift detection is often more valuable than threshold alerts for shift-driven losses.
SKU Scheduling Integration
SKU-level OEE data flows into production scheduling context, flagging when an upcoming production sequence includes a high proportion of low-OEE SKUs and enabling planners to resequence or pre-position resources before the OEE drop occurs rather than reacting to it.
Multi-Plant Normalization
For manufacturing organizations with multiple facilities, iFactory AI normalizes OEE data across plants by product type and equipment class, so a fair cross-site comparison is possible even when product mix and machine age vary between locations.
The Benchmarking-to-Action Loop
Benchmarking without action is just reporting. The framework has value only when it reliably feeds into improvement decisions. iFactory AI closes this loop systematically.
Frequently Asked Questions
How do we benchmark OEE fairly when different machines produce different SKUs?
By normalizing for product mix first — iFactory AI splits each machine's OEE by SKU before aggregating, so comparisons reflect equipment performance given its actual mix, not product-driven losses mislabeled as machine issues. Walk through the normalization approach for your specific product mix.
What should we do first when shift OEE varies widely between shifts?
Check which component — availability, performance, or quality — drives the gap on the weaker shift, since each points to a different cause, then document and transfer the best shift's practices as updated standard work. Get guidance on shift comparison methodology for your operation.
Can SKU-level OEE be used to make scheduling decisions?
Yes — knowing which SKU combinations trigger OEE drops lets schedulers sequence to cut total low-OEE production time without changing any process. See how SKU-level data feeds scheduling in a live demo.
How does iFactory AI collect data for all four dimensions simultaneously?
Each signal is tagged with machine, line, shift, and active SKU at collection time, so all four dimensions come from one event stream and stay consistent with no manual entry. See the data architecture during a live demonstration.
What is a reasonable performance gap to target between the worst and best machines?
Closing half the gap within a year is a realistic target for a focused program — for example, moving a 60% machine toward 72% when the best on the line runs at 82%. Talk through a realistic target for your own machine spread.
Know Which Machine, Shift, and SKU to Fix First
iFactory AI tracks OEE across all four dimensions in real time and ranks underperformers automatically. Book a walkthrough to see multi-dimension benchmarking on your own production data.