Pharmaceutical manufacturing operates under a paradox that no other industry shares at the same scale. Profit margins routinely exceed 20% to 30%, regulatory frameworks demand some of the tightest process control on the planet, and yet the average OEE on a pharma filling or packaging line sits between 40% and 65% — roughly half the 85% world-class benchmark that automotive and electronics plants achieve as a matter of routine. The gap is not negligence. It is structural: validated cleaning cycles, line clearance procedures, batch record documentation, serialization micro-stops, and changeover times that can stretch to 90 minutes between products all consume availability and performance that standard OEE improvement methods were never designed to recover. iFactory closes this gap by capturing the golden run — the best-ever shift on each line — converting it into a live baseline that every subsequent shift is measured against, with every loss categorized, costed, and traceable to a specific root cause so that the improvement path is visible before the next batch even starts. See how your filling suite compares to its own best performance with a Book a Demo.
Every Shift Should Run Like Your Best Shift. Now It Can.
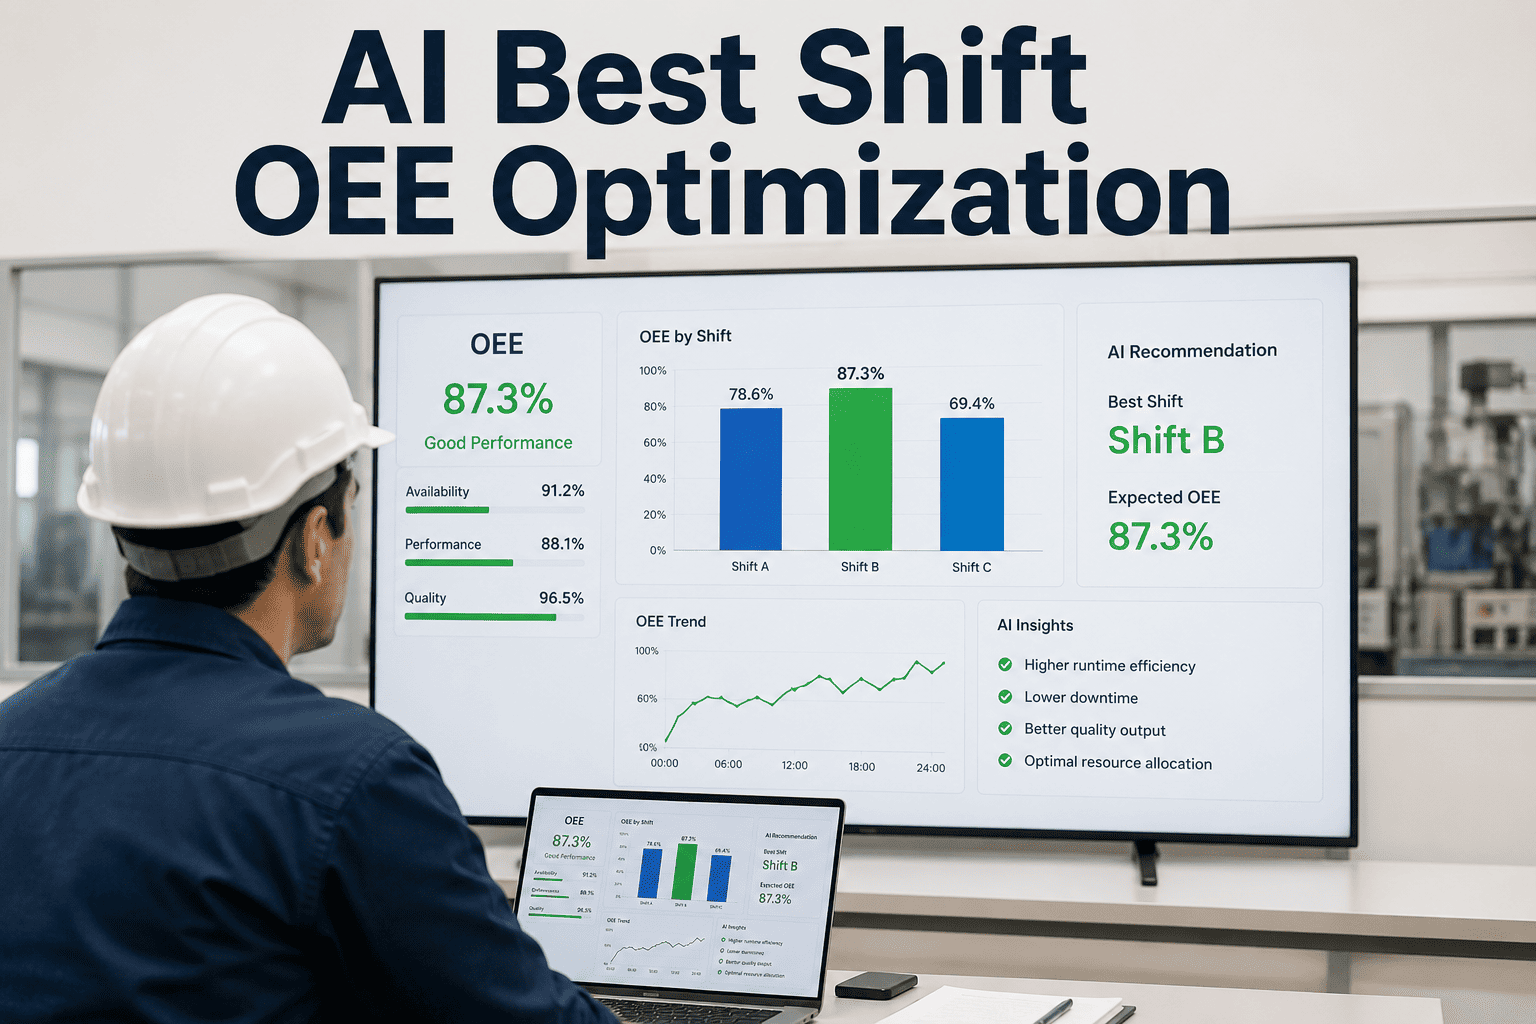
iFactory captures the exact conditions — speed, changeover duration, micro-stop frequency, reject rate, operator sequence — of your highest-performing shift, then holds every future shift accountable to that proven standard with real-time deviation alerts and loss costing.
Why Pharmaceutical Lines Run 20 to 40 Points Below World-Class — and Where the Recoverable Losses Hide
The 85% OEE benchmark was built for high-volume, single-product, continuous-run lines. Pharmaceutical manufacturing is none of those things. Validated cleaning between every batch, serialization camera micro-stops, regulatory documentation overhead, and frequent product changeovers create structural losses that cannot be eliminated without changing the regulatory framework itself. But inside those structural constraints, there is a 15-to-22-point gap between the median pharma line and the top quartile — a gap driven entirely by operational practices, not regulation. That is the gap iFactory targets.
The Six Hidden Losses Eating Your Pharma Shift — Measured, Categorized, and Costed
Direct-sensor OEE measurement across 120+ pharmaceutical packaging lines globally reveals that the average pharma line loses 22 percentage points to availability, 12 points to performance, and 4 points to quality. But the real insight is not in the aggregate — it is in the specific loss categories within each bucket, because the improvement strategy for each one is fundamentally different. iFactory tracks all six loss categories in real time, assigns a dollar cost per minute to each, and shows operators and supervisors exactly which loss is stealing the most value on the current shift.
Planned Changeover and CIP
Line clearance, cleaning-in-place, format changes, and validated cleaning between product batches account for roughly 11 OEE points. These are structurally required but their duration is highly variable — the difference between a 45-minute and a 90-minute changeover on the same line is pure operational loss, and iFactory measures it to the second.
Unplanned Stoppages
Equipment breakdowns, material supply interruptions, and unplanned maintenance consume another 11 points. In pharma, unplanned stops carry extra cost because they trigger deviation investigations and batch disposition decisions whose documentation burden far exceeds the downtime itself.
Micro-Stops and Speed Losses
Serialization camera false rejects, blister feed jams, carton misfeeds, and labeler hesitations — stoppages under two minutes that most manual logging systems miss entirely. Direct-sensor measurement consistently shows 7 to 9 OEE points lost to micro-stops that never appear in operator shift reports because each individual event seems too small to record.
Reduced Speed Operation
Lines running below rated speed due to cautious operator settings, aging mechanical components, or previous quality events that prompted a deliberate slowdown that was never reversed. The gap between rated speed and actual run speed costs 3 to 5 OEE points on most pharma packaging lines.
Rejects and Rework
Out-of-spec units, mislabeled packs, incomplete seals, and serialization failures that require reconciliation. Pharma quality losses are numerically small but financially disproportionate because every rejected unit triggers a documentation chain that consumes operator and QA time far beyond the material cost of the unit itself.
Startup and Restart Waste
The first 10 to 20 minutes after every changeover or unplanned stop produce units at sub-standard quality rates while the line stabilizes. In high-changeover pharma environments running 4 to 8 batch changes per shift, startup waste compounds into a measurable quality drag that most plants attribute to the changeover itself rather than tracking separately.
Which Loss Category Is Costing Your Line the Most Right Now?
iFactory breaks down your OEE losses by category, shift, operator, and product — then costs each one in dollars per hour so the improvement priority is obvious.
What a Best Run Shift Actually Looks Like — and Why Most Plants Cannot Replicate It
The golden run is not an abstract target pulled from an industry benchmark. It is your own line's best-ever shift — the one where changeover was tight, micro-stops were minimal, reject rate was lowest, and throughput hit a peak that the team remembers but has never consistently repeated. iFactory captures every parameter of that shift and converts it into a live baseline that subsequent shifts are compared against in real time, so operators can see exactly when and where performance is deviating from the proven best, not from a theoretical ideal.
Changeover Duration
Exact elapsed time for line clearance, CIP, format change, and restart — captured at each stage, not just the aggregate. The golden run stores the fastest validated changeover for each product-to-product transition, so every future changeover is measured against the specific transition that achieved it, not against an arbitrary target.
Run Speed Profile
Actual pieces per minute throughout the run, including the ramp-up curve after startup and any mid-run speed adjustments. The golden baseline captures the speed profile that achieved highest throughput without triggering quality events, which is often 5% to 12% above the conservative speed most operators default to.
Micro-Stop Frequency
Count, duration, and machine-station origin of every sub-two-minute stop during the golden shift. The baseline establishes the minimum achievable micro-stop rate for each product configuration, giving supervisors a specific number to target rather than a general instruction to reduce jams.
Reject and Reconciliation Rate
First-pass yield and reconciliation accuracy during the best shift. This parameter is particularly valuable in serialized pharmaceutical packaging where false rejects from vision systems create both waste and documentation burden that the golden baseline quantifies precisely.
Operator Sequence and Timing
The sequence of operator interventions — material loading, inspection checks, machine adjustments — and their timing relative to line events. The golden run reveals which operator behaviors correlate with peak performance, turning tribal knowledge into a documented, trainable standard.
Environmental Conditions
Temperature, humidity, and cleanroom differential pressure readings during the golden shift. In sterile filling environments where environmental excursions can invalidate an entire batch, the baseline establishes the environmental window associated with the best quality and throughput outcomes.
Best Run Shift vs. Average Shift — Where the 15 OEE Points Disappear
The difference between a pharma line's golden shift and its average shift is rarely one large failure event. It is dozens of small losses compounding across the shift — an extra 12 minutes on changeover because materials were not staged before the line stopped, 38 more micro-stops because the serialization camera threshold was not recalibrated after the last product change, a run speed 14% below rated because an operator conservative setting from a quality event two months ago was never reversed, and two additional reject investigations that each consumed 15 minutes of QA attention that pulled resources from the next batch startup. Individually, each of these losses looks insignificant in a shift-end report. Collectively, they account for the 15-to-22-point gap between top-quartile and median pharmaceutical packaging performance. iFactory makes this gap visible in real time, loss by loss, shift by shift, so operators and supervisors can see exactly which categories are stealing the most value and attack them in priority order while the shift is still running.
| Performance Metric | Average Shift | Golden Run Shift | Gap Value |
|---|---|---|---|
| Overall OEE | 52% | 72% | 20 points |
| Changeover Duration | 78 minutes | 48 minutes | 30 min saved |
| Micro-Stops per Shift | 94 events | 31 events | 63 fewer |
| Run Speed vs. Rated | 82% of rated | 96% of rated | 14% closer |
| First-Pass Yield | 97.1% | 99.4% | 2.3% higher |
| Startup Waste (units) | 320 units | 85 units | 235 fewer |
| Shift Output (units) | 14,200 | 19,800 | 5,600 more |
| Cost of Losses per Shift | $18,400 | $4,200 | $14,200 saved |
From Sensor Data to Golden Run Baseline in Four Steps
iFactory deploys on your filling or packaging line with turnkey NVIDIA edge hardware — pre-configured for pharmaceutical environments and shipped ready to mount without modifications to your qualified line configuration — and begins capturing comprehensive OEE data within the first week of installation. The golden run baseline emerges naturally from the data as shifts accumulate across different products, operators, and operating conditions. The system continuously updates it as the line improves, ensuring the target is always the best proven version of your own performance rather than a static benchmark pulled from an industry report or a theoretical ideal that your specific line has never actually achieved.
Capture Every Loss
Edge sensors and AI-connected cameras log every stop, speed change, reject, and operator intervention on the line — including the micro-stops and speed losses that manual logging consistently misses. Data resolution is per-second, not per-shift, which is the minimum granularity needed to identify root causes rather than symptoms.
Identify the Golden Run
After two to four weeks of continuous data collection, the system automatically identifies the highest-OEE shift for each product-line combination and extracts its complete parameter profile — changeover steps, speed curve, micro-stop count, quality metrics, and environmental readings. This becomes the golden run baseline.
Compare Every Shift in Real Time
Each active shift is compared against its golden baseline continuously. When changeover exceeds the golden duration, when micro-stop frequency climbs above the baseline rate, or when speed drops below the golden profile, operators and supervisors receive immediate, specific alerts — not at shift-end review, but while the shift is still running and corrective action is still possible.
Cost Every Gap and Prioritize
Every deviation from the golden baseline is automatically assigned a dollar cost based on the line's configured production value per minute. The shift summary shows the total cost of losses, ranked by category, so improvement efforts focus on the highest-value gaps first. When a new shift surpasses the previous golden run, the baseline updates automatically.
Filling Suite vs. Packaging Suite — Different Lines, Different Golden Runs, Same Platform
A pharmaceutical facility's filling suite and packaging suite face fundamentally different OEE challenges. Filling lines in sterile environments contend with environmental excursions, stopper and vial feed reliability, and fill-weight variance under strict USP tolerances. Packaging suites battle changeover complexity across blister, cartoning, labeling, and serialization stations where each machine in the sequence can independently create a micro-stop that cascades downstream. iFactory configures separate golden run baselines for each suite, each line, and each product configuration — because a golden run on a vial filler operating in an ISO 5 cleanroom with validated CIP/SIP cycles looks nothing like a golden run on a blister packager running 28-count format changes with serialization aggregation. The platform recognizes that applying a single OEE target across both environments would produce misleading data and misallocated improvement resources.
Sterile Filling Suite
Secondary Packaging Suite
We knew our blister line could do better because we had seen it do better — one shift three months ago hit 71% OEE and nobody could explain exactly why it happened or how to repeat it. iFactory captured the golden run parameters, and within six weeks of holding every shift accountable to that baseline, our average OEE moved from 54% to 66%. The changeover reduction alone — from 82 minutes to 51 minutes on the same product transition — recovered enough capacity that we delayed a second-line capital project by two years.
Frequently Asked Questions
Q: How does iFactory handle GMP-validated environments — does it require changes to the qualified line configuration?
iFactory deploys non-invasively alongside your existing qualified configuration. Edge sensors read line signals at the machine level without modifying PLC logic, adding hardware to the validated process path, or altering any qualified equipment parameters. This means the system collects the data needed for OEE measurement and golden run baselining without triggering a requalification or validation change control event. The installation approach is designed specifically for FDA-regulated and EU GMP environments where configuration integrity is a regulatory requirement — contact Support Contact to discuss your specific validation framework.
Q: Can the golden run baseline account for different products on the same line, or does it assume a single-product configuration?
The system maintains separate golden run baselines for every product-line combination. A blister line running Product A in a 14-count configuration has a different golden baseline than the same line running Product B in a 28-count configuration, because optimal changeover sequence, run speed, micro-stop profile, and reject rate vary by product format. When a shift starts a new batch, iFactory automatically loads the golden baseline for that specific product-line pair, so the comparison is always against the best achievable performance for the exact configuration currently running — schedule a Book a Demo to see multi-product baseline management in action.
Q: How does the system handle the micro-stops that manual OEE tracking consistently misses?
iFactory captures every stop event regardless of duration through direct edge-sensor integration at the machine cycle level. Stops as short as two seconds are logged with timestamp, duration, and originating station, which is critical because direct-sensor measurement across pharma packaging lines shows that 7 to 9 OEE points are lost to micro-stops that never appear in manual operator reports. The system also auto-classifies micro-stops by root cause pattern — serialization camera triggers, feed jams, seal station hesitations — so the improvement team can see not just how many micro-stops occurred but which machine station and which failure mode is generating the most cumulative loss across shifts.
Q: What does loss costing look like in practice — how accurate are the dollar values?
Loss costing is configured during deployment by assigning a production value per minute to each line based on the facility's actual product value, throughput rate, and operating cost structure. This includes direct production value lost, labor cost during idle time, material waste cost for rejected units, and the documentation burden cost specific to pharma environments where every unplanned stop triggers deviation paperwork. The resulting dollar-per-minute rate converts every OEE loss event into financial impact, and the shift summary report shows total losses ranked by cost category so that Book a Demo discussions focus on the highest-value improvement opportunities first.
Q: How quickly does the system establish a reliable golden run baseline for a new line?
A statistically meaningful golden run baseline typically emerges within two to four weeks of continuous data collection, depending on the number of product changeovers the line performs and the variety of product formats running during that period. The system needs enough shift data to have seen each product-line combination run multiple times under varying conditions before it can confidently identify which shift represents the best achievable performance for each configuration. Once established, the golden baseline is a living target — if a future shift outperforms the current baseline, the system automatically promotes it. Questions about expected baseline timelines for your specific line configuration can be discussed through Support Contact.
Your Best Shift Already Happened. Now Make Every Shift Match It.
Bring your filling or packaging line data, and watch iFactory identify your golden run, cost every gap, and show the improvement path — live.