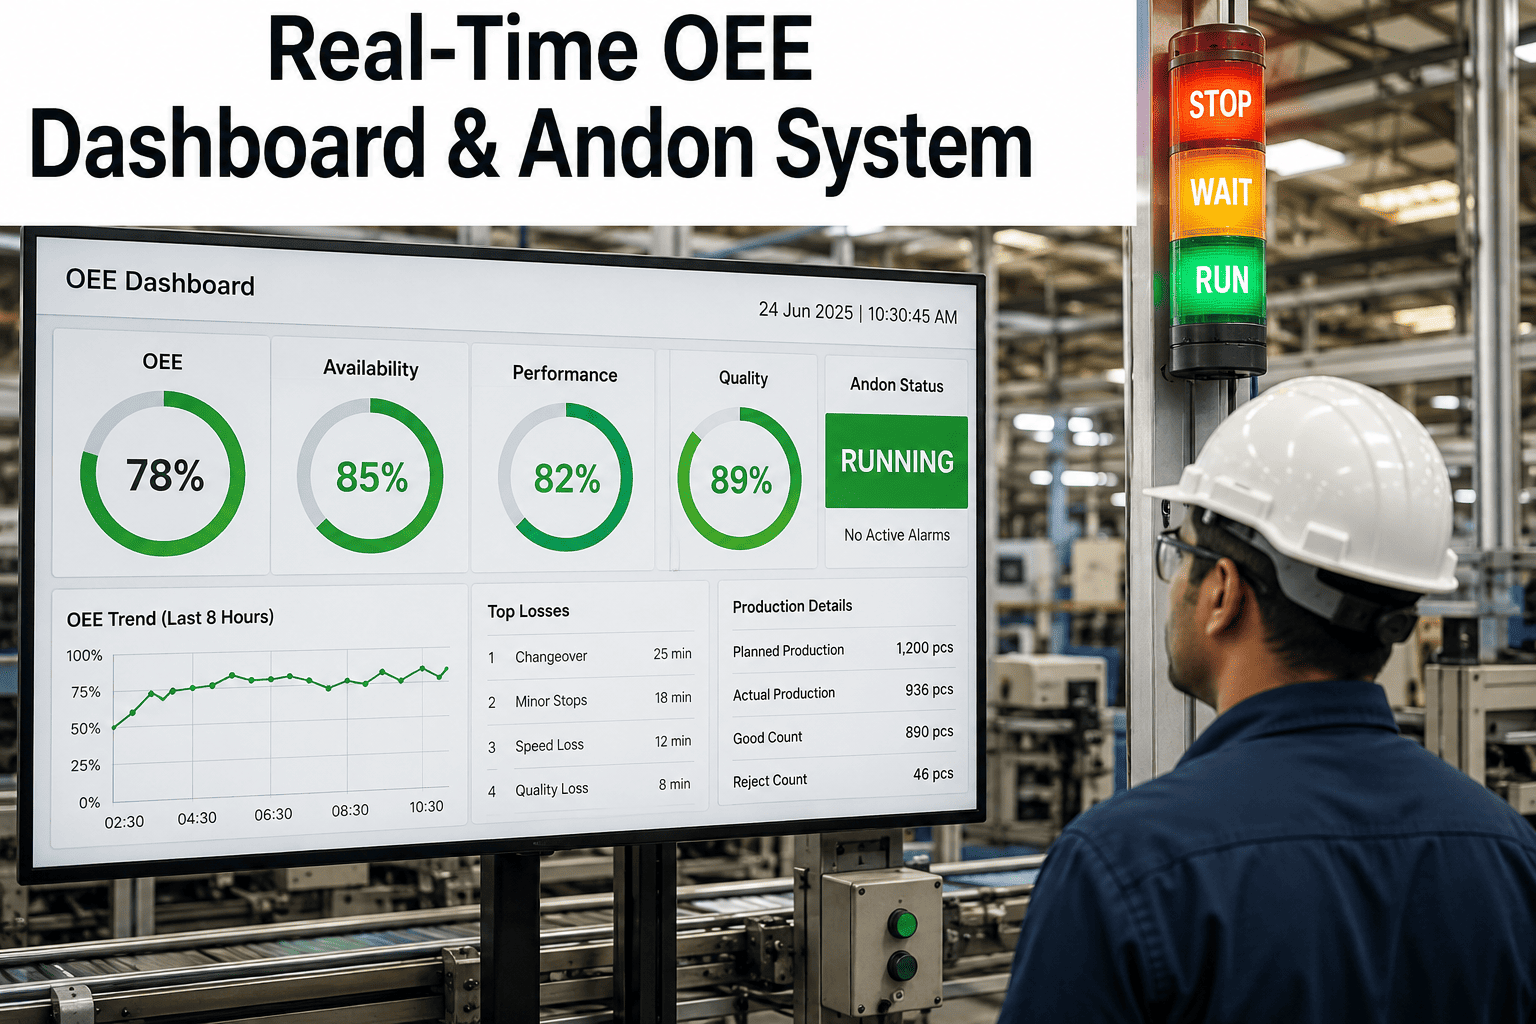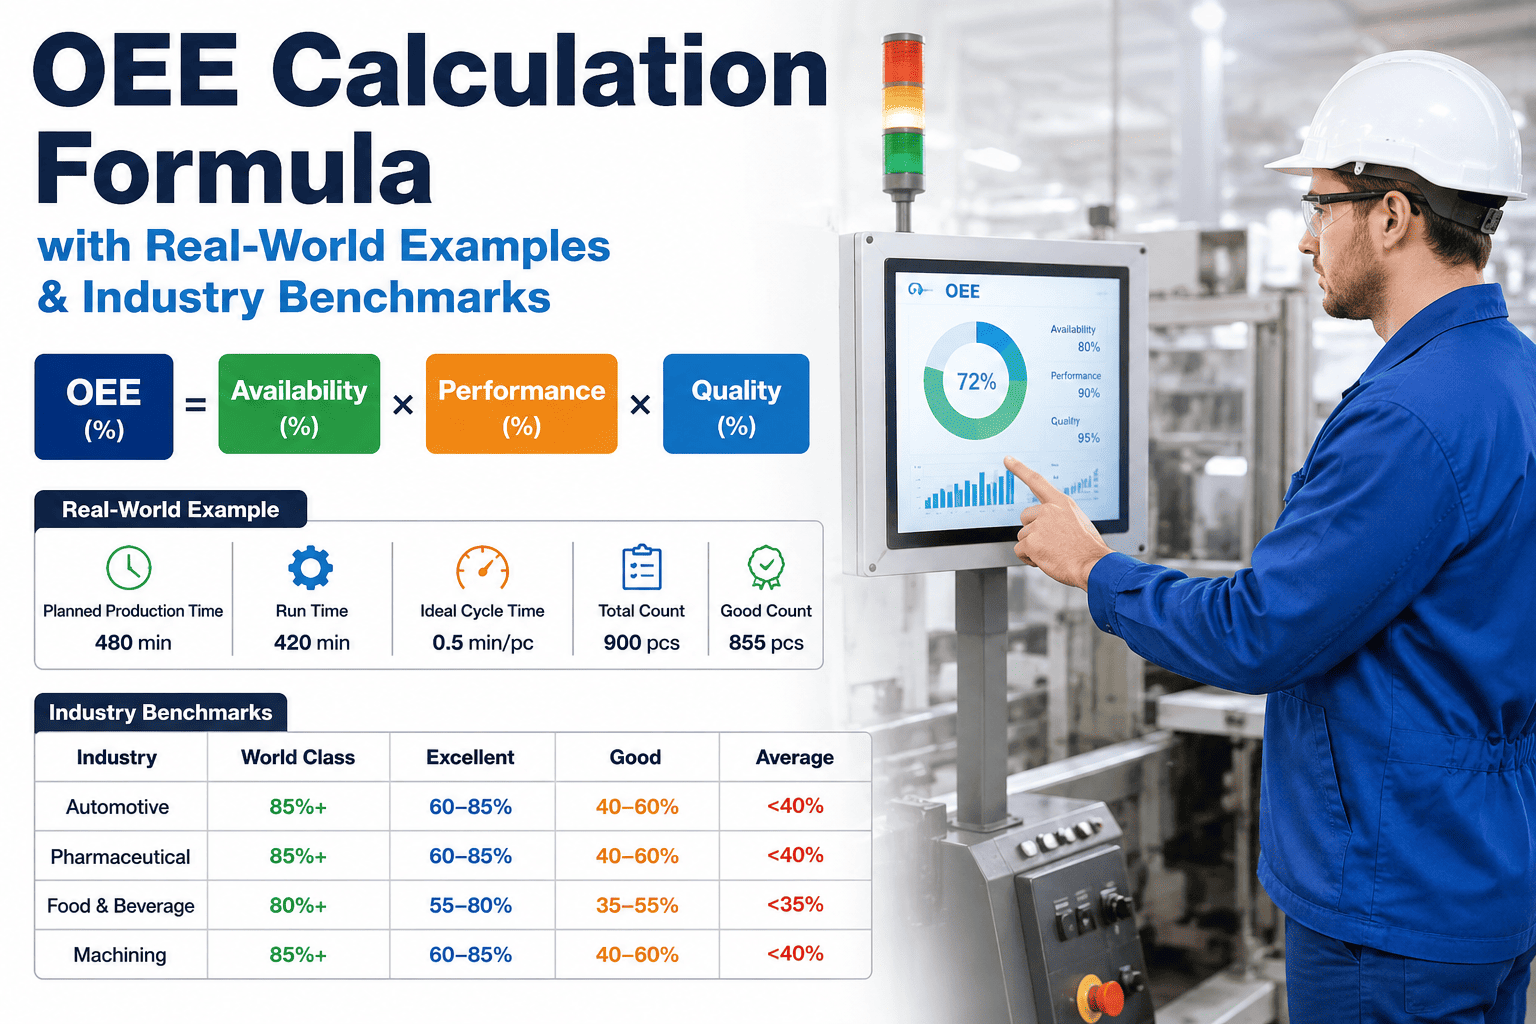
Overall Equipment Effectiveness sounds like a single number, but it is really three separate stories about your production line stitched together, and most plants only ever look at the combined score without understanding which of the three stories is actually dragging it down. That single blended percentage can hide a serious quality problem behind a decent-looking overall score. Book a demo to see OEE broken into its three components automatically, in real time.
OEE Is Availability Times Performance Times Quality, and Each One Tells a Different Story
A 65 percent OEE score means nothing on its own until you know whether it came from downtime, slow cycles, or scrapped parts. iFactory calculates all three components automatically from machine and quality data, so the number comes with an explanation attached.
Breaking Down the Three Components of OEE
Multiplying all three together produces the final OEE percentage, but the real diagnostic value is in looking at each number individually, since a line with strong availability and quality but weak performance has a completely different problem than a line with the opposite pattern.
A Full OEE Calculation on a Single Shift
Consider an eight-hour shift with a 30-minute scheduled break, leaving 450 minutes of planned production time. The line experienced 45 minutes of unplanned downtime from a jam and a changeover, leaving 405 minutes of actual run time. Availability is 405 divided by 450, or 90 percent.
The line's ideal cycle time is one part every 2 seconds, meaning maximum theoretical output over 405 minutes is 12,150 parts. Actual output for the shift was 10,000 parts, giving a performance rate of 10,000 divided by 12,150, or roughly 82 percent, reflecting minor speed losses and small stops throughout the shift.
Of the 10,000 parts produced, 9,600 passed quality inspection and 400 were scrapped or reworked, giving a quality rate of 96 percent. Multiplying availability, performance, and quality together, 90 percent times 82 percent times 96 percent, produces a final OEE of approximately 71 percent for the shift.
Stop Calculating OEE by Hand at the End of Every Shift
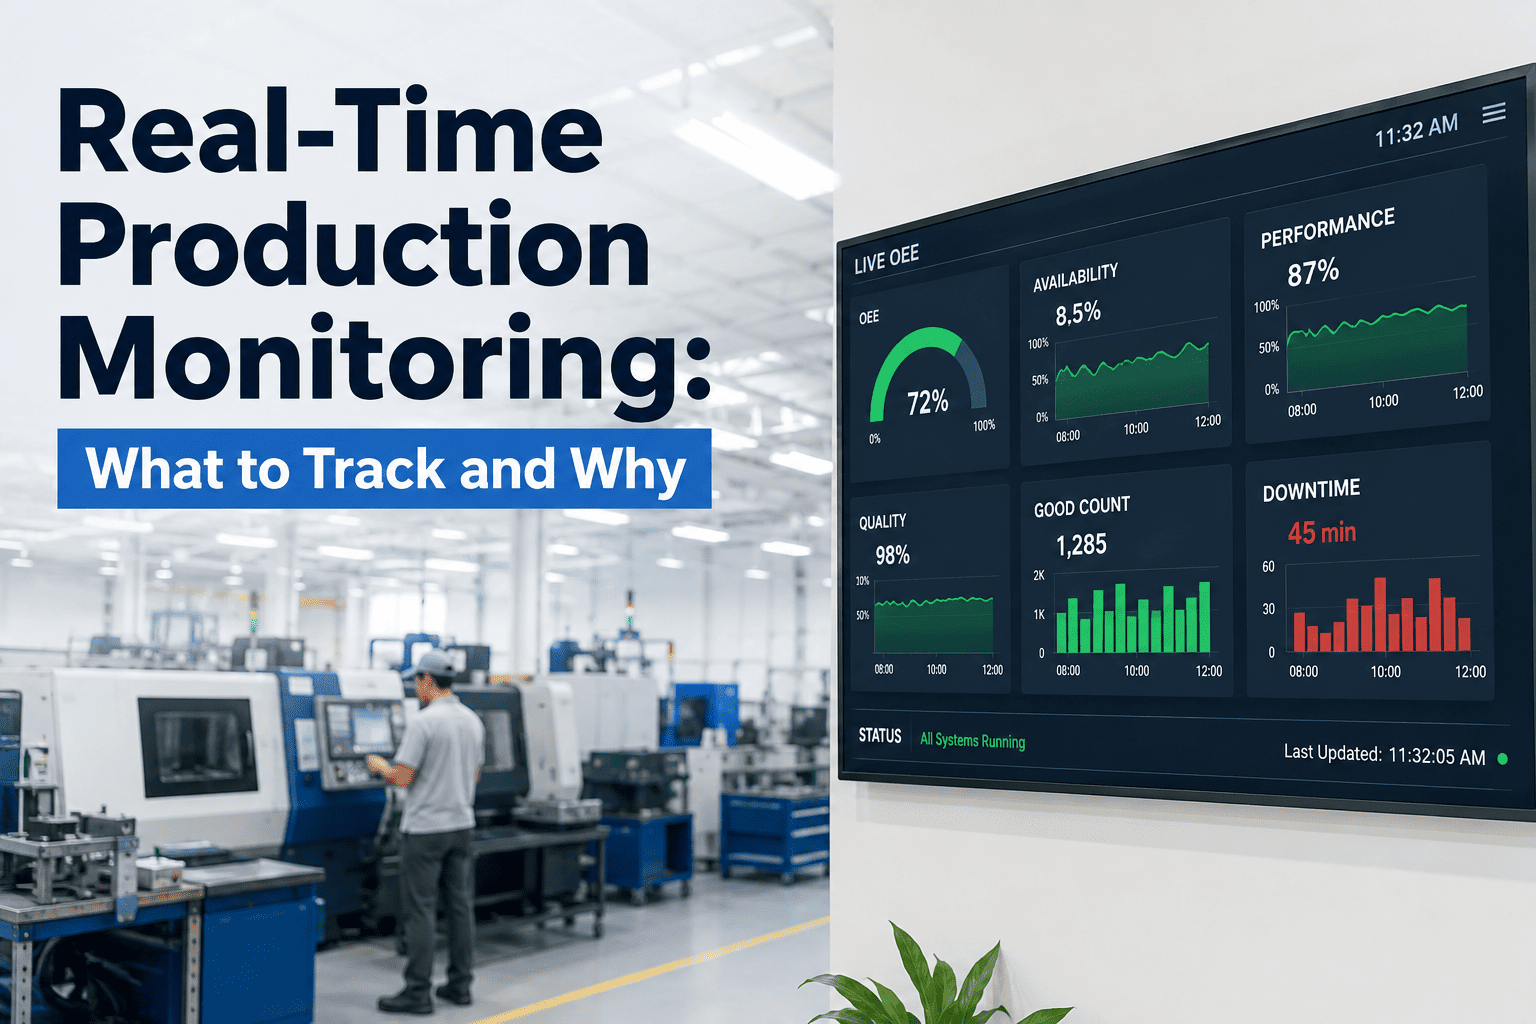
iFactory pulls machine state, cycle counts, and quality data automatically and calculates availability, performance, and quality in real time, no manual spreadsheet required.
Industry OEE Benchmarks by Performance Tier
| Performance Tier | Typical OEE Range | What It Usually Reflects |
|---|---|---|
| World Class | 85% and above | Disciplined changeover, strong preventive maintenance, tight quality control |
| Above Average | 70% - 85% | Solid fundamentals with room to reduce small stops and speed losses |
| Typical Industry Average | 50% - 70% | Where most discrete manufacturing plants land without a formal OEE program |
| Needs Focused Improvement | Below 50% | Usually points to a significant, addressable availability or quality issue |
The widely cited 85 percent world-class benchmark originated in discrete manufacturing and does not translate identically across every industry, so the most useful benchmark for any specific line is usually its own historical trend rather than a single external number.
The Six Loss Categories Behind Every OEE Gap
The Problem With Calculating OEE From End-of-Shift Logs
Manually calculated OEE almost always understates real losses because small stops under a few minutes rarely get written down consistently, and the exact duration of a changeover is frequently estimated rather than timestamped. This creates a performance number that looks better on paper than the line actually runs, which then undermines the credibility of the whole OEE program once the gap between reported and observed performance becomes obvious.
Automated OEE calculation, pulling machine state directly from PLC signals or sensors rather than operator logs, captures every stop regardless of duration and timestamps changeovers precisely, producing a number that reflects what the line actually did rather than what someone remembered to write down at the end of a busy shift.
Common Questions About OEE Calculation
What is a realistic OEE target for a plant just starting to measure it formally?
Most plants beginning formal OEE measurement discover their actual score sits in the 40 to 60 percent range even when informal estimates were higher, since manual tracking tends to miss small stops and underestimate changeover time. A realistic first-year target is typically improving 10 to 15 percentage points through addressing the most obvious losses, rather than jumping straight to the commonly cited 85 percent world-class benchmark, which usually takes sustained improvement work over multiple years to reach. Book a demo to get a baseline OEE reading for your specific line.
Why does automated OEE calculation usually show a lower score than manual tracking?
Automated calculation captures every stoppage directly from machine signals, including small stops under a few minutes that operators frequently do not log individually during a busy shift, along with precise changeover durations rather than estimated ones. This more complete data collection typically reveals losses that manual logging missed, which is why plants switching from manual to automated OEE tracking often see their calculated score drop even though the actual line performance has not changed. Contact support to understand the gap between your manual and automated numbers.
Should planned downtime like scheduled maintenance be included in the OEE calculation?
Standard OEE calculation excludes scheduled non-production time, such as planned maintenance windows or shifts the line was never scheduled to run, from the planned production time denominator, since availability is meant to measure how effectively the line used the time it was actually scheduled to produce. Changeovers are generally included as an availability loss even though they are planned, because they still represent time the line was scheduled to run but was not producing parts. Book a demo to see how planned time categories are configured for your specific schedule.
How does OEE differ across discrete manufacturing versus process industries like food or chemicals?
The core formula of availability times performance times quality applies across both discrete and process manufacturing, but ideal cycle time is harder to define precisely in continuous process industries where output is measured in volume or weight rather than discrete units, which sometimes leads process plants to adapt the performance component using a rate-based benchmark instead. Quality calculations in process industries also frequently need to account for partial batches or off-spec material differently than discrete part rejection. Contact support to discuss OEE calculation specifics for your industry.
Can OEE be tracked automatically without installing new sensors on older machines?
Many older machines already generate usable signals through existing PLCs, control panels, or motor controllers that can be tapped for run state and cycle counting without requiring invasive sensor installation, though machines with no accessible electronic signal sometimes need a simple retrofit sensor such as a current clamp or proximity switch to detect run versus stopped state. The right approach depends on what signals are already available on your specific equipment. Book a demo to assess automated OEE feasibility on your existing machine fleet.
Know Which of the Three OEE Components Is Actually Costing You
iFactory calculates availability, performance, and quality automatically from real machine and quality data, turning a single blended OEE score into a clear diagnostic you can act on.