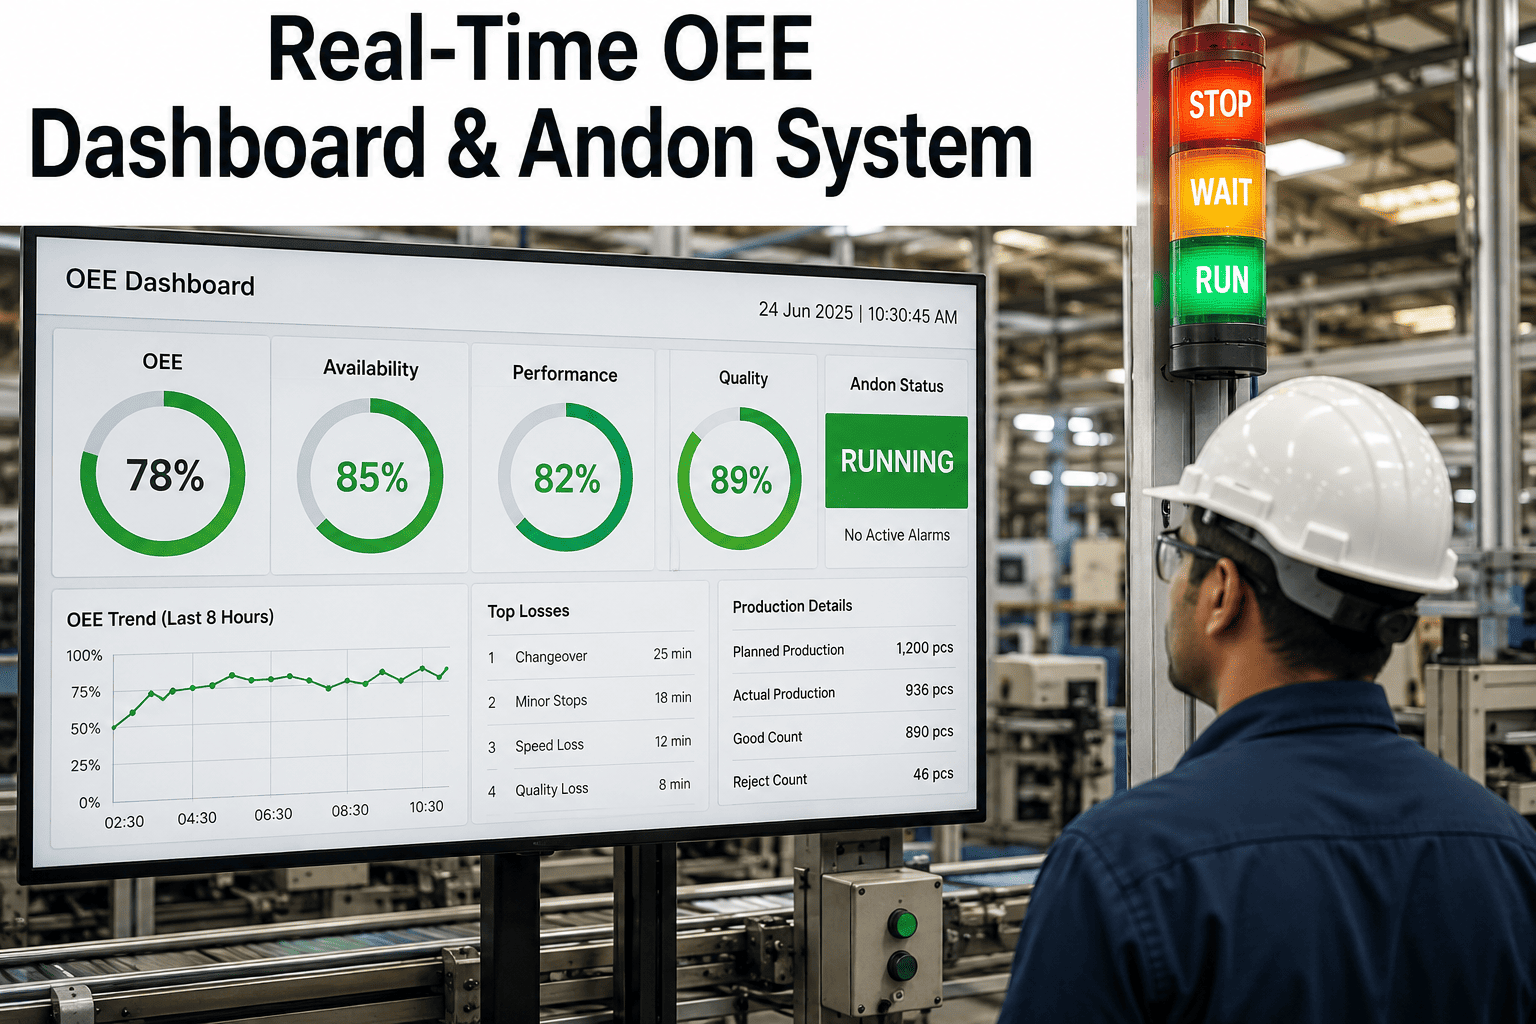
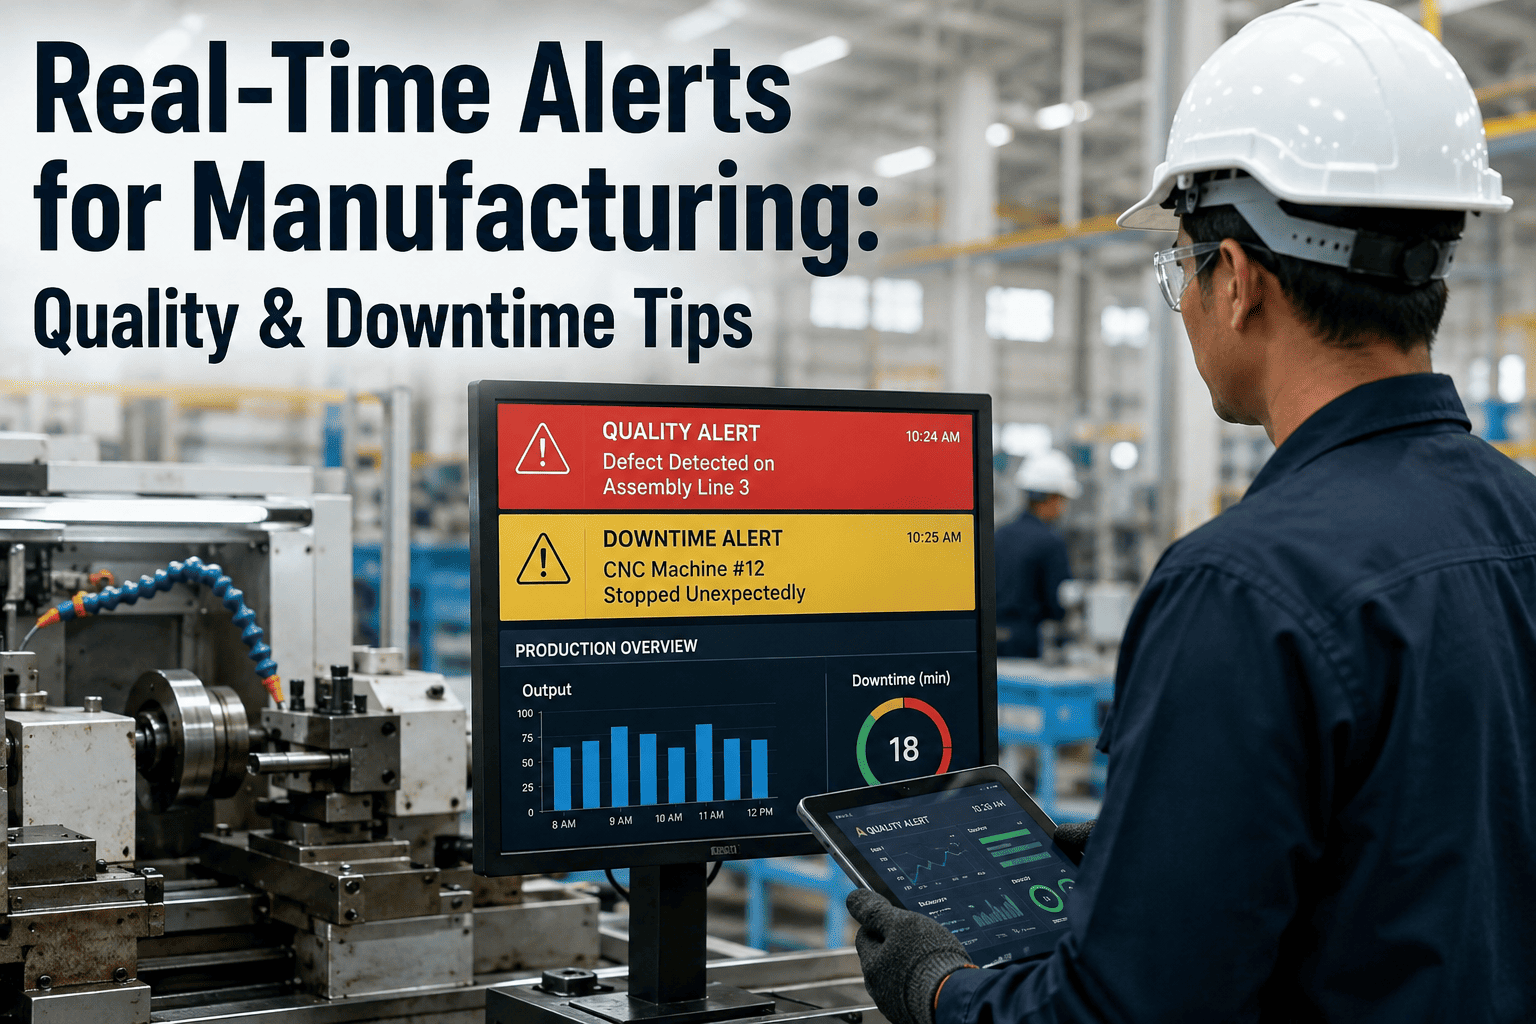
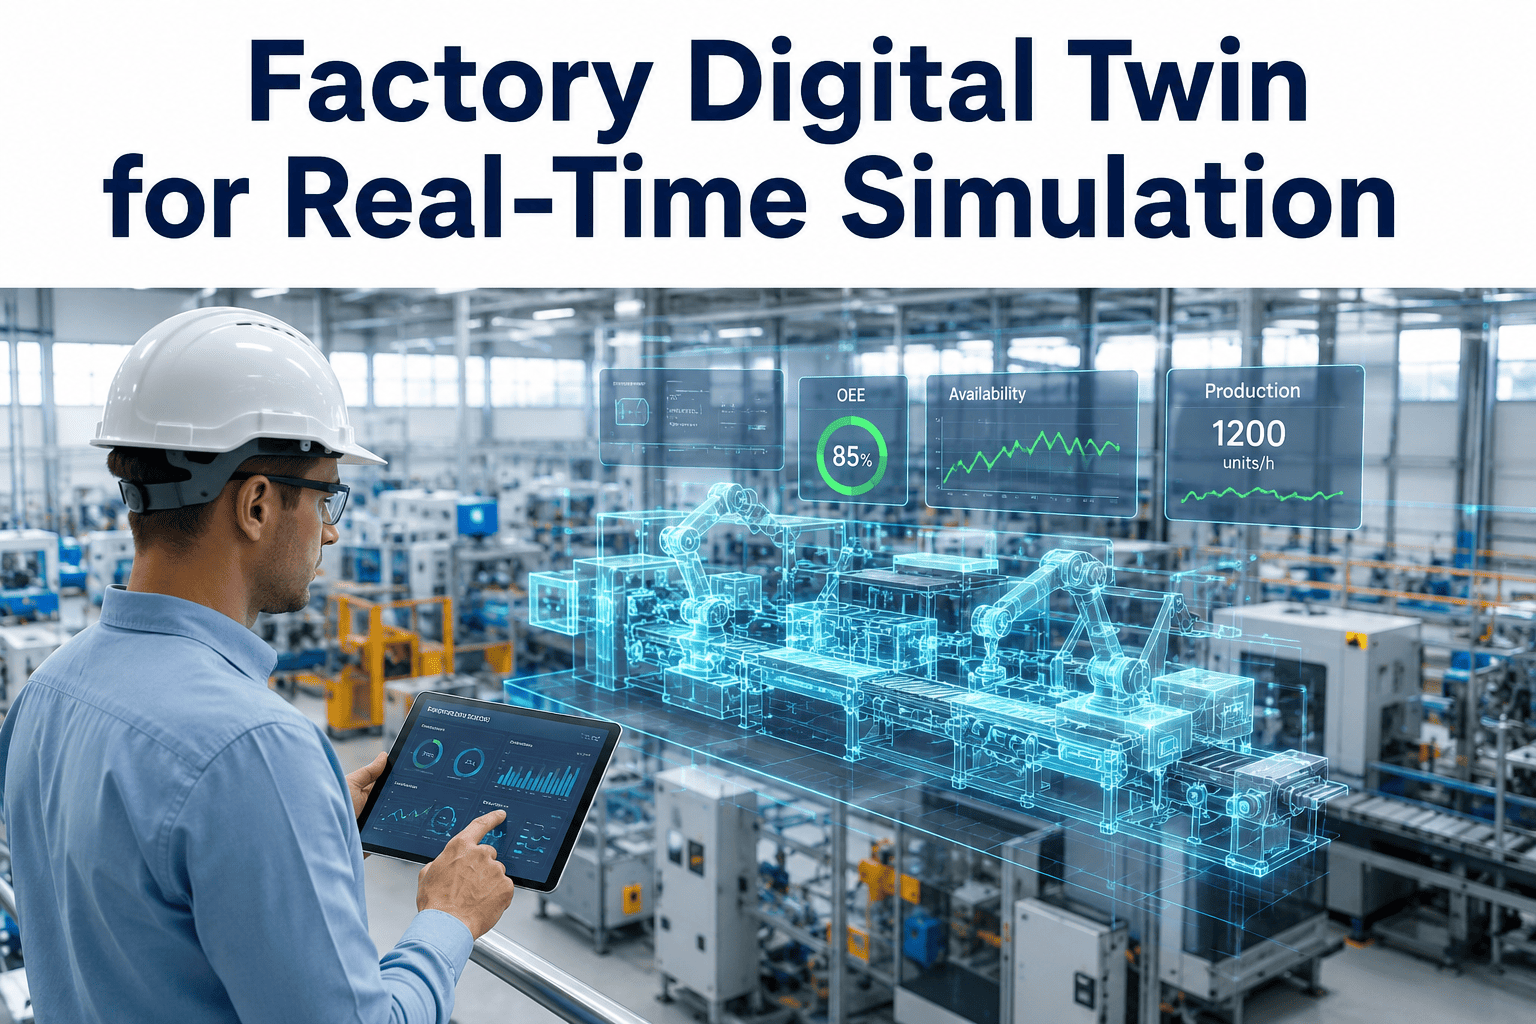
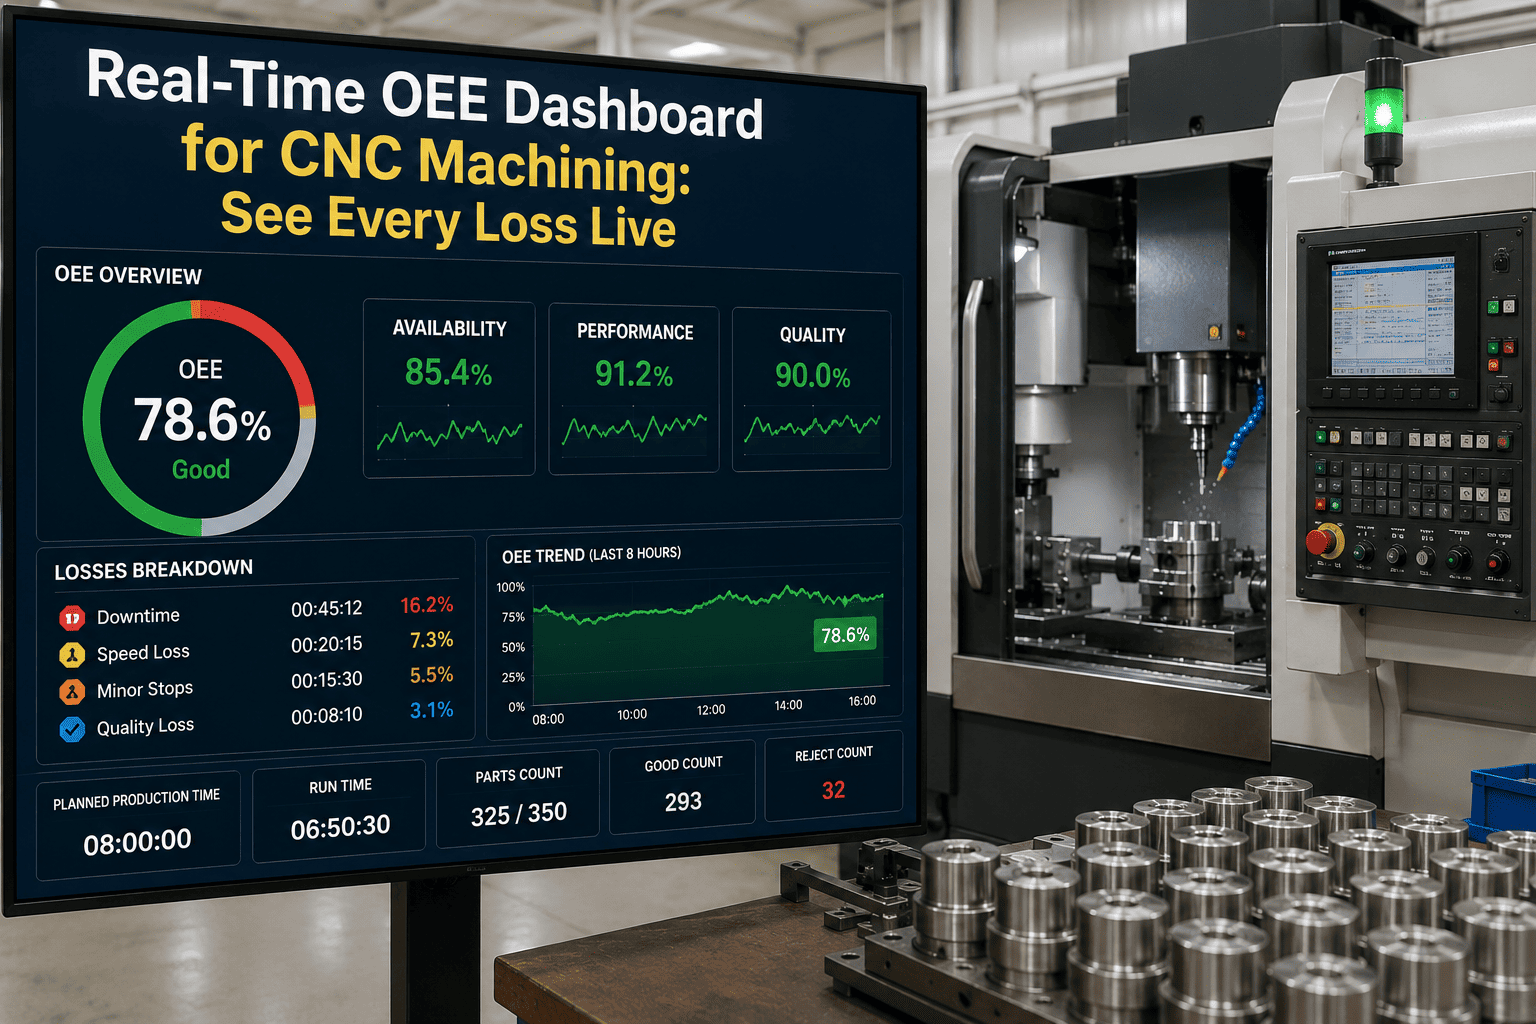
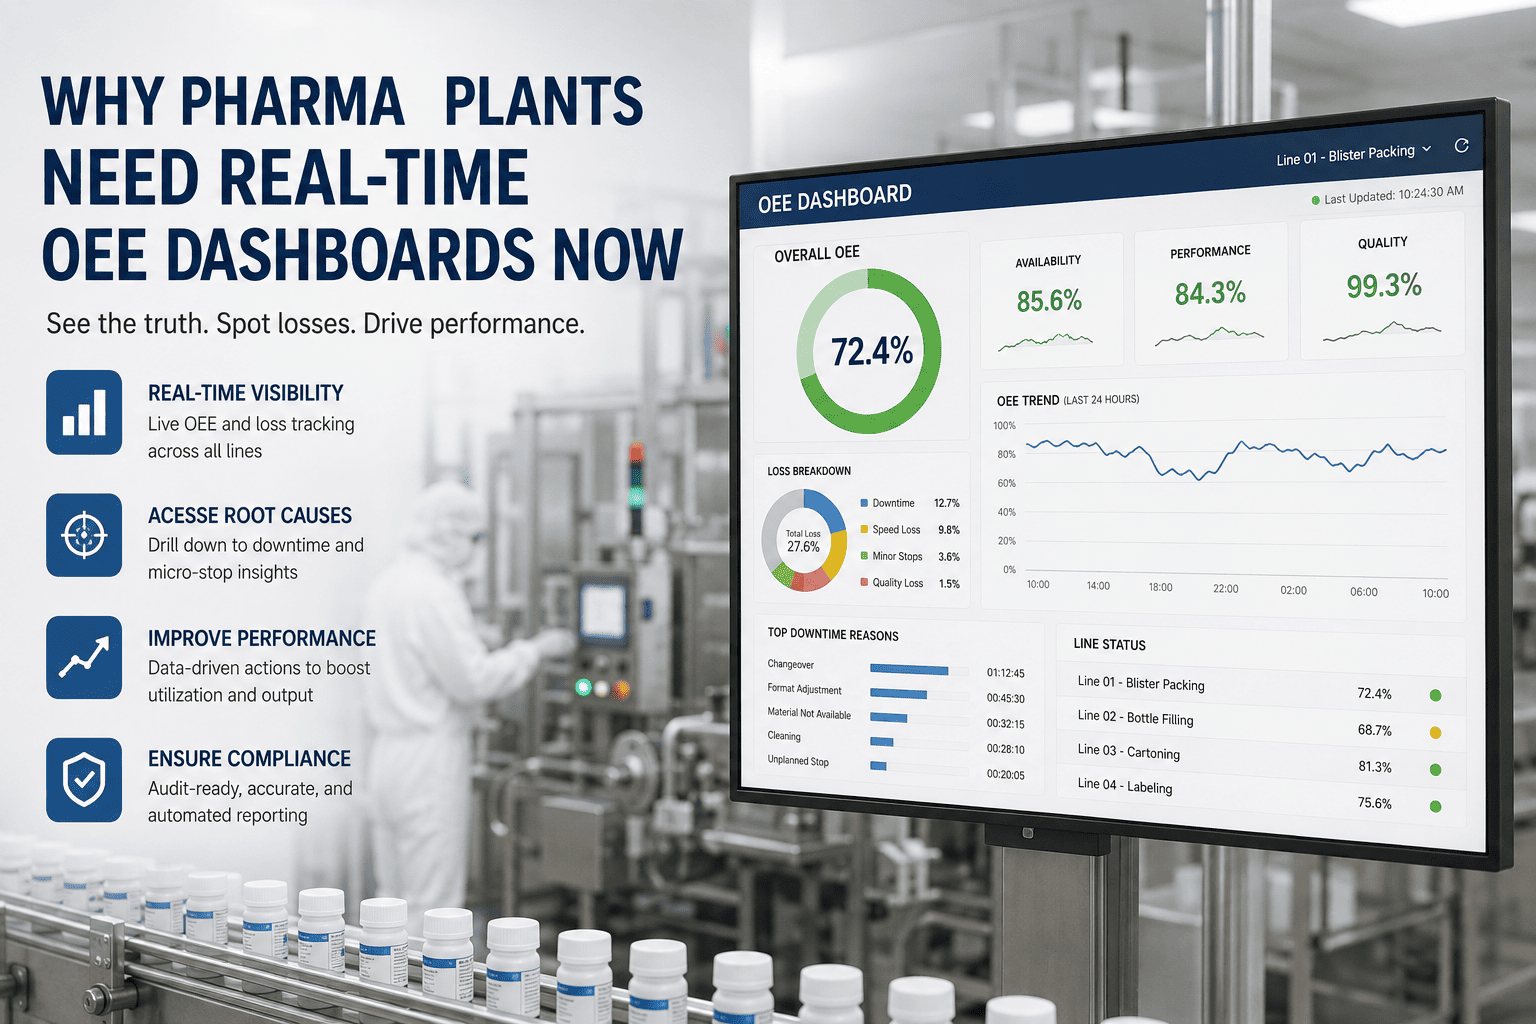
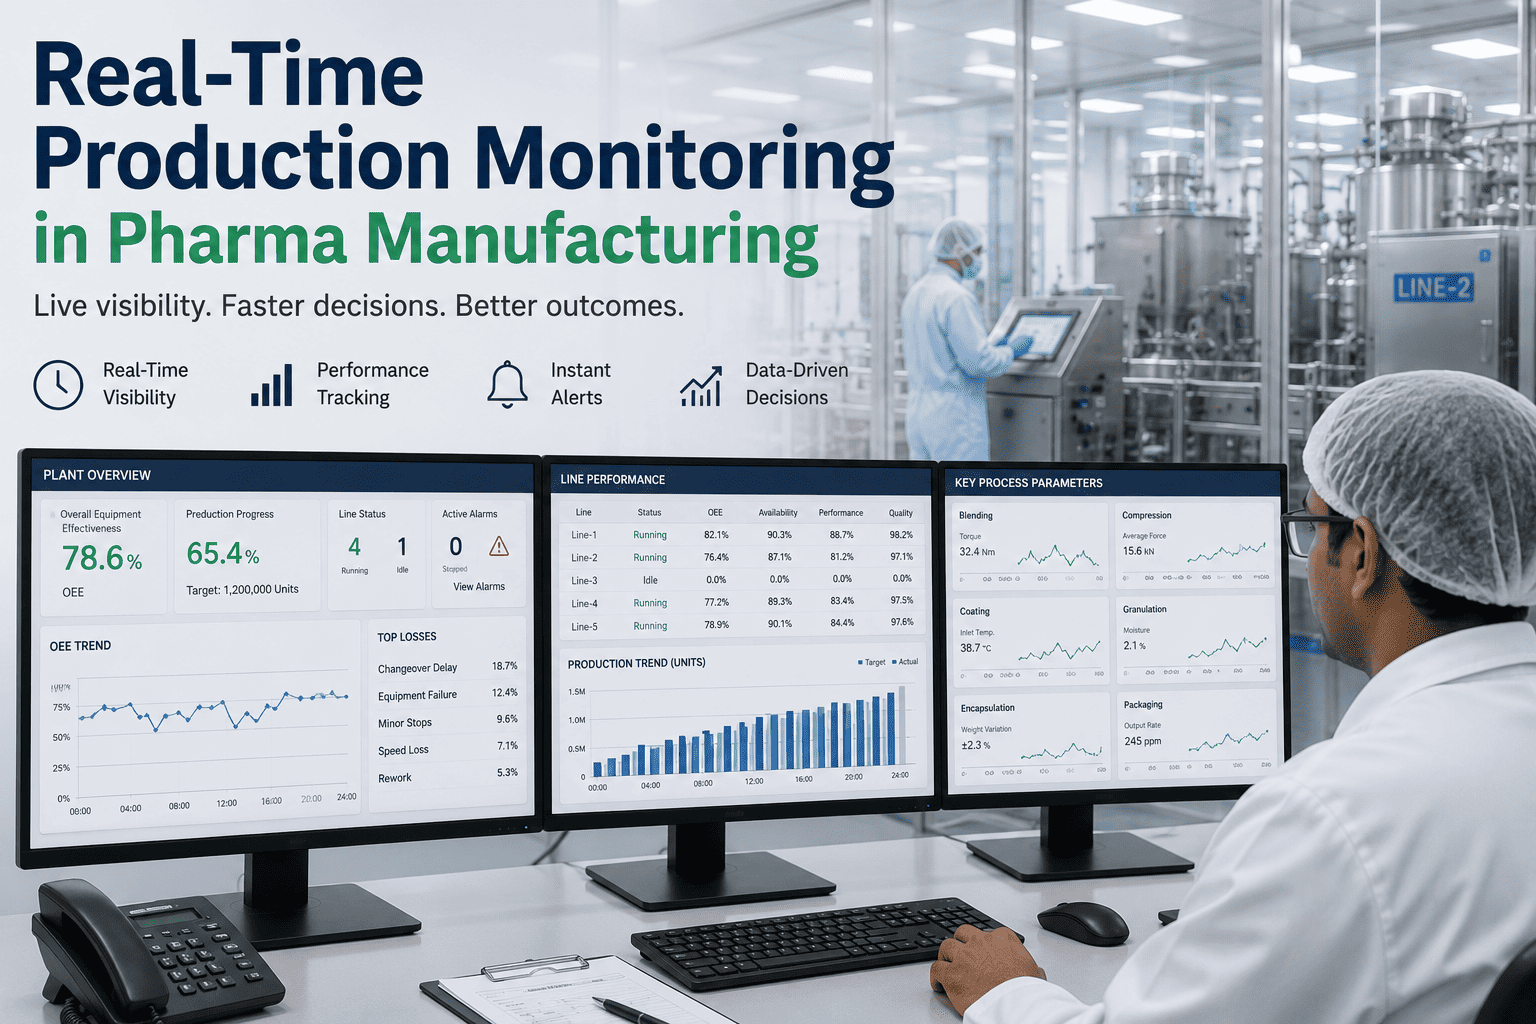
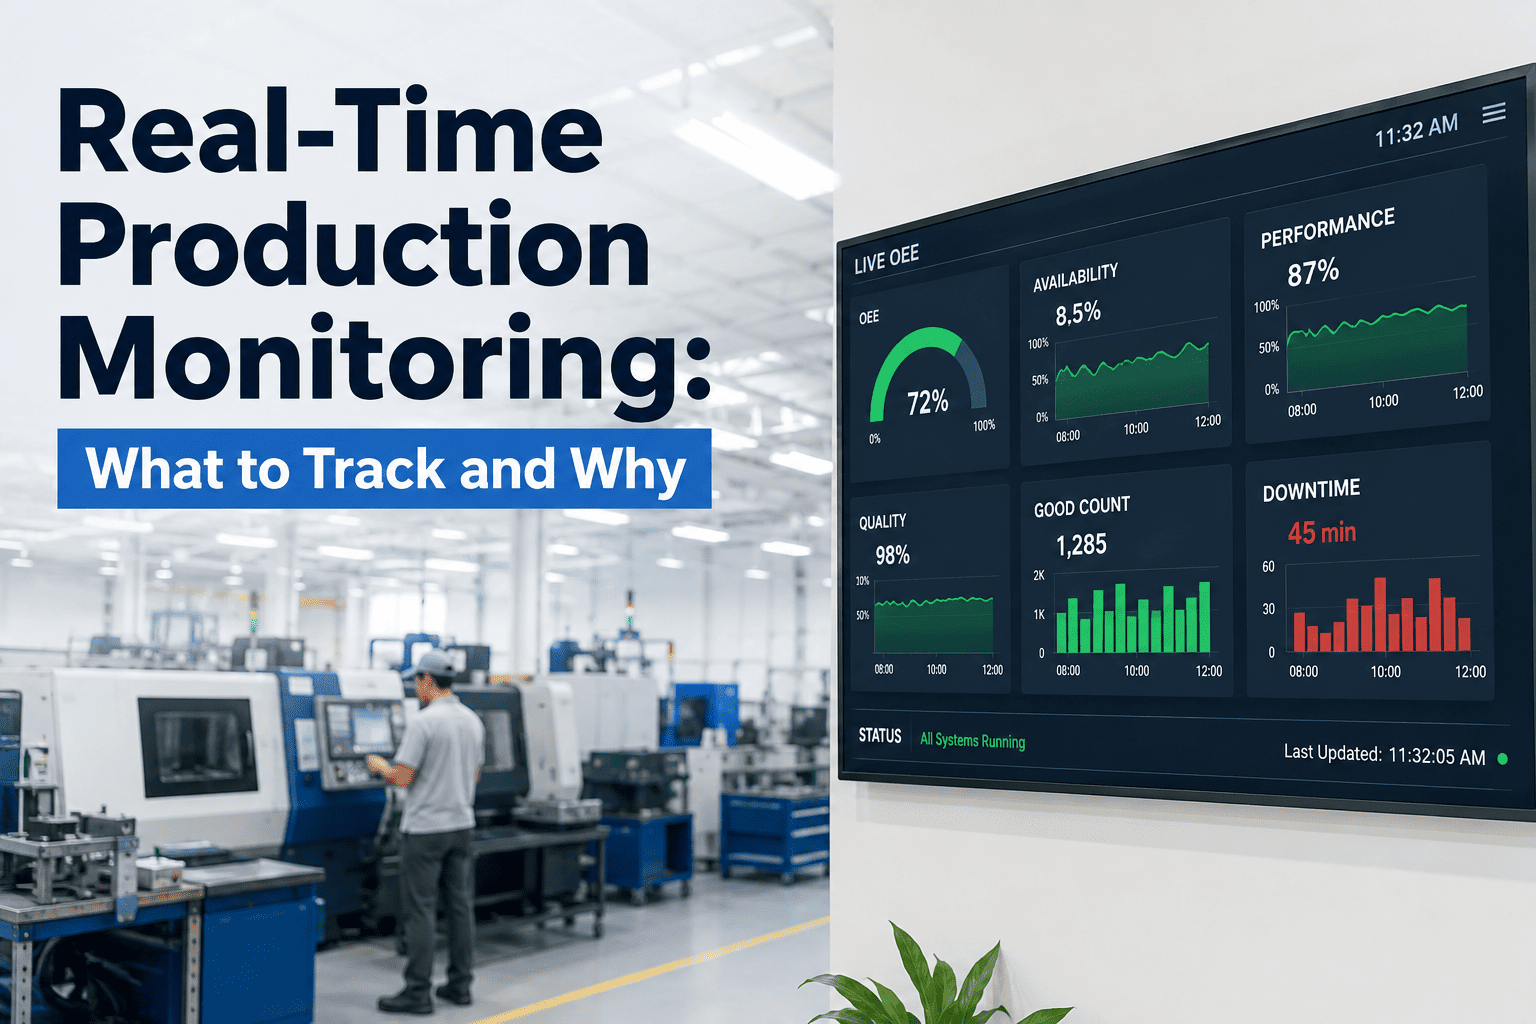
By the time a printed downtime report reaches a plant manager's desk, the line has often already lost an hour of production to a problem that could have been fixed in minutes if someone had known about it sooner. Manufacturing floors are full of small, fixable stoppages that go unnoticed simply because there was no fast enough way for the right person to find out. A live OEE dashboard paired with a digital andon system closes that gap by surfacing problems the moment they happen, and you can book a demo to see it running on your own floor.
REAL-TIME MONITORING · DIGITAL ANDON · AI FACTORY VISIBILITY
A Downtime Report Tomorrow Doesn't Fix the Line That Stopped an Hour Ago
iFactory pairs a live OEE dashboard with a digital andon system so stoppages, quality issues, and speed losses are flagged the moment they occur, not discovered in next week's report.
THE DELAYED VISIBILITY PROBLEM
Why Yesterday's Downtime Report Is Already Too Late
Most plants still review OEE and downtime on a delay, whether that means an end-of-shift printout, a next-morning email, or a weekly summary meeting. Every hour between a stoppage happening and someone noticing it is an hour where a fixable problem keeps repeating unaddressed, and small recurring stops are exactly the kind of loss that a delayed reporting cycle is worst at catching.
Line 5
Speed Loss Detected
DELAYED VS LIVE VISIBILITY
What Changes When Response Time Drops From Hours to Seconds
Delayed Reporting Cycle
Downtime discovered in an end-of-shift or next-day report
Maintenance and supervisors notified manually, if at all
Small recurring stops blend into general downtime totals
Response time is measured in hours, sometimes longer
Live Dashboard and Andon
Stoppages and speed loss flagged the moment they occur
Automatic alerts route to the right team without delay
Recurring micro-stops are pattern-matched and surfaced clearly
Response time is measured in minutes, often seconds
See Your Floor Status Live, Not in Tomorrow's Report
iFactory connects your lines to a live dashboard and digital andon system built for immediate response.
WHAT THE SYSTEM MONITORS
The Signals Tracked Continuously Across Every Line
Machine State and Stoppages
Line status is tracked continuously, with stoppages flagged and timestamped the instant they begin, not after the fact.
Speed and Cycle Deviation
Running below rated speed is detected automatically, surfacing performance losses that a simple up-down status would miss.
Quality Alerts
Defect rate spikes are flagged in real time so a quality issue can be addressed before an entire batch is affected.
Escalation Routing
Alerts route automatically to the right maintenance or supervisory contact based on the type and severity of the issue.
RESPONSE TIME COMPARISON
How Quickly Different Monitoring Approaches Surface a Problem
| Monitoring Approach |
Typical Detection Delay |
Response Trigger |
| Manual end-of-shift review |
Several hours |
Supervisor reads report |
| Daily summary email |
Up to 24 hours |
Email is opened and reviewed |
| Static dashboard, manually checked |
Minutes to hours |
Someone happens to look |
| Live dashboard with andon alerts |
Seconds |
Automatic notification sent |
MEASURED RESULTS
Outcomes Reported After Deploying Live Monitoring
60-80%
Faster response time to unplanned stoppages
25%
Reduction in total downtime hours after three months
Fewer
Recurring micro-stops once patterns are surfaced automatically
Real-Time
Visibility replacing next-day or weekly reporting cycles
GETTING STARTED
Rolling Out Live Monitoring Across the Floor
Step 1
Connect Line Signals
PLC, sensor, or MES signals from each line are connected to establish continuous machine state data.
Step 2
Configure Alert Rules
Thresholds for stoppages, speed loss, and quality issues are configured to match your plant's actual tolerances.
Step 3
Set Escalation Paths
Alerts are routed to the correct maintenance, quality, or supervisory contact based on issue type and severity.
Step 4
Go Live on the Floor
Dashboards and andon displays go live, giving every shift immediate visibility into current line status.
FREQUENTLY ASKED QUESTIONS
Questions Teams Ask About Live Dashboards and Andon Systems
Do we need new hardware installed on every machine to get live visibility?
In most cases existing PLC, sensor, or MES connections already carry enough signal to establish live machine state without new hardware, since the platform is built to work with data sources plants typically already have in place. Older or fully manual equipment may need a lightweight sensor added, but this is usually the exception rather than the rule across a typical plant floor.
Book a demo to review what your existing lines can already provide.
How are alerts delivered to maintenance and supervisors during a shift?
Alerts can be delivered through the andon display itself, through mobile notifications, or through existing messaging tools depending on what a plant already uses day to day, and multiple channels can be configured together for redundancy. The goal is making sure the right person is notified through whatever channel they are most likely to see immediately, rather than forcing a single delivery method on every team.
Contact support to review delivery channel options.
Can alert thresholds be tuned so we are not overwhelmed with false alarms?
Yes, thresholds for stoppages, speed deviation, and quality alerts are configured specifically for each line's normal operating range, since a threshold copied from a different process would generate far too many irrelevant alerts. Thresholds can also be refined over time as more data accumulates, so alert accuracy typically improves the longer the system runs.
Book a demo to see how thresholds are configured for your specific lines.
Does the dashboard work for plants running multiple shifts across different time zones?
Yes, the dashboard is built to support multi-shift and multi-site operations, including plants spread across different time zones, with local shift context reflected accurately for each location rather than a single generic view. This matters for larger operations where a corporate view and a shift-floor view need to show the same underlying data in different, appropriately scoped ways.
Contact support to discuss a multi-site rollout.
How long does it typically take to go from signed contract to a live andon system on the floor?
Timelines vary depending on how many lines and data sources are involved, but a focused initial rollout on a handful of priority lines is often achievable within a few weeks once data connections are confirmed and alert thresholds are agreed upon. Larger, plant-wide rollouts are typically phased line by line to keep the transition manageable for shift teams.
Book a demo to discuss a realistic rollout timeline for your plant.
Stop Finding Out About Downtime a Day Too Late
iFactory gives your floor live visibility and instant alerts so problems get fixed while they are still small.