Most manufacturers know the OEE formula is Availability times Performance times Quality, but knowing the formula and calculating it correctly are two different skills. The gap between them is where a plant's reported OEE and its real OEE quietly diverge — sometimes by ten points or more. This guide walks through one real production example step by step, showing exactly which numbers go into each factor and where the calculation typically goes wrong. To see these numbers calculated automatically from your own line data, talk to our team at ifactory support.
The Formula Is Simple. Getting the Three Inputs Right Is Not.
This walkthrough follows one automotive stamping line through all five calculation steps, using the exact numbers a shift supervisor would actually record on the floor — and flags the specific decision points where two people looking at the same shift data can end up with two very different OEE numbers.
The Line We're Calculating: An 8-Hour Automotive Stamping Shift
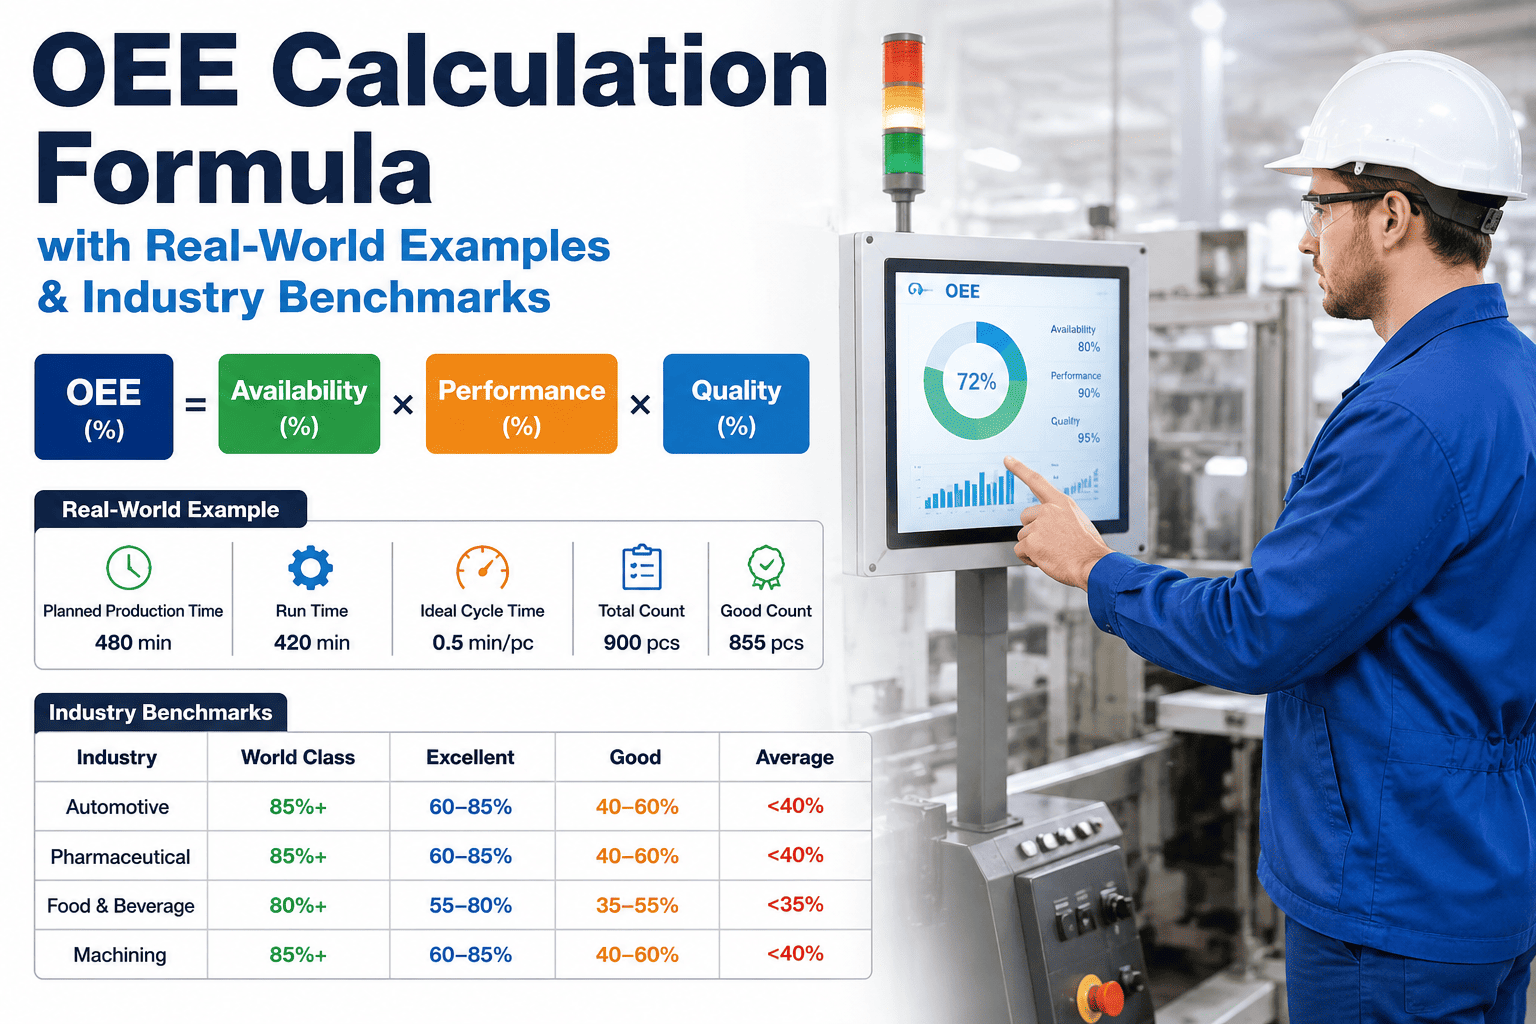
Before any calculation starts, every OEE figure needs the same five raw inputs recorded from the shift. These numbers rarely arrive pre-organized — a supervisor typically pulls them from a stop-time log, a parts counter, and a quality inspection sheet, then has to reconcile all three before the actual math can begin. Here's what the shift log looked like for this line before any calculation happened.
What Each Input Actually Means Before You Plug It Into a Formula
A calculation is only as reliable as its inputs, and each of the five numbers above has its own definition question that needs a clear answer before the math starts. Getting the formula right and getting the inputs right are two separate skills, and most calculation errors trace back to the second one, not the first — a plant can apply the OEE formula perfectly and still produce a misleading number if the underlying inputs were defined inconsistently.
Step One: Calculate Availability
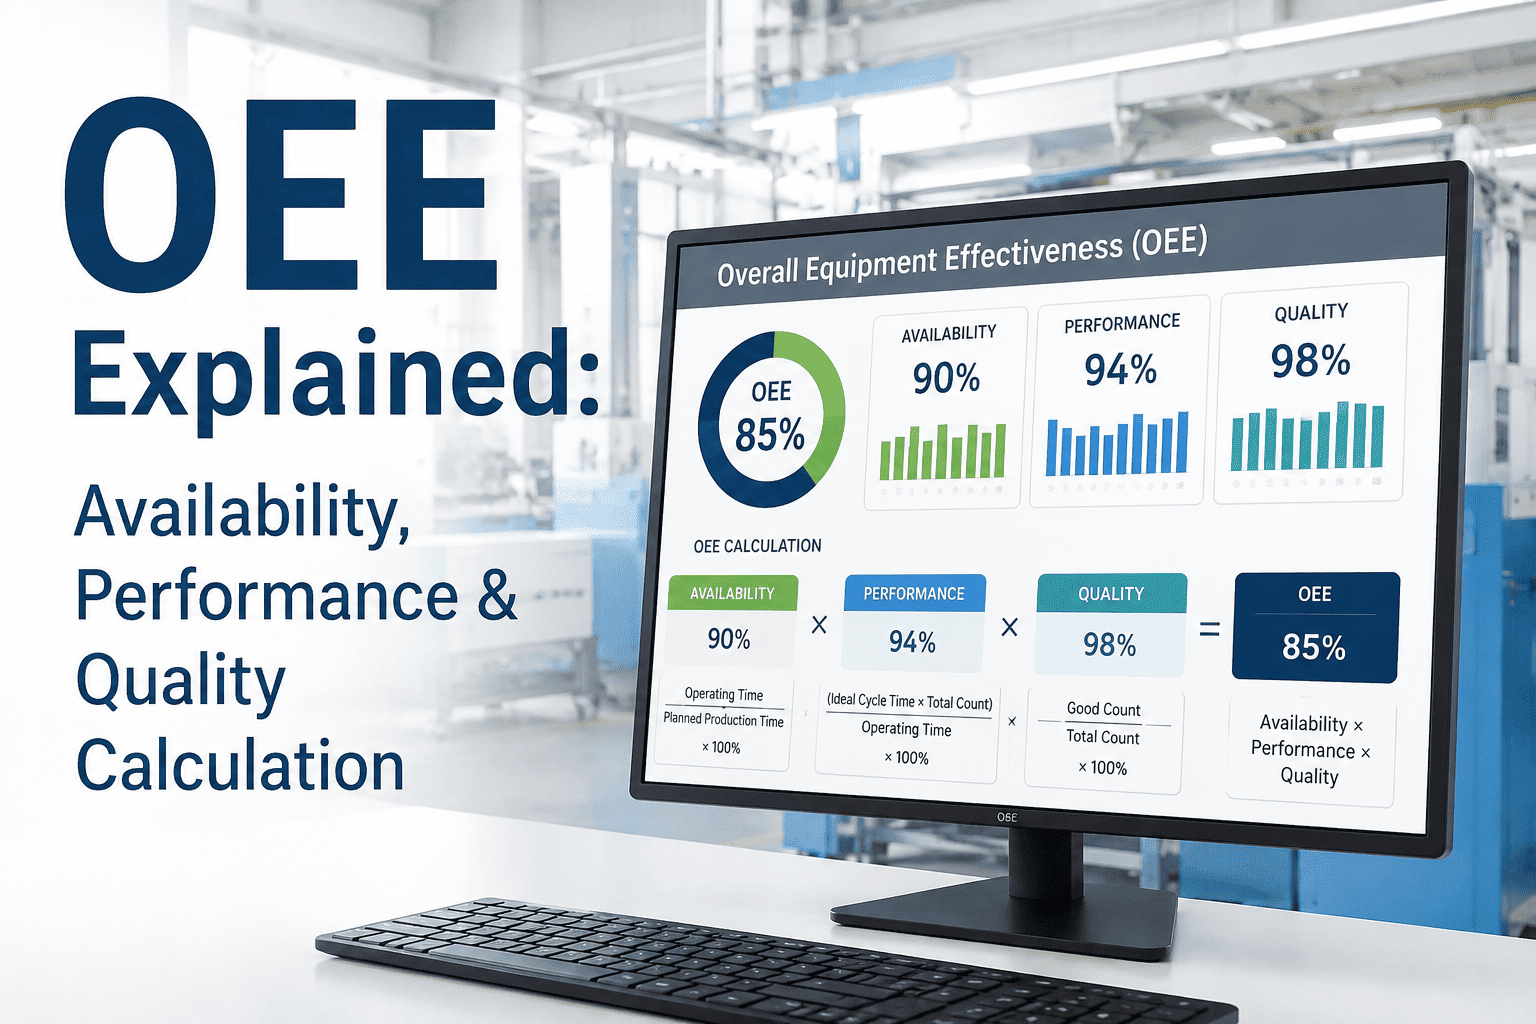
Availability = Run Time ÷ Planned Production Time
Run Time is what's left after every stop is subtracted from Planned Production Time — and every stop means every stop. Breakdowns, die changeovers, and safety holds all count, even the ones a supervisor might be tempted to call "planned" because they happen every shift. The temptation to treat a routine, recurring stop as somehow outside the calculation is exactly how Availability numbers drift upward over time without anyone deciding to change the method.
Step Two: Calculate Performance
Performance = (Ideal Cycle Time × Total Count) ÷ Run Time
Performance compares what the line actually produced to what it should have produced running at its fastest demonstrated or rated speed for every minute it was actually running. The ideal cycle time has to be the equipment's best possible speed, not the shift's typical speed — this single choice of denominator is where more OEE calculations go wrong than almost anywhere else in the formula.
Step Three: Calculate Quality
Quality = Good Parts ÷ Total Parts
Good parts means parts that passed inspection on the first pass, with no rework involved. A part that failed and was later reworked into an acceptable part is still counted as a quality loss, because the labor and delay it cost were real even if the part was eventually saved — first-pass yield, not eventual yield, is what the standard OEE definition is actually measuring.
Step Four: Multiply the Three Factors
OEE = Availability × Performance × Quality
This is the step most people already know — but it only produces a trustworthy number if the three inputs feeding it were calculated honestly in the first place. Multiplying three inflated numbers together just compounds the inflation.
Every Number Above Came From a Shift Log — Yours Doesn't Have To
Manual OEE tracking depends on someone recording stop time, cycle counts, and rejects accurately every shift. iFactory pulls the same three factors directly from equipment data, with none of the manual entry errors that cause the inflation shown above.
Step Five: Compare Against a Realistic Benchmark
A raw OEE number means little without context. World-class OEE is widely cited as 85% and above, but very few plants actually operate there, and comparing an honest number against that ceiling can feel discouraging without knowing where typical plants actually land. Most discrete manufacturers report OEE somewhere between 40% and 60%, which makes this example's 71.3% a solidly above-average result, even though it still leaves real room for improvement before reaching the top quartile.
A Second Example: The Same Five Steps, a Different Line
The formula and the steps don't change from industry to industry, but the numbers behind them look very different. Here's the same five-step process applied to a liquid filler running a 12-hour shift with frequent product changeovers, to show how the calculation adapts to a different production environment without changing its underlying logic.
This line's 178 minutes of stop time break down into five changeovers averaging 22 minutes each, plus breakdowns and jams — a very different loss profile from the stamping example, where changeovers were fewer but longer. High-changeover environments like multi-SKU filling lines tend to see Availability, not Performance or Quality, dominate their total loss, which is a very different improvement priority than the stamping line above even though both lines landed in a similar overall OEE range.
Reading the Result: Which Factor Cost the Most
Once all three factors are calculated honestly, they tell you where to focus improvement effort. In this example, Availability lost the most ground, which points to changeover time and breakdowns as the first place to look — not because Availability is always the biggest factor, but because on this particular line, on this particular shift, it happened to be.
Why the Same Shift Can Produce Two Different OEE Numbers
Every number in this walkthrough came from a shift log a person filled out by hand. That's normal, but it's also exactly where inconsistency creeps in — one supervisor logs every stop over two minutes, another only logs stops over five, and both plants end up reporting "OEE" numbers that were never calculated the same way in the first place. The formula itself never changes, but the discipline behind capturing its inputs consistently is what actually determines whether the resulting number means anything.
| Calculation Input | Manual Shift Log | Automated Equipment Tracking |
|---|---|---|
| Stop time capture | Depends on what the operator remembers to write down | Every stop recorded automatically, including sub-minute micro-stops |
| Ideal cycle time | Often set once and rarely revisited | Benchmarked continuously against the line's best demonstrated runs |
| Part counts | Manually tallied or read from a basic counter | Captured directly from line sensors in real time |
| Rework tracking | Easy to mix into "good" counts without a clear separation | Tagged as a distinct category, kept out of first-pass quality |
| Consistency across shifts | Varies by whoever is filling out the log that day | Same calculation logic applied to every shift automatically |
Frequently Asked Questions
Calculate OEE Automatically From Your Equipment Data
iFactory pulls Availability, Performance, and Quality directly from your equipment and production data, calculated to the same standard shown in this walkthrough, updated continuously instead of once per shift report.