Overall Equipment Effectiveness collapses three independent questions — is the machine running, is it running at full speed, and is what it's making actually good — into a single number, and that compression is exactly what makes OEE both useful and easy to misunderstand. A plant reporting 75% OEE could be measuring accurately and performing solidly, or it could be hiding a meaningful chunk of lost capacity inside a calculation gap nobody's questioned. Understanding what each of the three components actually measures, and how they multiply together rather than average together, is the foundation everything else in OEE improvement builds on — trying to improve a number before understanding how it's actually built tends to produce effort aimed at the wrong loss category. See how iFactory calculates Availability, Performance, and Quality automatically from machine data, without manual time-recording or end-of-shift reconstruction.
The three-factor formula behind manufacturing's most important single metric — what each component actually measures, how they multiply rather than average, and a full worked example from real shift data.
OEE was formalized as ISO 22400-2, but it originated decades earlier with Seiichi Nakajima's 1988 Total Productive Maintenance framework, which grouped equipment losses into what's known as the Six Big Losses. Each of those six losses maps to exactly one of OEE's three components — equipment failures and setup time reduce Availability, minor stops and reduced speed reduce Performance, and process defects and startup yield loss reduce Quality. This mapping is why OEE has exactly three factors rather than some other number — it was built specifically to capture six well-documented, historically observed categories of manufacturing loss in a structured way.
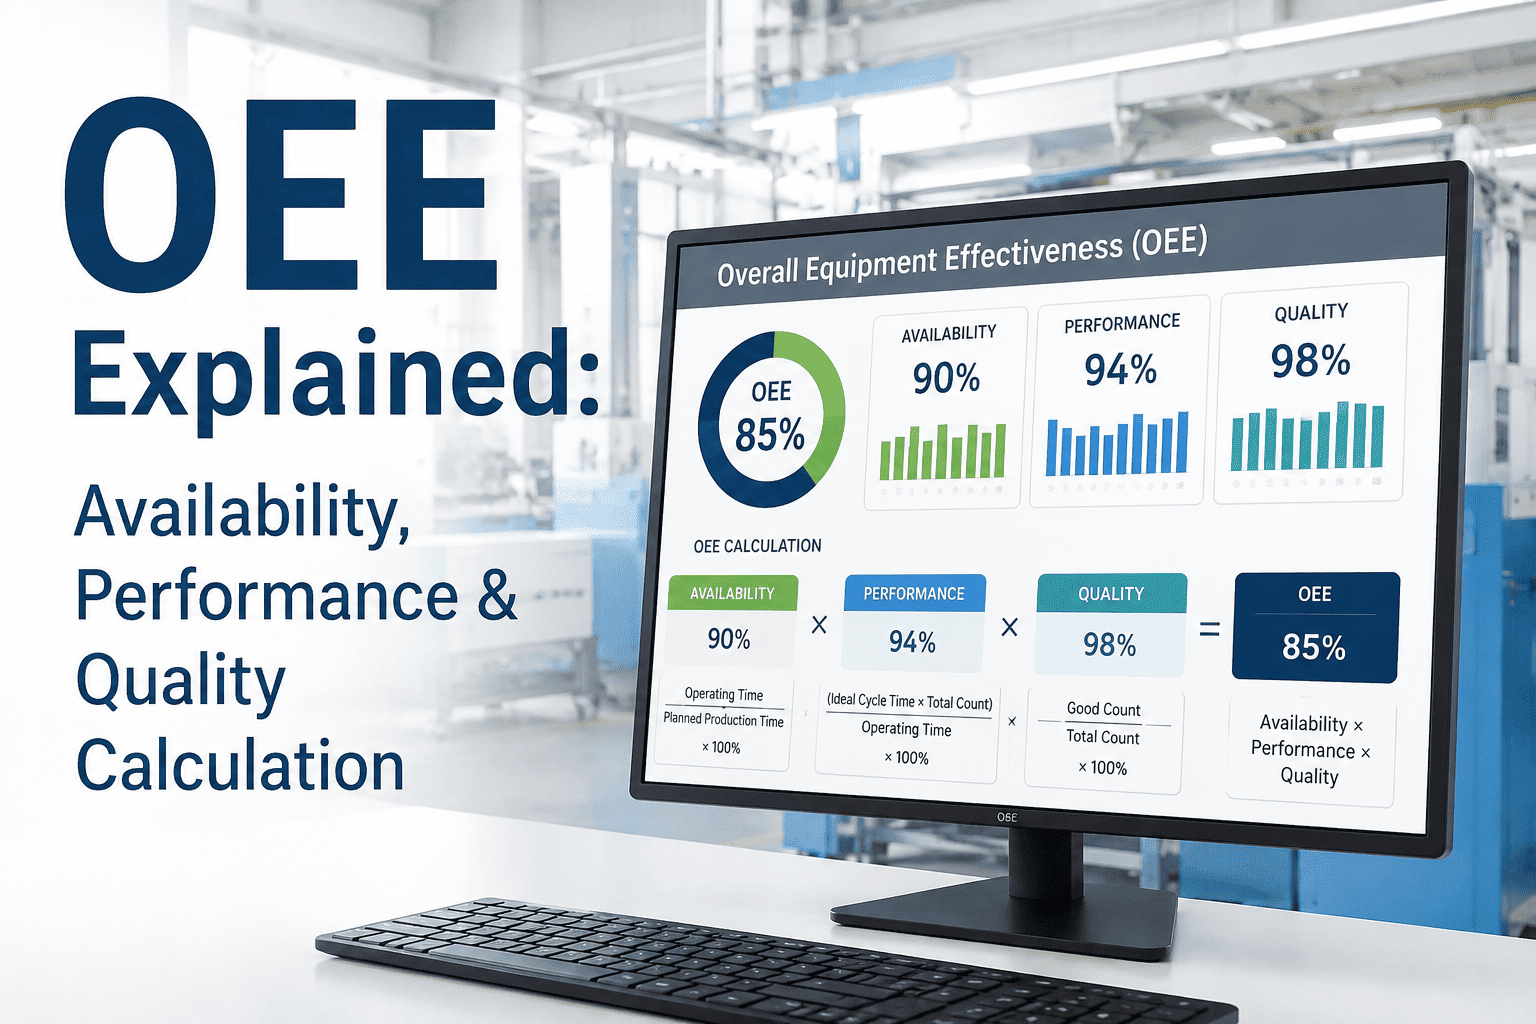
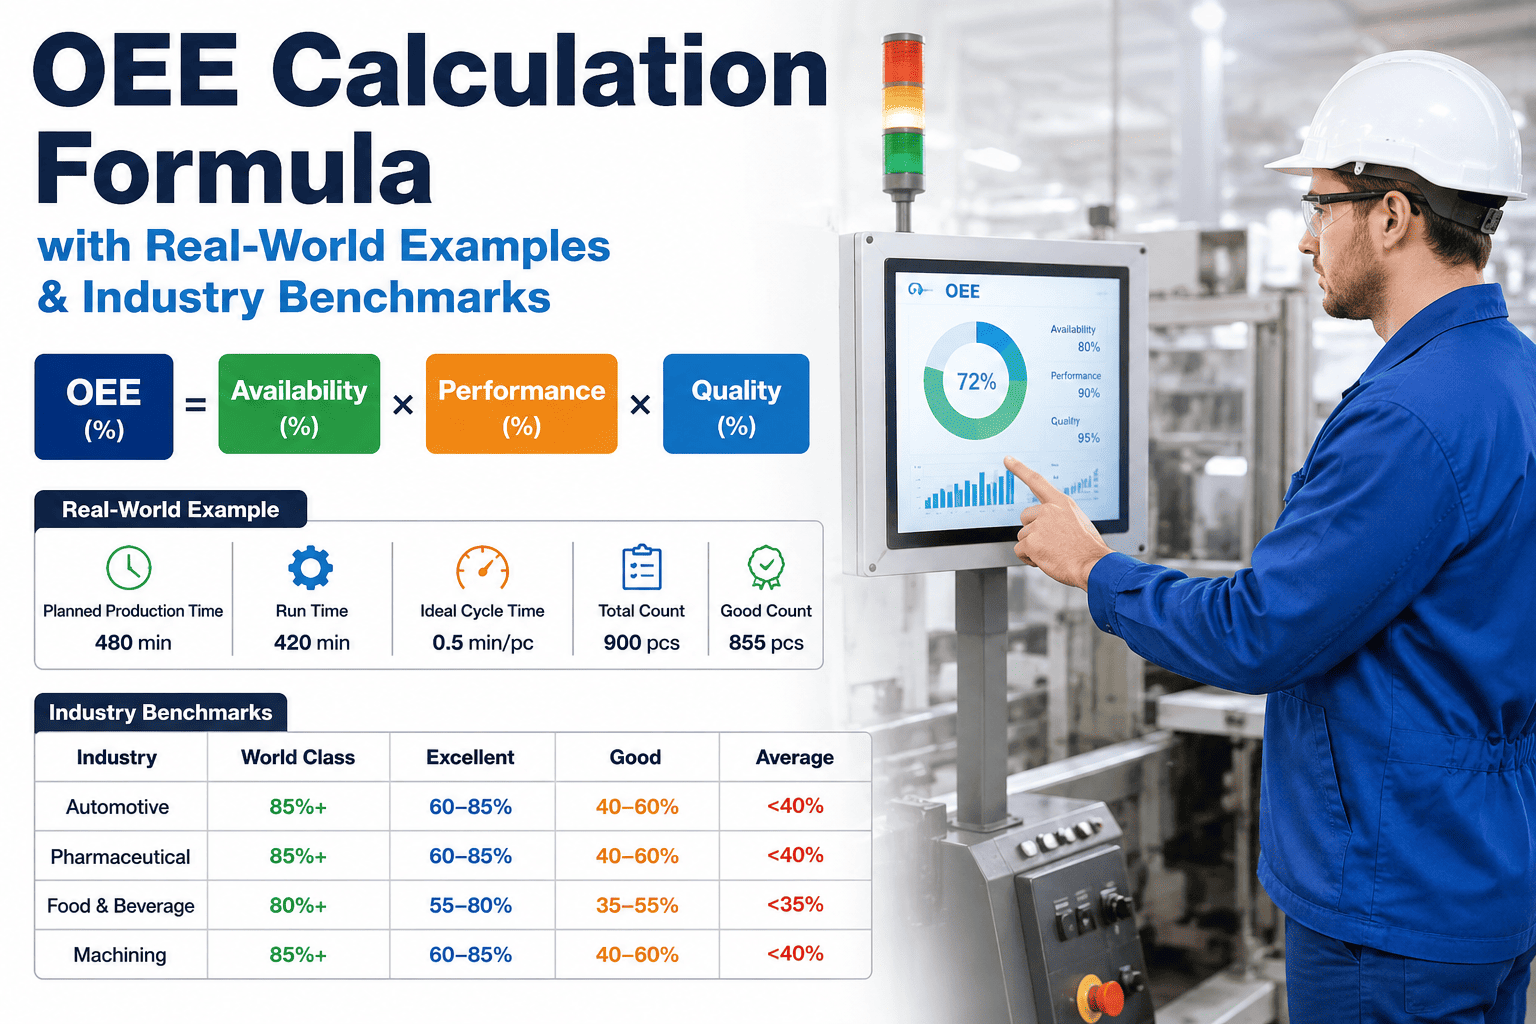
The formula itself is a straightforward multiplication: OEE equals Availability times Performance times Quality, with each factor expressed as a ratio between 0 and 1. That multiplication, rather than a simple average, is the detail most people miss when they first encounter OEE — and it's the detail that makes the number behave less forgivingly than intuition expects.
The Three Components, One at a Time
What Each Factor Actually Measures
Each component answers a genuinely different question about a completely different point in the production process, and understanding that distinction is what makes it possible to correctly diagnose which factor is actually driving a low OEE number.
Component 1
Availability
Availability = Run Time ÷ Planned Production Time
Availability answers one question: was the machine actually running during the time it was scheduled to run? It's reduced by unplanned downtime — breakdowns, unplanned stops — and by planned downtime that eats into production time, like changeovers and setup. It deliberately excludes scheduled non-production time such as breaks and shift changes, since that time was never intended to be productive in the first place.
Component 2
Performance
Performance = (Ideal Cycle Time × Total Count) ÷ Run Time
Performance answers a different question: while the machine was running, was it running at full designed speed? This factor is reduced by minor stops too short to count as downtime and by cycles running slower than the equipment's rated ideal cycle time. A machine that never fully stops but consistently runs at 80% of its rated speed has a Performance factor of roughly 0.80, even though Availability looks perfect.
Component 3
Quality
Quality = Good Count ÷ Total Count
Quality answers the third question: of everything actually produced, how much was good on the first pass? This factor captures process defects and reduced-yield startup losses — units that came off the line but didn't meet specification, requiring scrap or rework rather than counting as productive output.
Worked Example
One 8-Hour Shift, Calculated Start to Finish
The scenario below walks through a realistic shift on a single production line, calculating each of the three factors from the same underlying shift data before multiplying them together — the same sequence a plant would follow with its own real numbers.
Shift Data: 8-Hour Shift, One Production Line
Planned Production Time480 minutes
Downtime (changeover + one breakdown)60 minutes
Run Time420 minutes
Ideal Cycle Time1.0 minute/unit
Total Count Produced378 units
Good Count (passed inspection)360 units
Availability = 420 ÷ 480= 0.875 (87.5%)
Performance = (1.0 × 378) ÷ 420= 0.900 (90.0%)
Quality = 360 ÷ 378= 0.952 (95.2%)
OEE = 0.875 × 0.900 × 0.952= 0.750 — 75.0% OEE
Notice that all three individual factors look reasonably solid — 87.5%, 90%, and 95.2% would each pass a casual glance. Multiplied together, they produce 75% OEE, meaningfully below the commonly cited 85% world-class threshold. This is the multiplication effect in action: three good-but-imperfect numbers compound into a noticeably lower combined result than any one of them suggests in isolation.
The nearly 16-point gap between the naive average and the actual multiplied result isn't a rounding artifact — it's the entire point of the formula. OEE was deliberately designed this way because a unit of production genuinely has to survive all three loss categories in sequence to count as truly effective: it has to happen during available run time, at full rated speed, and come out meeting spec. A number that only clears two of the three thresholds contributes nothing to effective output, and the multiplication is what correctly reflects that reality instead of softening it into a forgiving average.
Three Good Numbers, One Mediocre Result
87%, 90%, and 95% Multiply to 75% — Not an Average Around 91%
iFactory calculates all three OEE factors automatically from PLC and SCADA data, so the multiplication happens continuously instead of being reconstructed manually at shift end.
"World-Class 85%" Is a Discrete-Manufacturing Number, Not a Universal One
The 85% world-class figure gets cited constantly, but independently benchmarked data consistently shows the realistic range varies considerably by sector, largely because of structural factors like regulatory overhead, changeover frequency, and product complexity that don't apply equally across every manufacturing context.
Context
Typical Median
Top-Quartile / World-Class
Discrete Manufacturing (general)
60–65%
85%+
Automotive Tier-1
75–85%
86–92%
Metals & Heavy Industry
~71%
~88%
Pharmaceutical (GMP)
62–72%
76%
Aerospace Components
~48%
~72%
Comparing your OEE against the generic 85% figure when you run a pharmaceutical GMP line or an aerospace component cell is comparing against the wrong ceiling entirely. Benchmark within your own sector, and treat sustained improvement from your own honest baseline as the more meaningful signal than proximity to a number that may not even apply to your context.
Common Calculation Mistakes
Where Reported OEE Diverges From Real OEE
These four patterns are the most consistently documented reasons a plant's reported OEE number diverges from what a rigorous, independently verified calculation would actually show.
Manual Time-Recording Inflates the Number
Manually logged OEE is consistently measured 8 to 12 percentage points higher than automatically, sensor-measured OEE for the same line — operators rounding stop times, missed micro-stops, and end-of-shift reconstruction all bias the manual number upward.
Micro-Stops Under 5 Minutes Go Uncounted
Stops too brief to trigger a formal downtime log are frequently the largest hidden loss category, commonly accounting for a substantial share of total losses across sectors — and they disappear entirely from Availability if nobody's tracking sub-5-minute stops specifically.
Confusing OEE With TEEP
OEE measures performance against Planned Production Time; TEEP (Total Effective Equipment Performance) measures against full calendar time, 24/7/365. TEEP is always lower than OEE and answers a different question — use OEE for operational improvement, TEEP for capacity expansion decisions.
Under-Weighting Quality Relative to Availability
Downtime is visible and dramatic; a slowly climbing scrap rate is not. The OEE formula treats all three factors as mathematically equivalent, but plant culture often doesn't — quality losses get less improvement attention than availability losses despite carrying identical weight in the calculation.
Field Perspective
“
The moment OEE actually clicks for someone is almost always the same moment: when they see three individually decent numbers multiply into something meaningfully worse than any of them. People expect an average. They get a penalty. Once that lands, the whole metric stops feeling like a vanity number and starts feeling like an honest one — because it's genuinely harder to hide a real problem inside a multiplication than inside an average. My advice to anyone new to OEE is simple: don't chase the 85% headline number in your first year. Establish an honest baseline first, measured the same way every time, and treat month-over-month improvement from that baseline as the real scoreboard — the specific number matters far less than whether it's moving in the right direction.
Behrouz Tanaka-Okonkwo
Continuous Improvement Lead · 15 years implementing OEE tracking programs across discrete and process manufacturing
Common Questions
Frequently Asked Questions
Why does OEE multiply the three factors together instead of averaging them?
OEE multiplies Availability, Performance, and Quality because each factor represents units of good production surviving that specific loss category, and losses compound sequentially as a unit moves through the process — a unit has to survive downtime loss, then speed loss, then quality loss, in sequence, to count as truly effective production. Averaging would treat the three factors as independent and interchangeable, but they're not: a machine that's perfectly available but produces nothing of value delivers zero effective output, which only a multiplicative formula correctly captures. This is the same mathematical principle behind Rolled Throughput Yield in multi-step quality processes, applied here across a single asset's three loss categories instead of across sequential process steps, and it's why a plant with three individually reasonable-looking factors can still land at a genuinely mediocre overall OEE. Book an OEE baseline review to see how your specific factors combine.
What's the actual difference between Availability, Performance, and Quality losses?
Availability losses occur when the machine isn't running at all during scheduled production time — breakdowns, changeovers, unplanned stops. Performance losses occur while the machine is running but not at its full rated speed — minor stops too brief to log as downtime, and cycles running slower than the ideal cycle time. Quality losses occur on units that were actually produced but didn't meet specification — scrap, rework, and startup yield loss before the process stabilizes. Nakajima's original Six Big Losses framework maps two loss categories to each of these three components, which is the historical origin of why OEE has exactly three factors rather than some other number.
Is 85% OEE a realistic target for every manufacturing plant?
No — the 85% figure is specifically a discrete-manufacturing benchmark, and independently benchmarked data shows meaningfully different realistic ranges by sector: automotive Tier-1 plants often run 75 to 92%, while pharmaceutical GMP lines typically see 62 to 76% and aerospace component manufacturing often sits in the 48 to 72% range, due to structural factors like regulatory overhead and inspection requirements that don't apply equally everywhere. Comparing your plant's OEE against the generic 85% figure when your sector has a structurally different ceiling produces a misleading picture of performance — benchmark within your own industry context instead.
Why is manually calculated OEE usually higher than automatically measured OEE for the same line?
Manual OEE calculation depends on operators or supervisors logging stop times and reasons by hand, typically at shift end or during a lull, which introduces systematic bias — brief stops get missed entirely, stop durations get rounded down, and reconstruction from memory tends to favor a more flattering picture than what actually happened. Independently benchmarked comparisons consistently find manually logged OEE running 8 to 12 percentage points higher than the same line measured automatically through direct sensor or PLC data, which means a plant relying entirely on manual OEE tracking is very likely overstating its true performance by a meaningful margin. Talk to solutions engineering about automating OEE calculation directly from your machine data.
Should a plant new to OEE tracking focus on hitting the world-class benchmark immediately?
No — the more useful first goal is establishing an honest, consistently measured baseline, since a plant improving from 52% to 62% over a year represents more genuine operational progress than a plant reporting a static 78% that may not even be measured accurately. Many plants moving from paper-based or manual OEE tracking to automated, sensor-based measurement discover 5 to 15 percentage points of previously invisible loss within the first month, simply because the new measurement method catches what manual tracking missed — that initial drop is a measurement correction, not an actual performance decline, and it's important context for interpreting the first few months of accurate data.
Measure It Right Before You Try to Improve It
Availability, Performance, and Quality — Calculated Automatically, Every Shift
iFactory calculates all three OEE factors directly from PLC and SCADA data, catching the micro-stops and speed losses manual tracking misses — so your baseline reflects what's actually happening, not what got logged at the end of a busy shift.