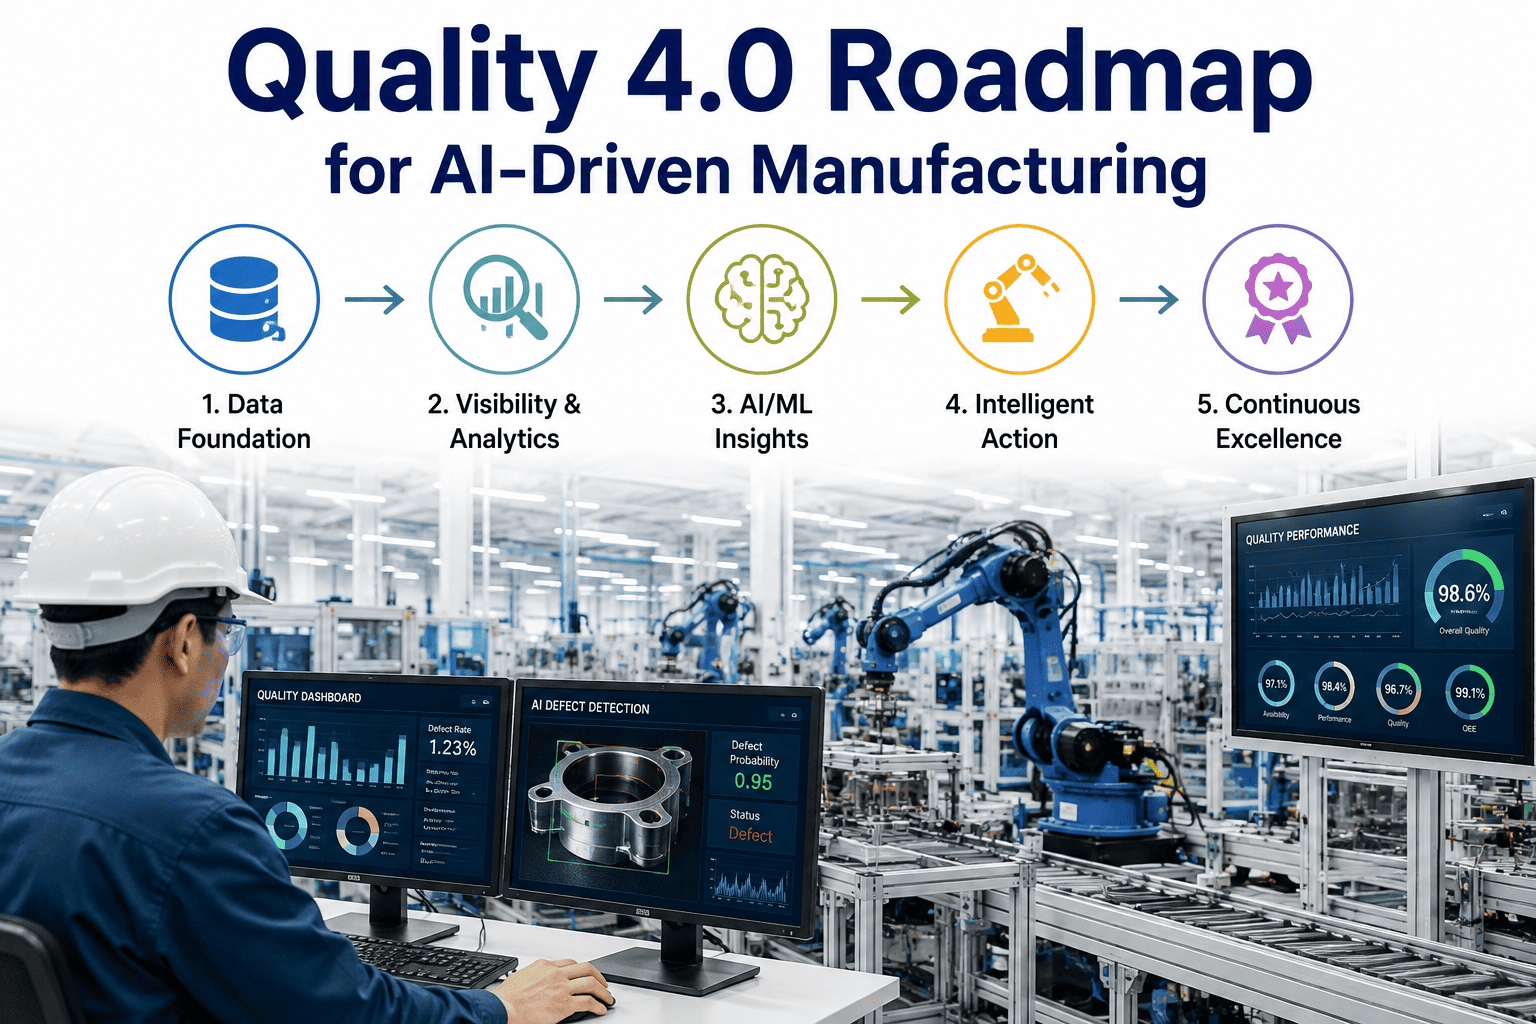
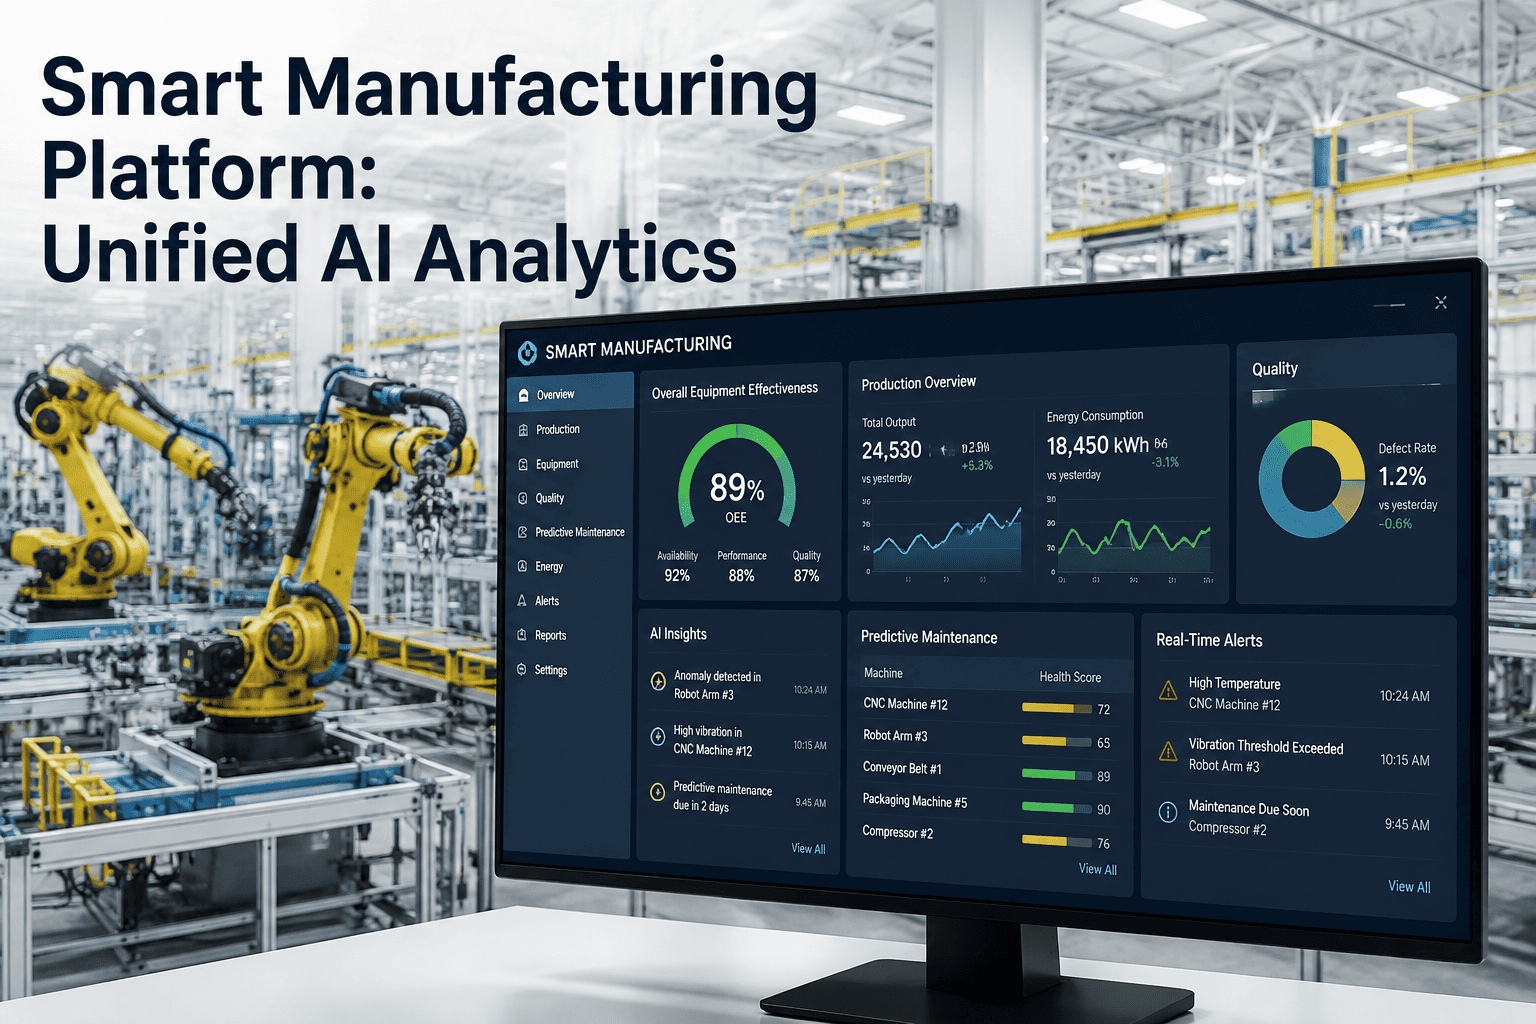
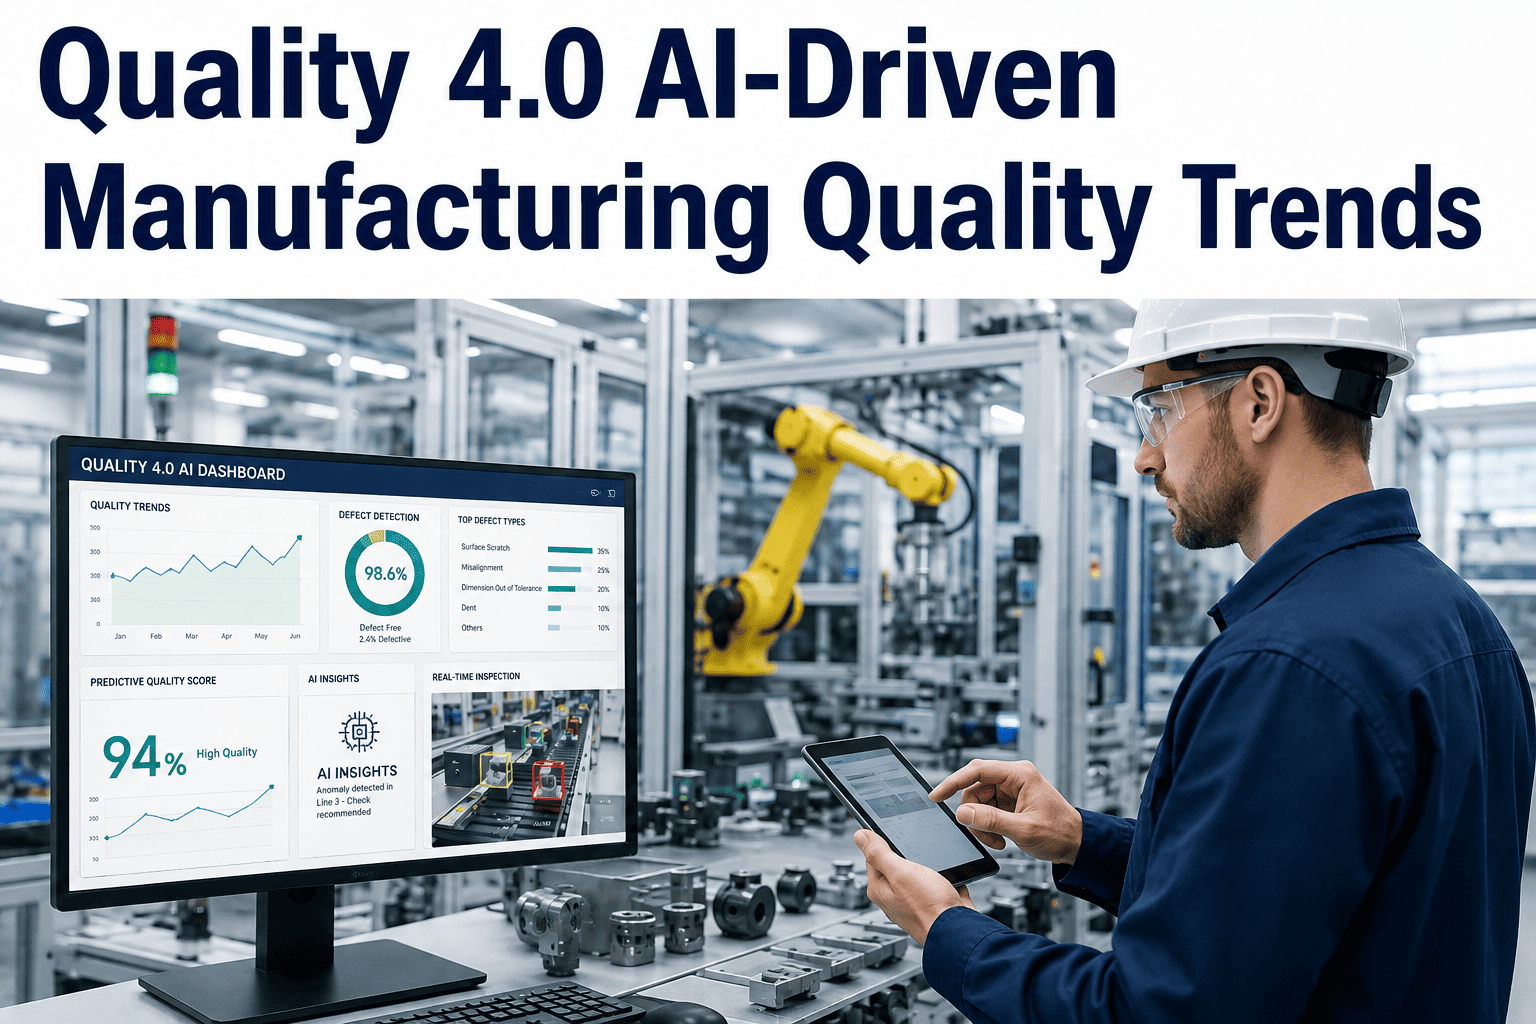
Quality 4.0 is not a product you purchase — it is a capability state you build through a deliberate sequence of investments in data infrastructure, analytics, and automated response. Most manufacturers are stuck somewhere between Level 1 and Level 2 of this journey: they have SPC charts that nobody acts on, inspection stations that catch defects after they have already been made, and root cause processes that rely on one engineer's experience rather than connected process data. The gap between where most plants operate and where Quality 4.0 requires them to be is not a technology gap — it is a data connectivity and workflow integration gap. iFactory's Quality 4.0 platform closes that gap by connecting unit-level sensor data, vision inspection outputs, and SPC analytics into a single live system — moving quality from a post-process inspection function to a real-time prediction and prevention capability built into every production step.
Quality Management · SPC Analytics · AI-Driven Manufacturing
The Quality 4.0 Roadmap: From Inspection to Prediction in Five Stages
A structured implementation guide for Quality Managers and QA Engineers building the capability architecture that connects unit-level process data, live SPC, AI vision, and automated root cause into a single quality intelligence system.
Quality Maturity Scale
5
Autonomous Prevention
4
Predictive Quality
3
Connected Analytics
2
Digital Measurement
1
Manual Inspection
Most plants operate at Level 1–2. iFactory accelerates the journey to Level 3–4 within 90 days.
The Maturity Model
Five Levels of Quality Maturity: Where Are You Today?
Before designing a Quality 4.0 roadmap, a plant must honestly assess its current maturity level. The five-level model below is derived from the Quality 4.0 framework developed by the American Society for Quality (ASQ) and adapted for discrete and process manufacturing environments. Each level has specific capability requirements, data infrastructure prerequisites, and measurable quality outcomes that distinguish it from the levels above and below.
Quality is determined by human inspection at the end of the production process. Defects are caught after they are made — never before. Quality data is recorded on paper forms or in disconnected spreadsheets. Root cause analysis depends entirely on individual inspector memory and shift-based knowledge that is rarely documented.
Signature Indicators
First-pass yield tracked weekly or monthly — not in real time
No SPC — operators use go/no-go gauges and visual judgment
Cost of quality accounts for 10–20% of revenue (industry benchmark)
Customer escapes are the primary quality feedback mechanism
Measurement data is captured digitally — CMM outputs, digital calipers, in-line gauging feeding data into a QMS or SPC software. Control charts exist and are reviewed in weekly quality meetings. But the data pipeline is batch-based: measurements are uploaded daily or hourly, not streamed. Reaction to out-of-control signals happens in the next meeting, not in the next minute.
Signature Indicators
SPC charts exist but are reviewed retrospectively — not acted on in real time
Cpk and Ppk calculated quarterly from batch data exports
QMS holds inspection records; process historian holds production data — no connection
Root cause analysis is a weekly corrective action meeting — not an automated workflow
Quality data and process data are connected in real time. SPC control limits are calculated from live sensor streams, not batch uploads. When a control chart signals an out-of-control condition, an alert is generated instantly — at the machine, on the supervisor's dashboard, and in the corrective action workflow. First-pass yield is visible by shift, by line, and by part number without manual compilation.
Signature Indicators
Live SPC on all critical-to-quality (CTQ) parameters — alarms fire in real time
Process data and quality outcomes linked at the unit level
Cpk trending continuously — capability degradation detected before defects are made
CAPA triggered automatically by SPC alarm — not by a weekly meeting
AI models trained on historical process-quality correlations predict defect probability before the part is complete. Sensor readings, tool wear data, material batch parameters, and environmental conditions feed a prediction model that flags high-risk process windows in advance. Vision AI inspects 100% of units at line speed with defect classification — not binary pass/fail.
Signature Indicators
Defect prediction models active on critical processes with Cpk below 1.33
Vision AI inspection with defect type classification and location mapping
Automated root cause correlation — defect patterns matched to process parameter shifts
Cost of quality typically 4–8% of revenue at this maturity level
The quality system closes the loop autonomously — when a defect prediction model identifies a high-risk condition, the system adjusts process parameters in real time without human intervention. Digital twin models simulate quality outcomes for new process configurations before production begins. Zero-defect is a design target, not an aspiration.
Signature Indicators
Closed-loop process adjustment — no human in the corrective action loop for known fault modes
Digital twin quality simulation for new product introduction
Cost of quality below 2–3% of revenue
Zero-defect performance on mature process families
Capability Gap Diagnostic
The Eight Gaps That Separate Level 2 from Level 3
The most common Quality 4.0 implementation barrier is not budget or technology — it is a set of specific data and workflow gaps that prevent real-time quality analytics from functioning even when the measurement infrastructure exists. The following eight gaps are the diagnostic checklist every Quality Manager should complete before designing a Level 3 implementation plan.
| Capability Gap |
Level 2 State |
Level 3 Requirement |
Typical Fix Effort |
| SPC data latency |
Measurement data uploaded in batches — hourly or daily |
Real-time data stream from gauging equipment to SPC engine — latency under 30 seconds |
2–4 weeks |
| Process-quality linkage |
Quality data in QMS; process data in historian — no join key |
Unit-level serial or timestamp join linking each measurement to the process conditions at time of manufacture |
4–8 weeks |
| Control limit management |
Static control limits set once, never updated — often wrong for current process |
Dynamic control limits recalculated from rolling production baseline — auto-updated when process changes |
1–3 weeks |
| Out-of-control response |
SPC alarm reviewed in next shift meeting or weekly review |
SPC alarm triggers immediate notification to operator and supervisor with escalation workflow if not acknowledged in 15 minutes |
1–2 weeks |
| Cpk / Ppk visibility |
Process capability calculated quarterly from exported data in Minitab or Excel |
Live Cpk dashboard by part number, operation, and machine — updated continuously from production data |
2–3 weeks |
| Defect traceability |
Defects recorded by shift and part family — no unit-level traceability |
Every defect linked to unit serial number, process station, operator, tool, and process parameters at time of failure |
6–12 weeks |
| CAPA workflow integration |
CAPA initiated manually from quality meeting minutes — disconnected from SPC data |
CAPA auto-initiated from SPC alarm with process data snapshot attached — no manual transcription required |
3–6 weeks |
| First-pass yield visibility |
FPY compiled manually from shift reports — available T+24 hours or later |
Live FPY by line, shift, part number, and operation — updated every production cycle |
2–4 weeks |
SPC Implementation Blueprint
Building Live SPC: The Technical Architecture Quality Managers Need to Understand
Statistical Process Control in a Quality 4.0 context is fundamentally different from classical SPC. The chart type, sample size logic, and control limit methodology are largely unchanged — but the data pipeline, alert routing, and integration with process data are entirely new requirements. The following architecture defines what a production-grade live SPC system requires at each layer.
Layer 1 — Data Acquisition
Measurement signals flow from in-line gauging equipment, CMMs, vision systems, and sensor arrays to a data collection layer. Connection methods: OPC-UA (for modern equipment), Modbus/TCP (for legacy PLC-connected gauging), direct API (for digital measurement tools), and edge device data capture (for analog signal digitization). Sampling rate must be sufficient to detect the fastest process shift of interest — for most machining processes, one measurement per cycle is the minimum viable rate.
In-line gauging
CMM outputs
Vision systems
Sensor arrays
OPC-UA / Modbus
Layer 2 — SPC Engine
The SPC engine applies Western Electric rules, Nelson rules, or custom rule sets to the incoming data stream and fires alerts when control rules are violated. Chart types are selected per characteristic: X-bar/R for variable data from rational subgroups, individuals/moving-range (I-MR) for one-measurement-per-cycle processes, P-charts and C-charts for attribute data from vision inspection counts. Control limits are calculated from the first 25–30 subgroups of stable production and updated dynamically as the process baseline evolves.
X-bar/R charts
I-MR charts
P-charts / C-charts
Western Electric rules
Dynamic UCL/LCL
Layer 3 — Correlation Engine
When an SPC alarm fires, the correlation engine queries the process historian for the parameter readings on the same unit or time window — spindle load, coolant temperature, tool wear counter, cycle time deviation, material batch ID, ambient humidity. It applies statistical correlation analysis across the available parameters to rank-order which process variables most strongly correlate with the quality deviation. This is the engine that transforms "we have an out-of-control signal" into "here are the three process variables most likely responsible."
Process historian query
Multi-variate correlation
Root cause ranking
Tool wear correlation
Material batch linkage
Layer 4 — Action and CAPA Workflow
Correlation analysis outputs feed directly into the CAPA workflow — not as a manual finding that someone transcribes, but as a structured data package: alarm details, correlated process parameters, affected unit range, recommended investigation steps derived from historical similar events. The quality engineer receives a pre-populated CAPA record with evidence attached. Response time drops from hours to minutes; investigation quality improves because the data package is complete at alarm time, not reconstructed days later from shift logs.
Auto-initiated CAPA
Pre-populated evidence
Escalation routing
8D integration
Containment triggering
See Live SPC and Root Cause Correlation Running on Your Process Data
iFactory connects to your existing measurement equipment and process historian to deliver live SPC, automated Cpk trending, and correlation-based root cause analysis — without replacing your gauging infrastructure or QMS.
Vision AI in Quality 4.0
What AI Vision Inspection Actually Delivers — Beyond Pass/Fail
Vision inspection in a Quality 4.0 system is not a replacement for a human inspector with a camera. It is a structured data source that feeds defect type, defect location, defect size, and defect frequency data into the same analytics layer as your SPC and process data. The distinction between Level 3 and Level 4 quality maturity is largely determined by whether your vision system generates actionable structured data or just binary accept/reject decisions.
Output
Binary pass/fail signal — part accepted or rejected
Defect data
Reject count by shift — no defect type classification
Coverage
Sampled inspection — 1 in N parts depending on cycle time
Process connection
None — reject data not linked to upstream process conditions
Trend detection
Manual — requires someone to notice reject rate climbing
Response
Operator notified of reject; manual investigation initiated
Output
Structured defect record: type, location, size, confidence score — per unit
Defect data
Defect classification by type (scratch, porosity, burr, dimensional, surface) with image evidence
Coverage
100% of units inspected at line speed — no sampling bias
Process connection
Each defect record linked to upstream process parameters at time of manufacture
Trend detection
Defect rate by type on SPC chart — alarm fires when trend emerges, not after batch review
Response
Automated CAPA with defect images, correlated process parameters, and suggested containment
Implementation Roadmap
90-Day Quality 4.0 Implementation: From Level 2 to Level 3
The following roadmap is designed for a manufacturer currently operating at Level 2 quality maturity — digital measurement exists, SPC software is installed, but data is batch-based and quality analytics are retrospective. The 90-day target is Level 3: live SPC on all critical-to-quality parameters, process-quality linkage at the unit level, and automated CAPA initiation from control chart signals. This is the exact implementation path iFactory executes with brownfield manufacturers.
CTQ parameter mapping
Identify the 10–20 critical-to-quality parameters per product family that most strongly predict customer escapes and internal reject rates. Not all parameters need live SPC — start with the highest-leverage subset.
Data source inventory
For each CTQ parameter, document the current data source (CMM, in-line gauge, vision system, manual measurement), its digital output format, its current sampling rate, and whether it currently connects to any analytics system.
Process historian assessment
Identify what process parameters are already captured in the historian or SCADA system — spindle loads, temperatures, pressures, cycle times, tool wear counters — and whether a unit-level timestamp join is possible with quality data.
Deliverable: CTQ map with data source status, gap list, and implementation priority ranking
Measurement equipment connection
Connect priority CTQ measurement sources to iFactory's data acquisition layer. OPC-UA connections for modern equipment take 1–2 days per source. Legacy analog gauging may require edge device digitization (2–5 days per source). CMM integration via standard data export formats (DMIS, Q-DAS) takes 3–5 days.
SPC chart configuration
Chart type selection per CTQ parameter (X-bar/R, I-MR, P-chart, C-chart). Control limit initialization from available historical data — minimum 25 subgroups required for valid UCL/LCL. Western Electric rule set selected and alarm routing configured per chart.
Process historian integration
Connect iFactory correlation engine to the process historian (OSIsoft PI, Aspentech IP21, AVEVA, or direct PLC/SCADA connection). Establish the unit-level timestamp join between quality measurements and process parameter records.
Deliverable: Live SPC running on priority CTQ parameters with alarm routing active
CAPA workflow integration
Configure automatic CAPA initiation from SPC alarms. Each CAPA record is pre-populated with: alarm details, correlated process parameters, affected unit range, and image evidence from vision inspection where applicable. Quality engineers review and approve — they do not recreate the data package from scratch.
Live Cpk dashboard deployment
Process capability index (Cpk) calculated continuously from the live measurement stream. Dashboard displays Cpk by part number, operation, machine, and time window. Cpk trend alert configured at 1.45 (warning) and 1.33 (action required) to detect capability degradation before defects are generated.
Quality team workflow adoption
Shift quality engineers and supervisors trained on alarm response workflow. Daily quality meeting cadence restructured: replace retrospective chart review with prospective alarm status review. First-pass yield dashboard deployed to production floor screens by line and by shift.
Deliverable: Level 3 quality maturity achieved — live SPC, automated CAPA, Cpk dashboard, FPY visibility
Quality ROI Framework
Quantifying the Financial Return from Quality 4.0 Investment
Quality improvement ROI is calculated across four value streams: internal scrap and rework cost reduction, external failure cost reduction (warranty, customer returns, field escapes), inspection and testing cost reduction from 100% AI vision coverage replacing sampled human inspection, and production throughput recovery from reduced quality-related downtime. The following model uses industry benchmark values for a mid-size discrete manufacturer.
Internal Scrap and Rework
Industry average: 3–8% of revenue consumed by internal quality failures
Live SPC with real-time alarm response reduces in-process scrap by detecting process drift earlier. Typical reduction: 35–60% of current internal scrap cost within 12 months of Level 3 implementation. For a plant with $2M annual scrap cost: $700K–$1.2M saved.
External Failures and Warranty
External failure cost: 3–5× more expensive than internal failure due to recall, warranty, and reputation impact
100% AI vision inspection eliminates the sampling gap that allows defective units to escape to customers. Customer escape rate reductions of 70–90% are documented in automotive Tier 1 implementations. Annual warranty cost reduction for a $50M manufacturer: $400K–$1.5M.
Inspection Labor Efficiency
Manual inspection: $35–$80/hour fully loaded; AI vision: $8–$15/unit equivalent cost at volume
100% AI vision inspection at line speed typically replaces 2–6 FTE of end-of-line inspection labor. Inspection throughput increases 4–8× while coverage goes from sampled to complete. Labor cost reduction for a 3-FTE inspection team: $210K–$360K annually.
Production Throughput Recovery
Quality-related production stops: 8–15% of unplanned downtime at Level 2 maturity
Faster defect detection and automated CAPA response reduces the duration of quality-related production stops. Typical OEE improvement from quality losses alone: 2–5 percentage points. For a line producing $10M annually: $200K–$500K in throughput recovery.
Combined Quality 4.0 ROI — Mid-Size Discrete Manufacturer ($50M Revenue)
Internal scrap and rework reduction$700K–$1.2M
External failure and warranty reduction$400K–$1.5M
Inspection labor efficiency gain$210K–$360K
Throughput recovery from quality losses$200K–$500K
Total annual value$1.5M–$3.56M
iFactory Quality 4.0 implementation cost for a mid-size plant: $120K–$280K Year 1. Typical payback: 6–10 months.
"
The biggest mistake I see Quality Managers make when implementing SPC is treating it as a reporting tool rather than a response trigger. I have walked into plants where the control charts are beautiful — live, correctly configured, properly color-coded — and the operators have never been trained to do anything when a rule violation fires. The chart alarms, the data point turns red, and the operator keeps running because nobody told them that a Western Electric Rule 1 violation on the diameter characteristic means stop, measure the last five parts, and call the quality engineer. Quality 4.0 is not about better charts. It is about what happens in the four minutes after a chart signals. That is where the ROI lives — in the gap between signal and response — and that is the gap that iFactory closes by routing the alarm, the correlated process data, and the suggested containment action to the right person's screen before the operator has made another ten defective parts.
Patricia Okonkwo, CQE, CMQ/OE
Quality Systems Director · ASQ Certified Quality Engineer · 16 years in automotive Tier 1 and medical device manufacturing · Former Global Quality Lead, precision components division
Frequently Asked Questions
How is Quality 4.0 different from traditional SPC software?
Traditional SPC software — including tools like Minitab, InfinityQS, and AQAS — excels at statistical analysis of measurement data: control charts, capability studies, Pareto analysis, gauge R&R. What it does not do is connect quality outcomes to upstream process parameters in real time, automatically correlate defect patterns to process variable shifts, or initiate CAPA workflows from alarm signals without manual intervention. Quality 4.0 extends SPC with three capabilities that traditional software lacks: real-time process-quality linkage (connecting each measurement to the process conditions at time of manufacture), AI-driven root cause correlation (ranking which process variables most likely explain a quality deviation), and automated action workflows (CAPA initiation, containment triggering, escalation routing that fires automatically from SPC alarms). iFactory delivers all three capabilities while integrating with — not replacing — existing SPC and QMS tools. Contact iFactory support to discuss how the platform layers above your existing quality infrastructure.
What measurement data sources does iFactory's SPC engine connect to?
iFactory connects to measurement data through four primary methods covering the full range of equipment found in brownfield and greenfield manufacturing environments. First, OPC-UA connections for modern gauging equipment and CMMs with digital communication capability — setup time 1–2 days per source. Second, Modbus and EtherNet/IP connections for legacy PLC-connected measurement systems — covers the majority of in-line gauging installed before 2015. Third, standard quality data file formats (Q-DAS, DMIS, CSV, direct CMM exports from Zeiss, Hexagon, Renishaw, and others) for batch-capable measurement systems where live streaming is not available. Fourth, direct API connections for digital handheld tools from Mahr, Mitutoyo, and Starrett with Bluetooth or USB output capability. In most brownfield implementations, the measurement infrastructure already exists and iFactory connects to it without hardware replacement. Book a technical session to confirm connectivity for your specific equipment mix.
How does automated root cause correlation work in practice?
When a SPC control chart alarm fires — for example, a Western Electric Rule 1 violation (one point beyond three sigma) on a critical bore diameter — iFactory's correlation engine simultaneously queries the process historian for all available process parameter readings on the affected unit or time window. Available parameters typically include spindle speed and load, coolant temperature and flow, tool wear counter, cycle time, ambient temperature, material batch identifier, and fixture or pallet ID. The engine calculates the statistical correlation between each available process variable and the quality deviation, ranks them by correlation strength, and presents the quality engineer with a ranked list: "Spindle load deviation: r=0.87. Tool wear counter above 4,200 cycles: r=0.79. Coolant temperature +3.2°C above baseline: r=0.61." This is not a diagnosis — it is a ranked hypothesis list that a quality engineer validates. But it replaces 2–4 hours of manual investigation with a 15-minute confirmation activity. Over multiple alarm events, the system learns which correlations consistently predict which defect types on each process, improving root cause accuracy over time. Explore the iFactory correlation engine documentation for methodology details.
Can iFactory integrate with our existing QMS and CAPA system?
Yes — iFactory integrates with the major QMS platforms used in manufacturing including Intelex, Ideagen (formerly Ecolab Quality), IQS, ETQ Reliance, MasterControl, and SAP QM. Integration is bidirectional: iFactory receives product and process specifications from the QMS (inspection plans, tolerance limits, sampling plans), and pushes CAPA records, non-conformance reports, and SPC alarm data back to the QMS with the full data package attached. For organizations using custom or legacy QMS systems, iFactory provides a structured API that allows CAPA records to be created in any system capable of receiving a webhook or REST API call. The key integration requirement is that your QMS must be able to receive a structured data payload containing alarm details, unit range, correlated process parameters, and image evidence — which all major QMS platforms support. Book a session to confirm integration specifics for your QMS platform.
How long does it take to see measurable quality improvement after iFactory deployment?
The first measurable quality metric — live SPC on priority CTQ parameters with real-time alarm response — is typically active within 3–5 weeks of project start, once measurement data sources are connected and initial control limits are established from historical data. The first documented reduction in internal scrap rate attributable to faster alarm response is typically visible within 30–45 days of live SPC activation, as the quality team begins catching and responding to process drift signals before full defect runs develop. Automated CAPA integration and Cpk dashboard deployment complete the Level 3 implementation by Day 90. The full ROI model — scrap reduction, warranty reduction, inspection labor efficiency, and throughput recovery — reaches its run-rate value by Month 6 as the correlation engine accumulates sufficient event history to produce reliable root cause rankings. Manufacturers in automotive Tier 1 and precision machining have documented payback periods of 6–10 months from the combined quality value streams. Request a case reference from iFactory for your industry sector.
Quality 4.0 Implementation Partner
From Retrospective Charts to Real-Time Prevention — in 90 Days
iFactory connects your existing measurement equipment, process historian, and QMS into a live Quality 4.0 system — with SPC alarms, automated root cause correlation, and Cpk dashboards running on your actual production data. No rip-and-replace. No new gauging infrastructure. Measurable scrap reduction in 30 days.