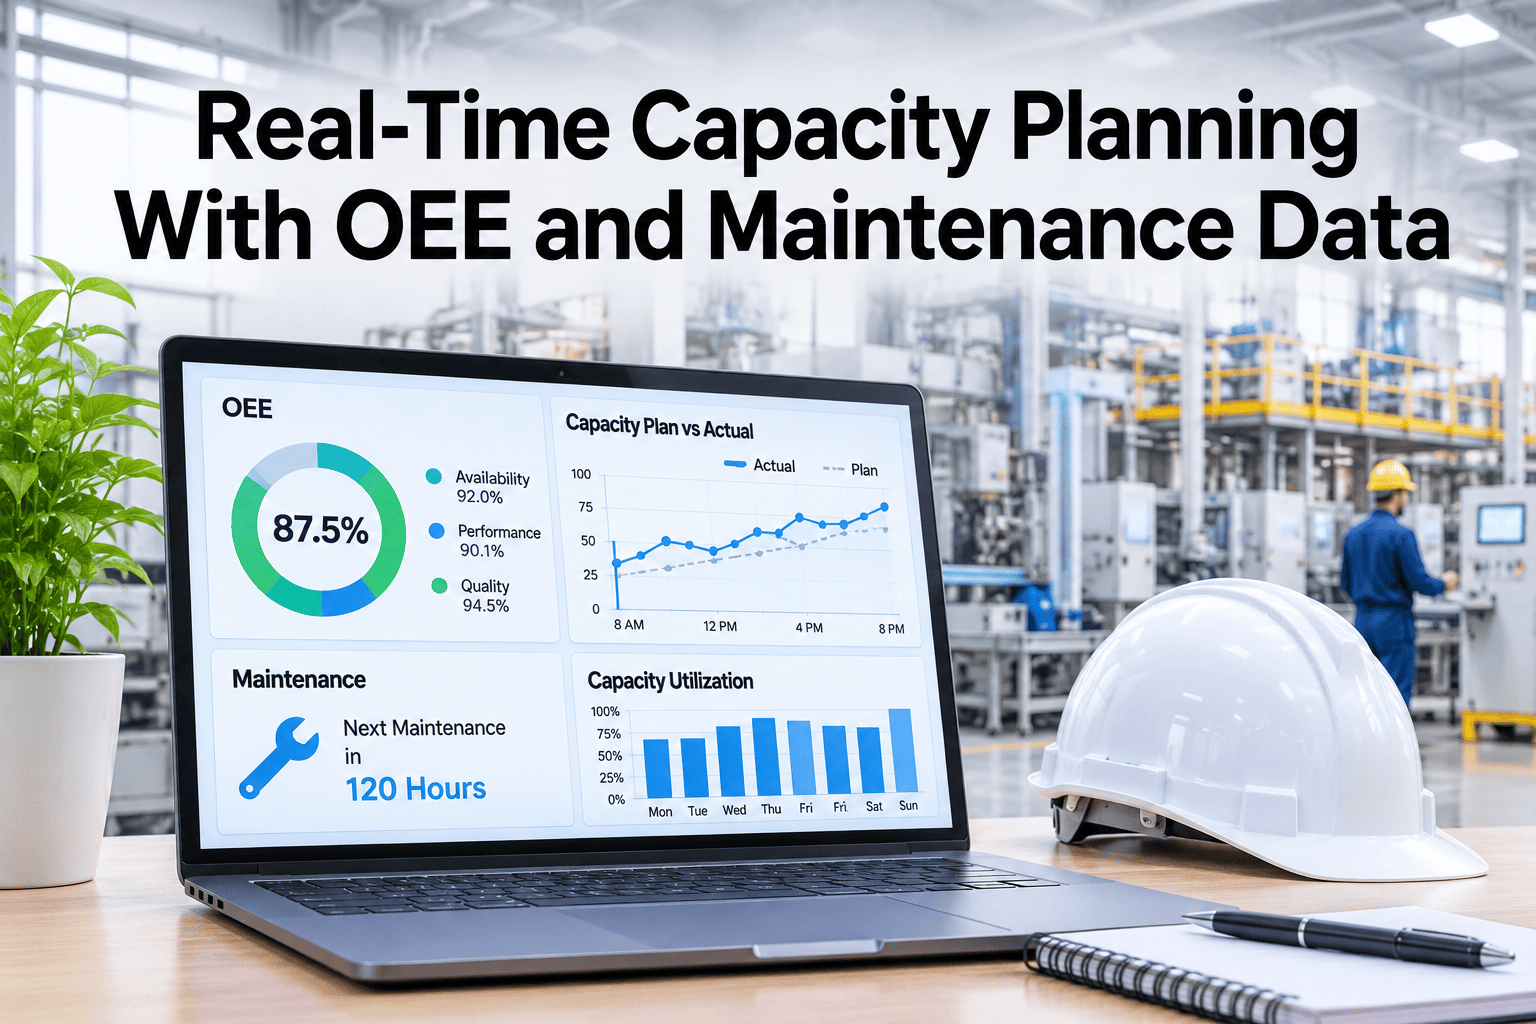
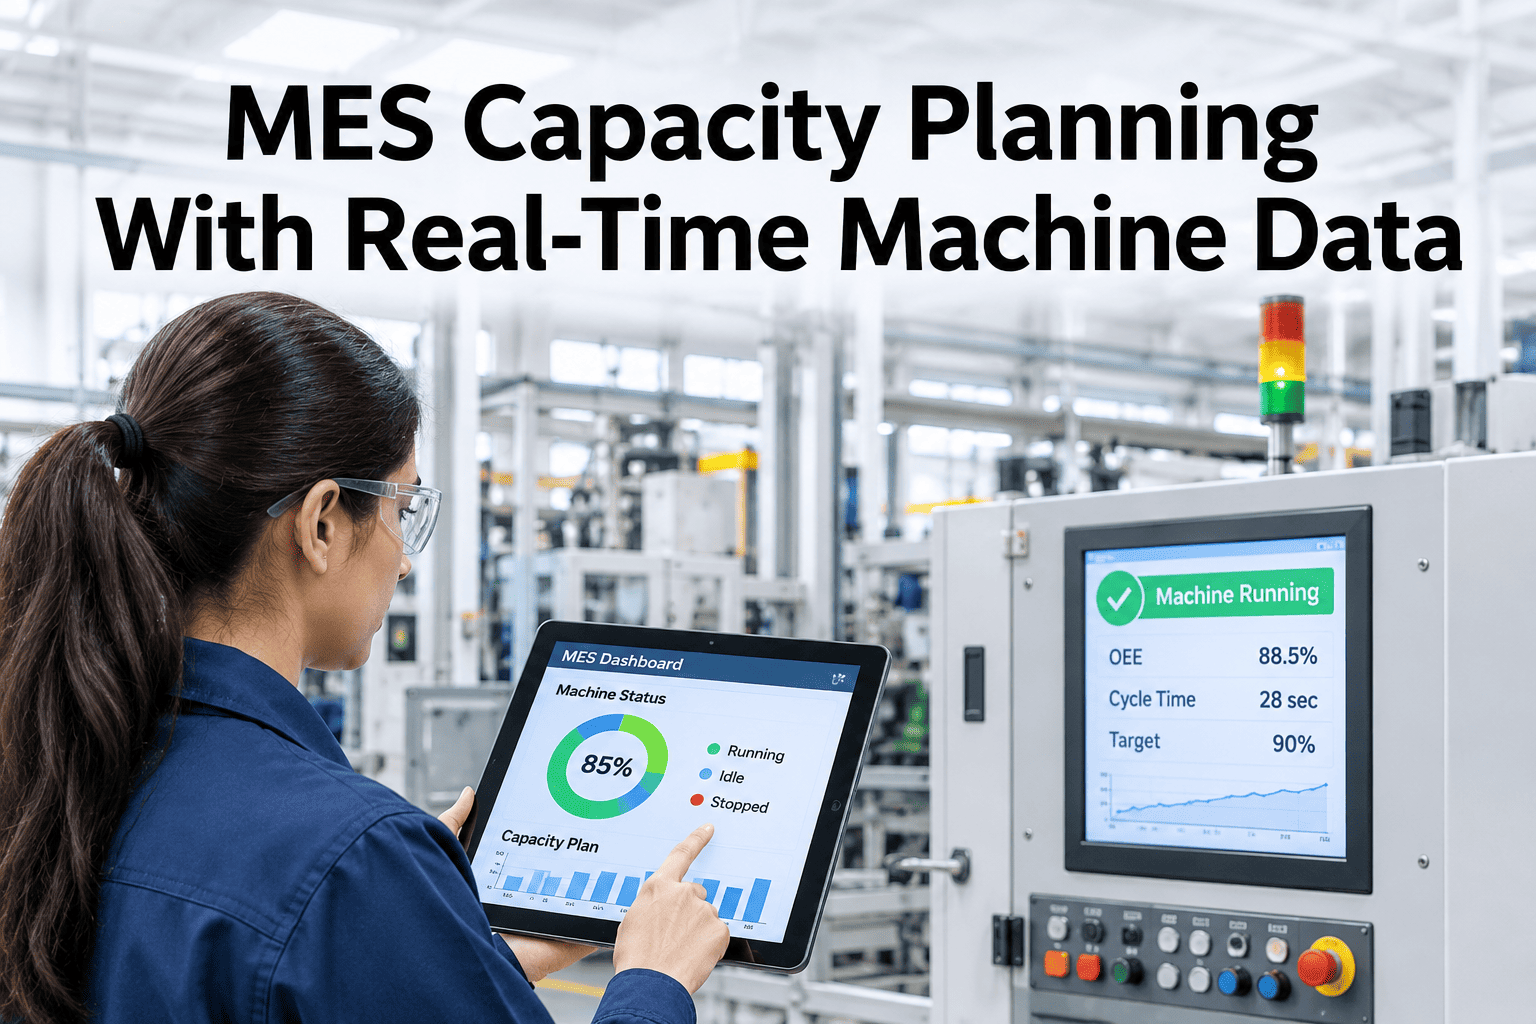
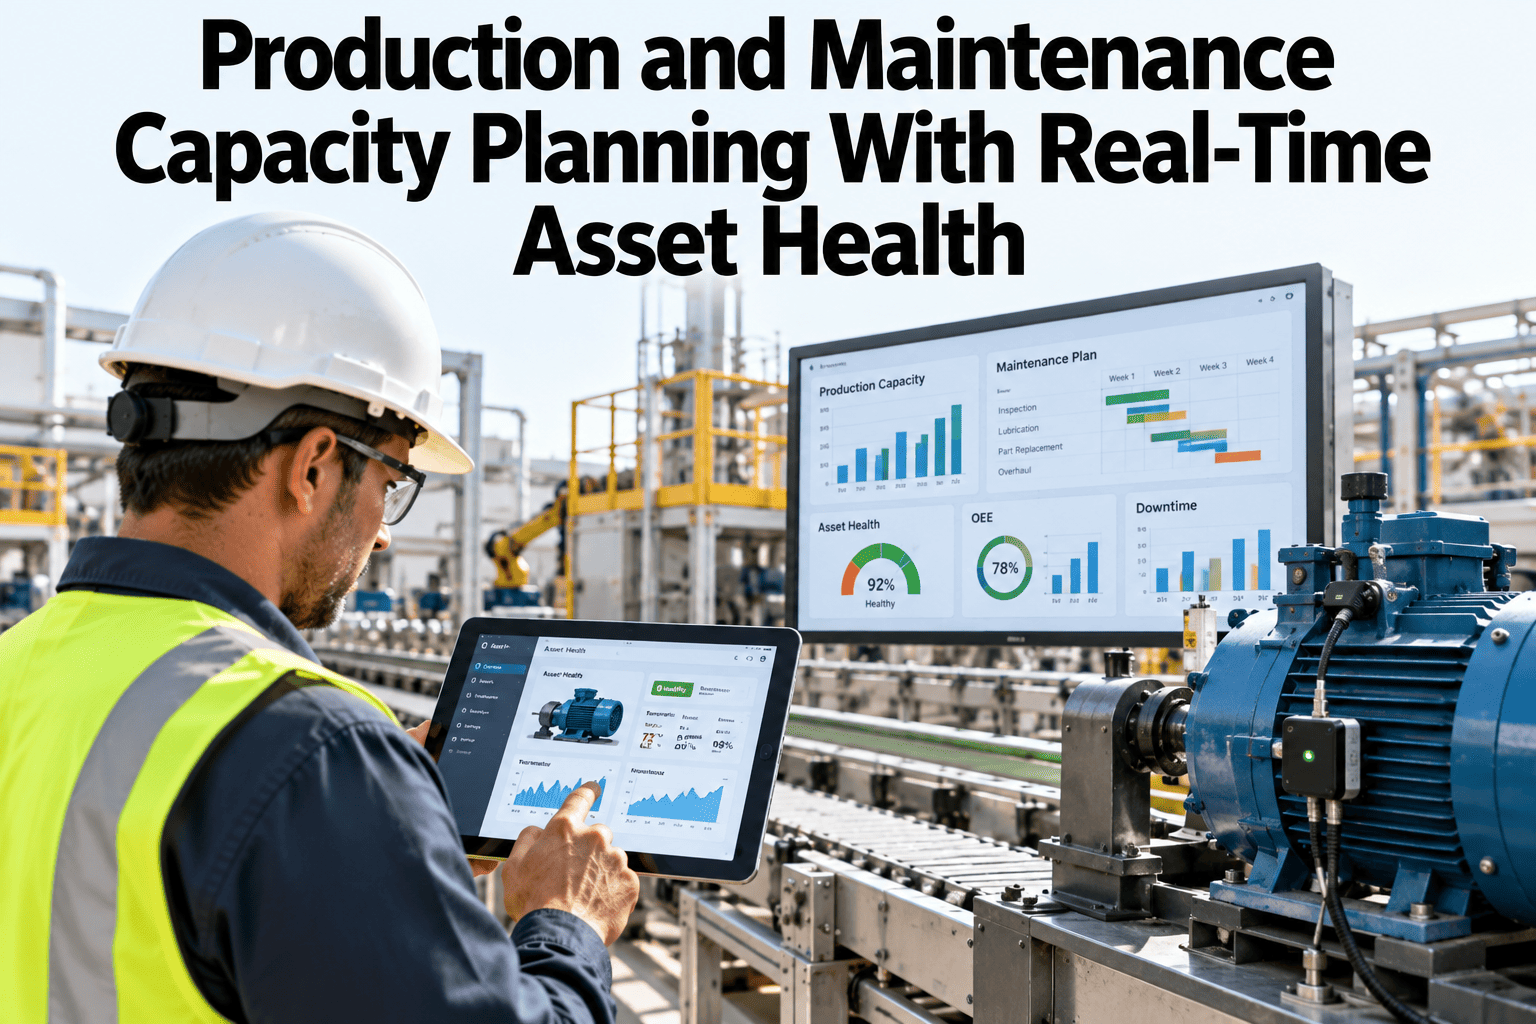
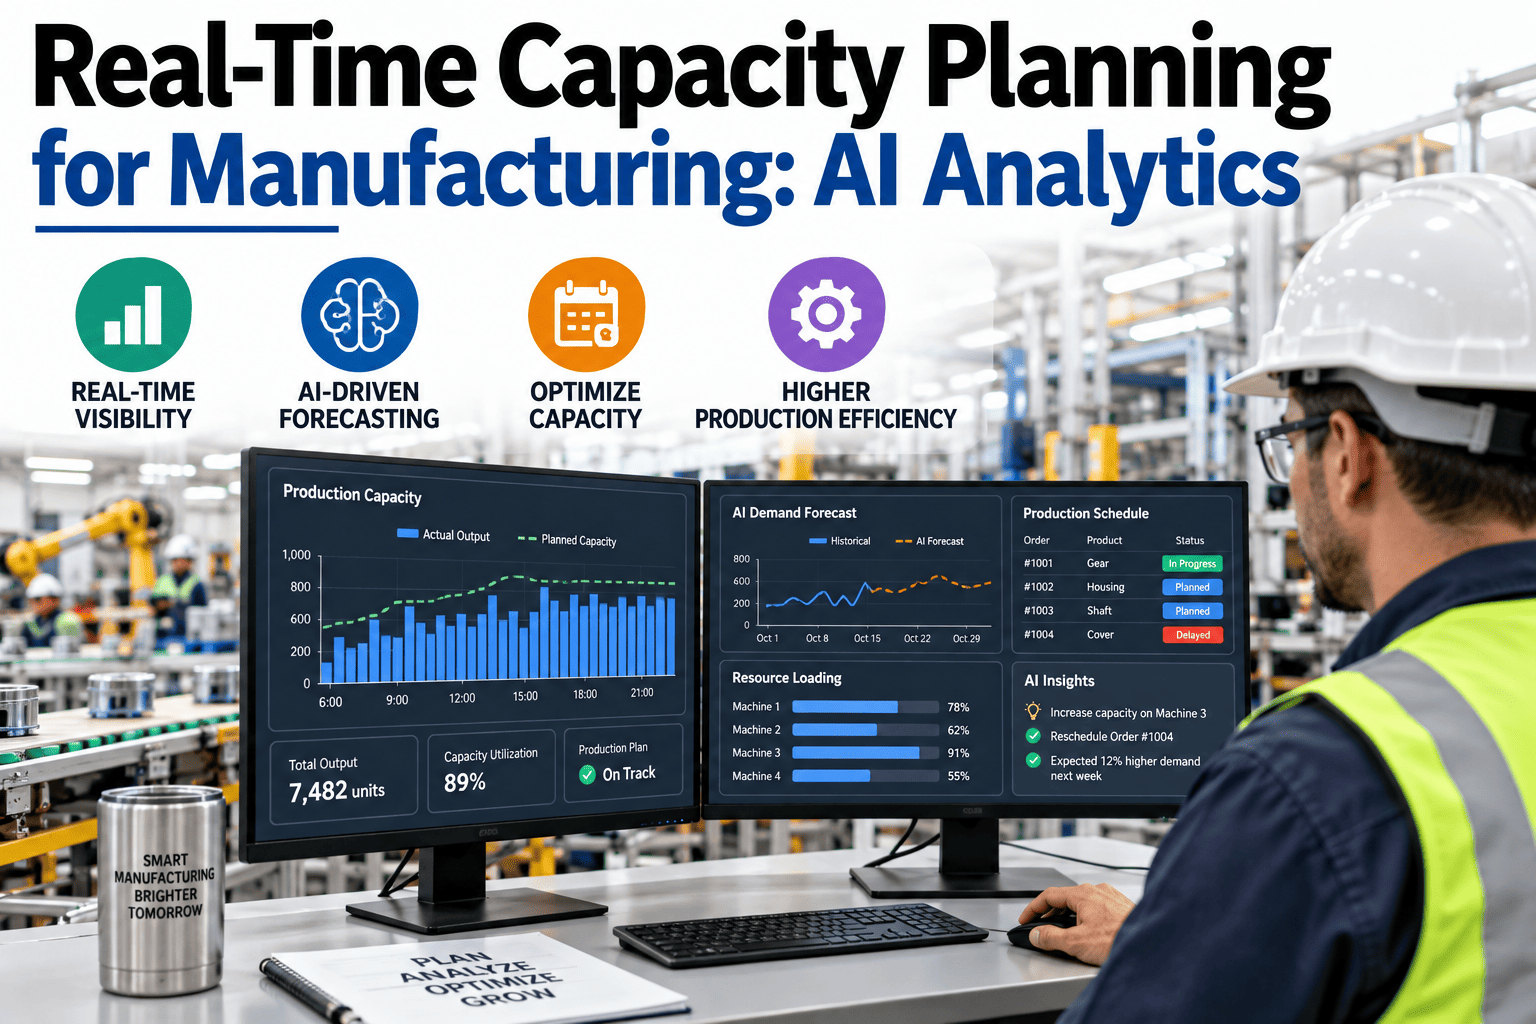
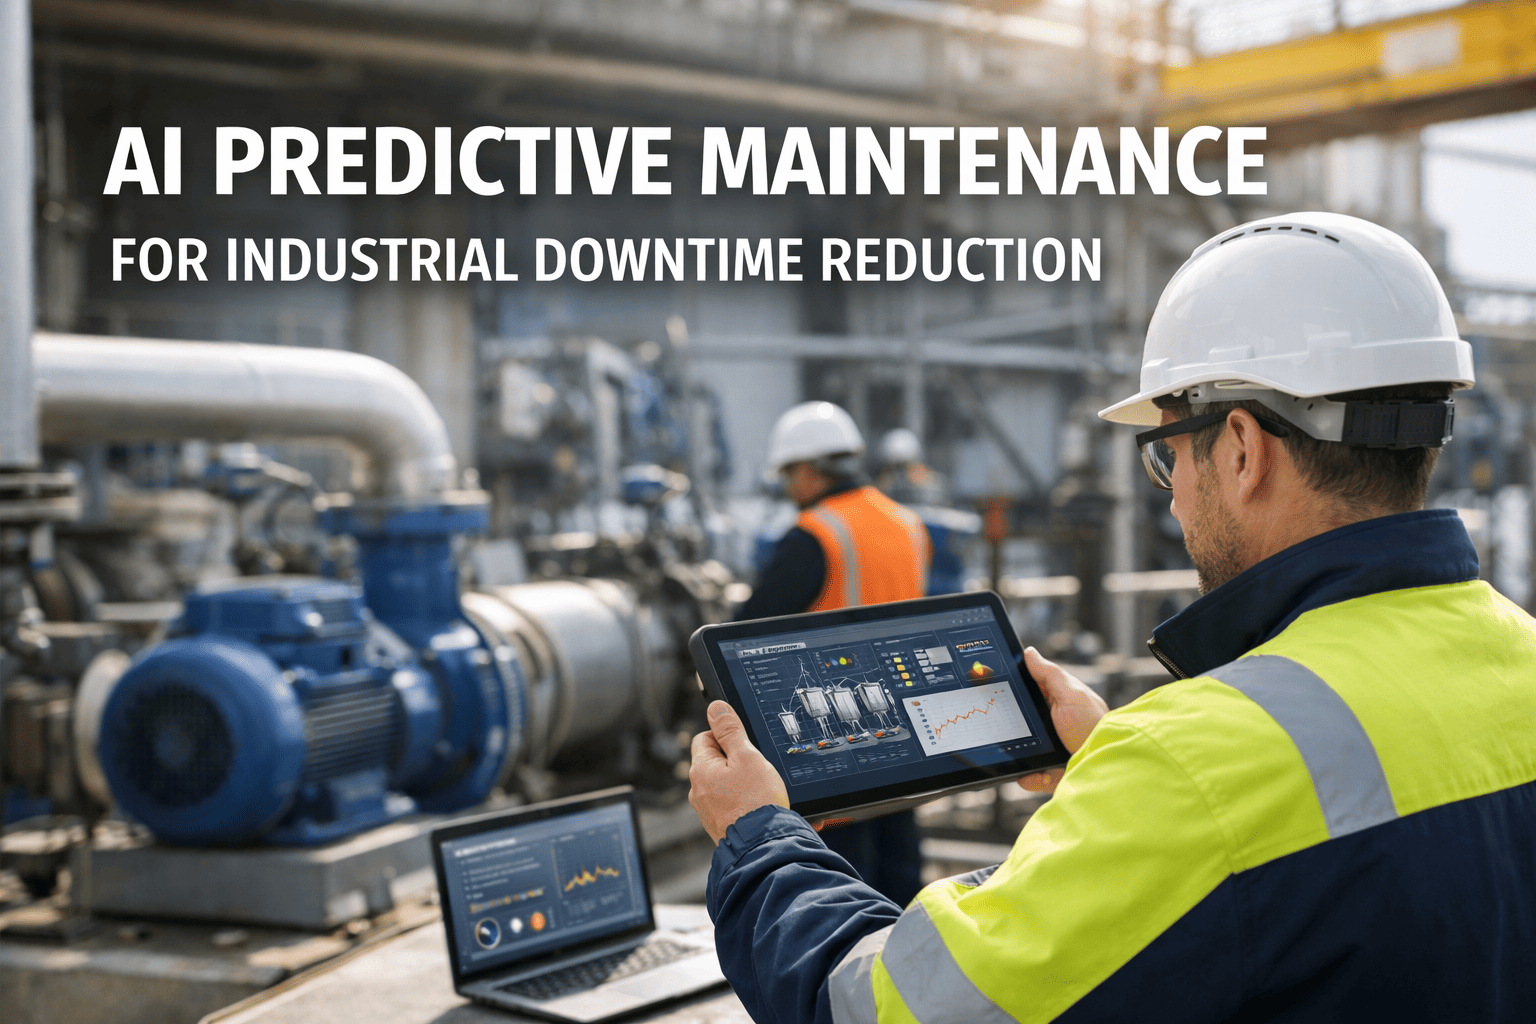
OEE tells you how a machine performed. Maintenance data tells you what's coming next. Neither one alone gives a planner the full picture, but combined they turn a capacity plan into something grounded in both recent performance and known upcoming risk. iFactory, an on-premise AI platform with OEE analytics and predictive maintenance built in, merges both into a single capacity view. Planning and operations teams who want this combined view can discuss their plant data and use case with our team.
Real-Time Capacity Planning · OEE + Maintenance, 2026
Performance History Tells You the Past. Maintenance Data Tells You What's Coming.
iFactory AI combines OEE trends with maintenance condition data, so a capacity plan accounts for both how a machine has run and what risk sits ahead of it.
OEE history
Maintenance risk
Real-world
capacity
Why one data source isn't enough
OEE Alone Is Backward-Looking
A strong trailing OEE number says nothing about a bearing that's three weeks from a scheduled replacement, or a die approaching its wear limit. A capacity plan built purely from historical OEE trends treats every machine as if its recent past will simply continue, which is exactly the assumption maintenance data exists to challenge.
What each data source contributes
Two Data Sets, Two Different Questions
| Data source | Question it answers | Limitation alone |
|---|
| OEE history | How has this machine actually performed recently? | Says nothing about upcoming known risk |
| Maintenance condition data | What risk is building toward a future failure? | Says nothing about current throughput reality |
| Combined view | What can this machine realistically deliver, accounting for both? | Requires both data sets reliably connected |
What combining them enables
Three Planning Decisions That Need Both
Scheduling around a maintenance window
A planned PM is treated as a hard capacity constraint, not an afterthought.
Flagging a declining machine early
A machine whose OEE is holding steady but whose condition data is trending worse gets flagged before output actually drops.
Choosing between candidate lines
A line with slightly lower trailing OEE but no near-term maintenance risk may be the safer capacity bet.
See What Combined OEE and Maintenance Data Would Show on Your Lines
Share your current OEE trends and maintenance schedule, and iFactory AI will show where the two data sets agree, and where they tell a different story.
When the two data sets disagree
The Most Useful Signal Is Often the Disagreement
A machine with strong OEE history and rising maintenance risk is a different planning problem than a machine with weak OEE but a clean maintenance outlook — the first needs a near-term schedule adjustment before a failure happens, while the second is a longer-running performance issue to address separately. Treating both the same way, as a single blended score, would hide exactly the distinction that matters most for scheduling decisions.
Building the combined view
Four Steps to Get OEE and Maintenance Data Working Together
1
Connect both data sources
OEE reporting and maintenance condition or CMMS data feed into one shared capacity model.
2
Align by asset and time
Both data sets need to reference the same machine and overlapping time windows to be comparable.
3
Flag disagreements
Machines where the two signals point in different directions surface as planning priorities.
4
Update the capacity plan
The combined view feeds directly into the schedule, not just a reporting dashboard nobody checks.
Expert review
What a Capacity Planner Checks First
A combined OEE and maintenance capacity view earns trust when it genuinely changes a scheduling decision, not just when it adds another dashboard to the pile.
Verdict
Strong when disagreements between the two data sources are surfaced explicitly, not averaged away into one number.
Watch for
Maintenance condition data that's updated far less frequently than OEE, creating a misleadingly stale risk picture.
Do next
Pick one high-volume machine and compare its last 90 days of OEE trend against its maintenance condition history side by side.
Frequently asked questions
What Planners Ask About Combined OEE and Maintenance Planning
Why isn't OEE history enough on its own for capacity planning?
OEE is backward-looking by nature — it describes how a machine has performed, not what maintenance risk might be building toward a near-term change in that performance.
Discuss this gap for your own lines.
What maintenance data specifically feeds into this?
How do we handle a machine where the two signals disagree?
A disagreement between strong OEE history and rising maintenance risk, or the reverse, is flagged explicitly as a planning priority rather than blended into a single misleading score.
Talk through how disagreements are handled.
Does this require our OEE and CMMS systems to be the same platform?
No — the two data sources can remain in separate systems as long as they're connected and aligned by asset and time window for the combined capacity view to work.
Discuss connecting your current systems.
How often should the combined capacity view be refreshed?
Refresh frequency depends on how current each underlying data source is — a plan is only as fresh as its slowest-updating input, so closing that gap often matters more than increasing refresh frequency on the faster one.
Discuss refresh frequency for your systems.
Plan on performance and risk together
Combine OEE and Maintenance Data Into One Capacity View
Book a session with iFactory AI to see what a combined OEE and maintenance picture reveals for your lines.