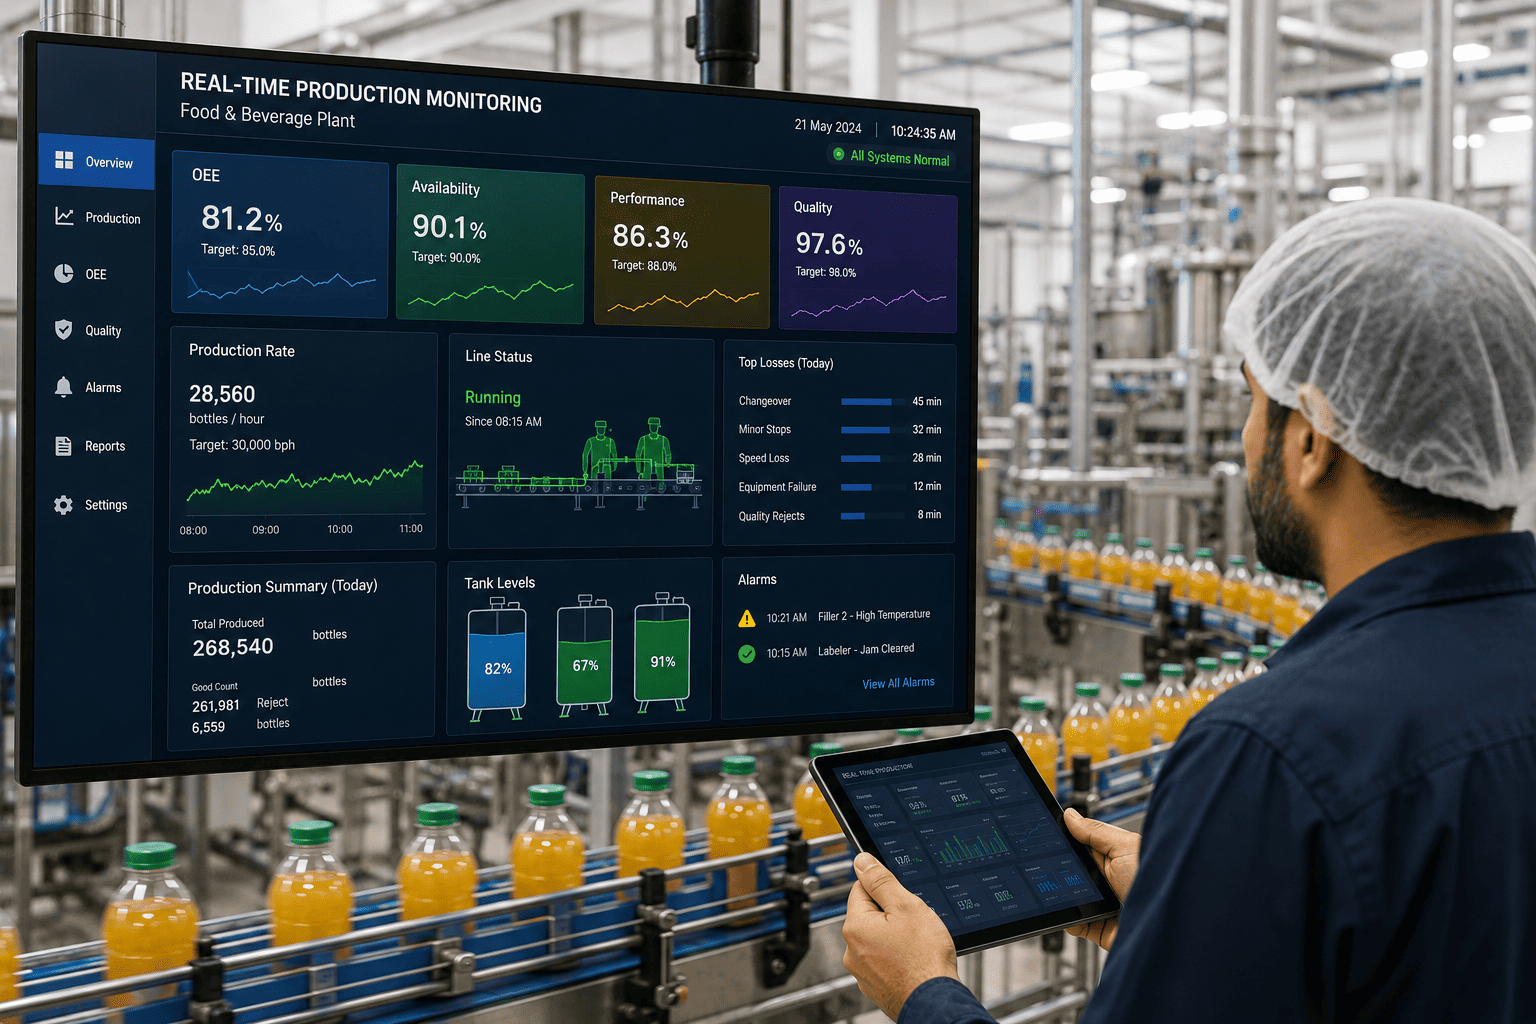
On a high-speed PET bottling line rated for 72,000 units per hour, a single 90-second micro-stop every cycle translates into roughly 1,800 bottles of lost throughput per hour — yet most plant floors only log it as "line stopped, reason unknown." Across an eight-hour shift, those invisible micro-stops, minor speed losses, and changeover overruns quietly erode Overall Equipment Effectiveness by 15 to 25 points while the downtime report still reads green. iFactory captures availability, performance, and quality at machine-signal resolution, then uses AI to attribute every lost second to a root cause — so operations leaders stop chasing averages and start eliminating the specific losses dragging each line down.
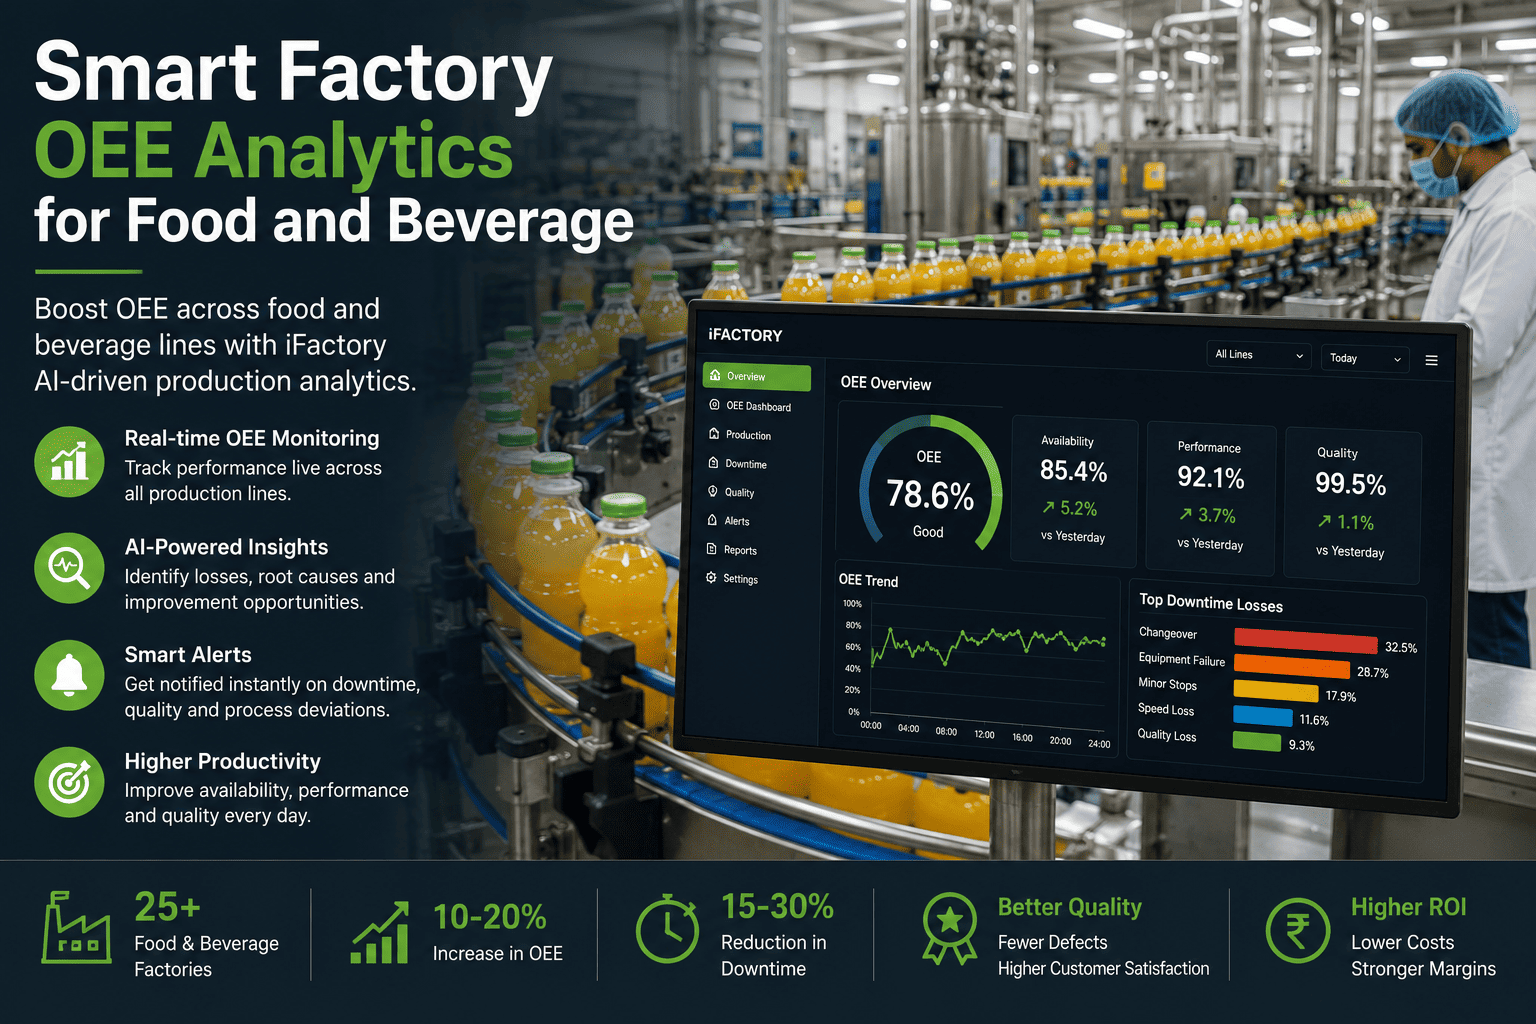
OEE ANALYTICS FOR FOOD & BEVERAGE
See every hidden loss on your filling, packaging, and processing lines — in real time.
iFactory's AI-driven production analytics platform captures availability, performance, and quality at machine-signal resolution, pinpoints the exact losses dragging each line down, and benchmarks every line, plant, and SKU against target. Delivered on a pre-configured NVIDIA AI server, racked and ready — live in 6 to 12 weeks.
Overall Equipment Effectiveness is the product of Availability, Performance, and Quality. A line can look healthy on one axis while bleeding cash on another. Below: a typical beverage line at 62% OEE, decomposed into the three contributing losses.
AVAILABILITY
78%
22% lost to changeovers, sanitation cycles, unplanned stops, and micro-stops the MES never captured.
PERFORMANCE
85%
15% lost to minor speed drops, filler jam-clears run below nameplate, and ramp-up lag after changeover.
QUALITY
94%
6% lost to underfill rejects, label skew, seal-integrity failures, and startup scrap after format change.
COMPOSITE OEE
0.78 × 0.85 × 0.94
62%
World-class is 85%. This line is leaving 23 points on the table — and most of it is invisible to the shift report.
Where the losses hide: a 480-minute shift, dissected.
A single eight-hour shift on a high-speed filling line contains 28,800 seconds. iFactory attributes every one of them. The timeline below maps one real shift — the green is productive runtime, the purple bands are the seven distinct loss categories the AI isolated and quantified.
0 min120240360480 min
Productive run
Changeover
Sanitation / CIP
Micro-stops
Speed loss
Quality reject
336 min
productive runtime
144 min
attributed loss
7
distinct loss categories isolated
Micro-stops: the loss your MES was built to ignore.
Most SCADA and MES systems apply a 2- to 5-minute deadband — any stop shorter than the threshold is folded into "running" and averaged away. On a filler cycling at 1,200 units per minute, a 45-second jam-clear happens below the threshold but above the loss radar. iFactory reads the machine signal directly, so no stop is too small to attribute.
TRADITIONAL MES VIEW
Reported OEE: 91%. Reality: 73%. The 18-point gap is buried inside the deadband.
iFactory AI
IFACTORY SIGNAL VIEW
Each purple gap is a sub-threshold stop, classified by cause: jam-clear, sensor fault, label splice, cap feeder empty.
Changeover and sanitation: the 40-minute swing nobody optimizes.
On a multi-SKU dairy line running 8 to 12 changeovers per day, a 10-minute variance per changeover compounds into over an hour of lost availability daily. iFactory breaks every changeover into discrete sub-steps, benchmarks them against the best-observed cycle, and surfaces exactly which phase is drifting.
CHANGEOVER SUB-STEP
DURATION (MINUTES)
GAP
Line stop & product clear-out
4 min
7 min
+3
Format parts swap (guides, star wheels)
5 min
6 min
+1
CIP / sanitation cycle
8 min
10 min
+2
Re-thread & label splice
3.5 min
8.5 min
+5
First-article check & ramp to speed
4.5 min
7.5 min
+3
TOTAL CHANGEOVER
Best observed: 25 min
Actual: 39 min
+14 min per cycle
At 10 changeovers/day, that is 140 minutes of lost availability — the equivalent of one full production run.
iFactory's AI isolates the re-thread phase as the biggest dragger and prescribes a standardized splice sequence that closes 5 of the 14 minutes. Book a demo to see your changeover heatmap.
Benchmark every line, plant, and SKU against target.
Averages lie. Line A at 71% OEE might be your best performer if its product mix is heavy on low-speed SKUs. iFactory normalizes for SKU complexity, format, and shift, then ranks lines on a like-for-like basis. The heatmap below shows six lines across two plants, graded by OEE gap to target.
Plant 1 — Line A
Plant 1 — Line B
Plant 1 — Line C
Plant 2 — Line D
Plant 2 — Line E
Plant 2 — Line F
Shift 1
+3
-5
-12
+1
-18
-7
Shift 2
-4
+2
-14
-6
-11
0
Shift 3
+1
-10
-20
-5
-16
-13
OEE gap to target (percentage points)
+3
-5
-12
-20
at/above targetcritical gap
AI insight: Plant 2 Line E is 18 points below target on Shift 3 — the worst cell in the network. Root cause: sanitizer cycle overruns during the overnight crew. Targeted intervention recovers 11 points.
Ask the line why it slowed. Get an instant answer.
Operations leaders should not need to pull a report, open a historian, and cross-reference a shift log to understand a 4% speed drop. iFactory's operator-to-AI chat sits on top of the full signal layer — ask in plain language, get a attributed answer in seconds.
OP
Why did Line C drop 4% below target between 14:00 and 16:00 today?
AI
Line C ran 4.2% below target from 14:00–16:00. Three contributing losses, ranked by impact:
Cap feeder starvation — 9 micro-stops totaling 6.8 min. Hopper refill cycle was set 40s too long.
Filler speed derate — 2.1% below nameplate for 38 min after a jam-clear at 14:12. Operator did not re-ramp to full speed.
Label splice delay — 2 manual splices at 15:05 and 15:42, each causing 90s of slow-mode.
Recommended fix: adjust cap feeder refill timer from 180s to 140s. Projected recovery: 3.1 percentage points of OEE.
OP
Show me the same window for Line A so I can compare.
AI
Line A ran 1.2% above target in the same window. Primary difference: Line A's cap feeder timer is already set to 135s and its post-jam ramp is automated. The 5.4-point gap between Line A and Line C is almost entirely attributable to those two parameters.
From signal to insight: the iFactory architecture.
iFactory reads machine signals directly from PLCs, SCADA tags, and MES events — no manual data entry, no clipboard reconciliation. Everything runs inside your plant network on a pre-configured NVIDIA AI server. No production data leaves your firewall.
Signal capture
PLC, SCADA, and MES tags ingested at 100ms resolution. No deadband. No manual entry.
Loss attribution
AI classifies every stop, speed drop, and reject into a loss category and root cause.
OEE calculation
Automated, continuous OEE across every line, shift, SKU, and plant — normalized for product mix.
Benchmark & prescribe
Lines ranked against target and best-observed. AI prescribes the specific fix for the biggest gap.
Pre-configured NVIDIA AI server, racked and ready. The entire pipeline — signal capture, loss attribution, OEE calculation, benchmarking, and the operator chat — runs on a single appliance inside your plant network. No cloud dependency. No data egress. 99.9% uptime.
Live in 6 to 12 weeks: the three-phase roadmap.
No multi-year integration project. iFactory deploys in three phases, each delivering measurable value before the next begins.
01
Signal connection & baseline
Weeks 1–4
PLC and SCADA tags mapped, MES events integrated, NVIDIA server racked in your data center. Baseline OEE established per line with full loss attribution.
Deliverable: live OEE dashboard, loss waterfall per line
02
AI tuning & benchmarking
Weeks 3–8
Loss-classification models tuned to your equipment and product mix. Cross-line, cross-plant, and cross-SKU benchmarking live. Changeover and sanitation heatmaps delivered.
Food-safety constraints, respected — not bypassed.
Every optimization iFactory recommends is filtered through the food-safety and quality constraints that govern your lines. The AI will never recommend a speed increase that compromises seal integrity, a sanitation-cycle reduction that risks ATP test failure, or a changeover shortcut that creates allergen cross-contact risk.
WITHOUT iFACTORY
Speed pushed to nameplate regardless of fill-weight variance. Seal failures spike. Quality rejects absorb the availability gain.
iFactory
WITH iFACTORY
Speed ceiling dynamically set by real-time fill-weight SPC. Throughput optimized up to the quality constraint — never past it.
WITHOUT iFACTORY
Sanitation cycle treated as fixed. Overruns accepted as unavoidable. CIP chemical use never questioned.
iFactory
WITH iFACTORY
Sanitation cycle duration tuned to soil-load signal and ATP history. Recovery time reclaimed only when test history supports it.
WITHOUT iFACTORY
Changeover sequence optimized for speed alone. Allergen changeover verification treated as a fixed time block.
iFactory
WITH iFACTORY
Allergen-changeover sub-steps sequenced for both speed and verification completeness. Push-out and flush phases tuned to product allergen profile.
Frequently asked questions.
How does iFactory capture data without replacing our existing PLCs or SCADA?
iFactory connects to existing OPC-UA, Modbus, or MQTT endpoints on your PLCs and SCADA — no hardware replacement. The NVIDIA AI server sits inside your plant network and reads tags at 100ms resolution. Typical integration takes 2 to 4 weeks depending on tag count.
Can the system handle multi-SKU lines with frequent changeovers?
Yes. iFactory normalizes OEE for SKU complexity, format, and product mix, so lines running difficult low-speed SKUs are benchmarked fairly against lines running high-volume standard SKUs. Changeover sub-steps are tracked per SKU family.
Does the AI ever override food-safety or quality constraints?
No. Every prescriptive recommendation is filtered through configurable safety and quality guardrails. The AI will not recommend a speed increase that violates fill-weight SPC, a sanitation reduction that risks ATP failure, or a changeover shortcut that creates allergen cross-contact risk.
What does the operator-to-AI chat actually answer?
Any question about line performance, downtime cause, speed loss, quality rejects, or benchmark comparison — asked in plain language. The AI responds with attributed root causes ranked by impact, plus a recommended fix. It draws on the full signal history for every line.
How is this different from the OEE module in our MES?
Most MES OEE modules rely on manual downtime entry and a 2- to 5-minute deadband, which hides micro-stops and minor speed losses. iFactory reads the machine signal directly, attributes every lost second automatically, and adds the AI benchmarking and prescriptive layer that MES systems do not provide.
What is the typical OEE lift after deployment?
Food and beverage clients typically see 5 to 12 percentage points of OEE lift within the first 90 days of full deployment, driven primarily by micro-stop recovery, changeover optimization, and post-jam ramp automation. Results vary by line type and starting OEE.
STOP CHASING AVERAGES
Find the 14 minutes hiding in every changeover.
Book a 30-minute demo and we will build a live OEE loss waterfall for one of your lines — using your own signal data — before you commit to anything.


.jpeg)

