A boiler tube fails, and the post-mortem almost always finds the same thing: the chemistry was telling the story for weeks before the metal gave way. A cation conductivity reading nudging up. Dissolved oxygen creeping past a few parts per billion. Silica trending toward the limit, sample after sample, each one technically "in spec" and each one a little worse than the last. Every one of those numbers passed the lab. What nobody did was look at them together, as a moving picture, against limits that meant something. That is the gap statistical quality control closes — and an iFactory analytics layer is where the lab bench finally becomes a live early-warning system for the water-steam cycle.
iFactory · Power Plant Water Chemistry
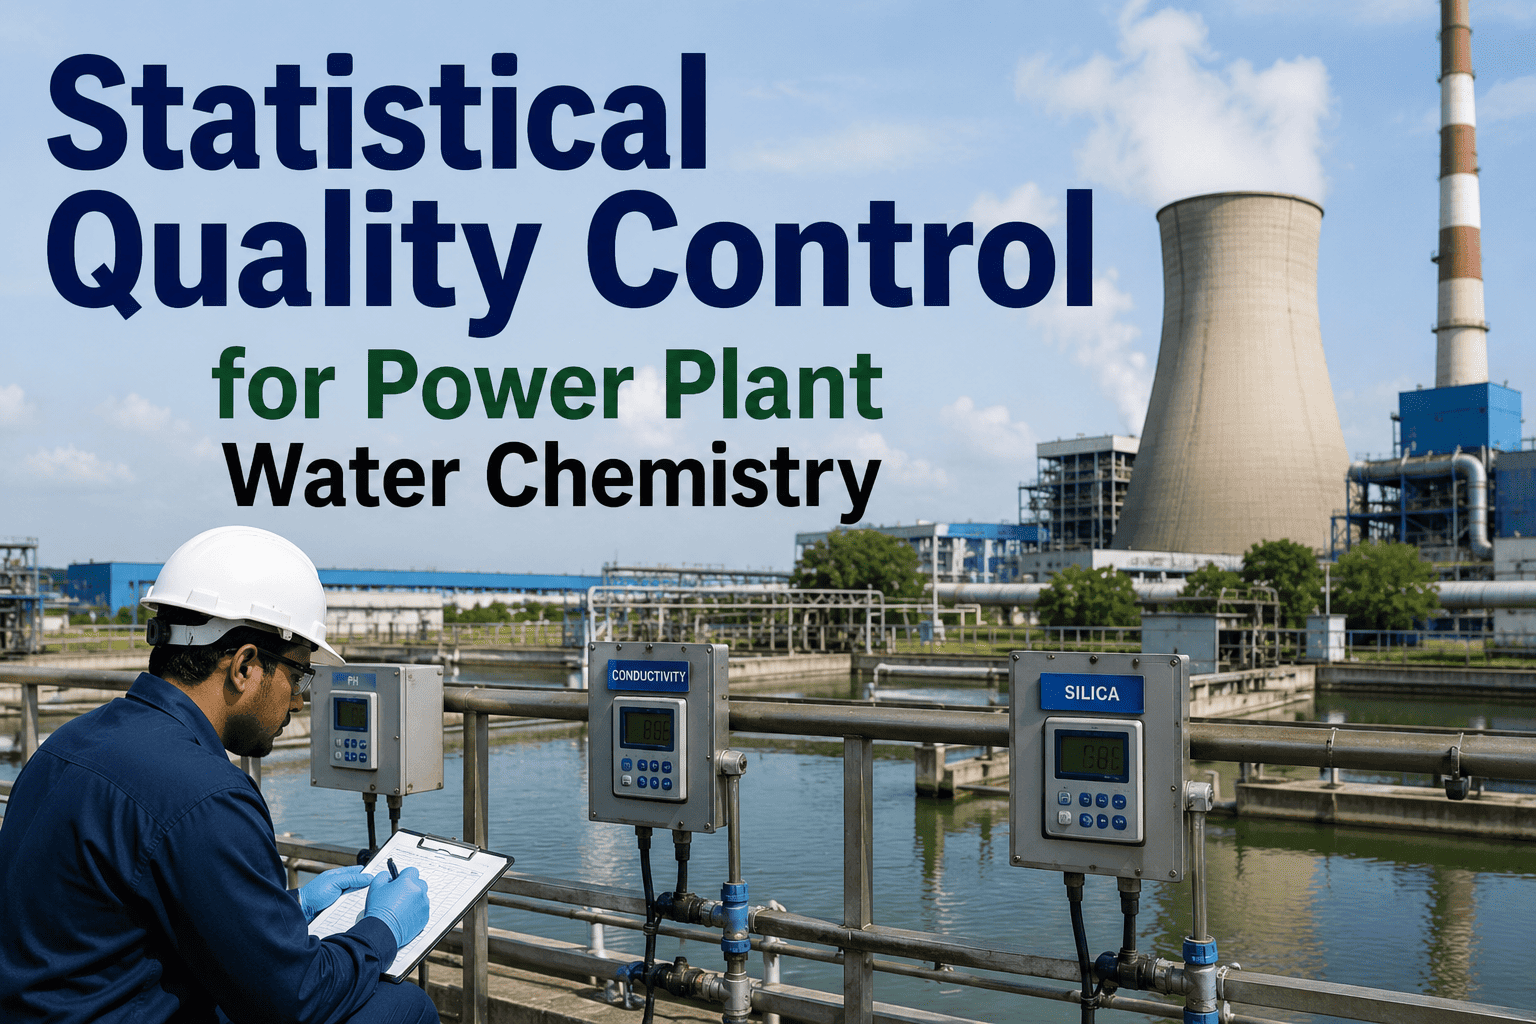
SQC: Turning Lab Chemistry Data Into Real-Time Cycle Protection
Water chemistry is the silent driver of boiler reliability. Statistical quality control takes the numbers your lab already produces and turns them into trends, action levels, and decisions — catching the corrosion and scale story long before a tube ever leaks.
<5 ppb
EPRI fossil feedwater dissolved oxygen target
<0.02 ppm
silica limit for high-pressure boilers
~9.0
feedwater pH target band
ppb
the scale at which damage begins
Why Chemistry Is the One Variable That Quietly Decides Reliability
You cannot see water chemistry from the control room the way you see megawatts or steam temperature. It hides in parts per billion, measured by a lab and a steam-and-water analysis system, and it does its damage slowly — pitting, stress corrosion cracking, deposits that thin a tube wall over months. By the time chemistry shows up as a forced outage, it has been off for a long time. The numbers were there. What was missing was a method that reads a stream of lab results as evidence rather than as a series of isolated pass/fail checks. That method is SQC: it treats every sample as one more data point in a trend, judged against limits that signal danger while there is still time to dose, blow down, or hunt the leak.
First, the Distinction That Matters: SQC vs SPC
People use the two acronyms interchangeably, but for a chemistry lab the difference is the whole point. One watches the process happen in real time. The other judges the results the process produced — which is exactly what a chemistry program does.
SPC
Statistical Process Control
Watches process inputs in real time, to prevent a defect while it is forming
Think: continuous steam-temperature or excess-O2 control during the run.
SQC
Statistical Quality Control
Judges measured outputs — the lab results — and feeds forward to guard against catastrophic failure
Think: trending sampled pH, conductivity, DO, and silica against action levels.
SQC is the broader discipline of using statistics on measured results: control charting, trending, and acceptance against defined limits. It is exactly the right tool for water chemistry, because chemistry is sampled and tested, not continuously controlled from a setpoint. The lab produces a result; SQC decides what that result means in the context of every result before it.
The Five Numbers That Tell the Whole Story
A water-steam cycle has dozens of measurable parameters, but a handful carry most of the reliability signal. Each one is a different failure mode wearing a different number — and each one is a textbook candidate for an SQC chart with tiered action levels.
Cation Conductivity
Tells you: ingress of corrosive anions
A rise can signal a condenser tube leaking cooling water into the cycle
Dissolved Oxygen
Tells you: corrosion risk in feedwater
Creep above a few ppb points to air in-leakage or scavenger shortfall
pH
Tells you: the acid-base balance protecting the metal
Drift off the ~9.0 band exposes surfaces to acidic or caustic attack
Silica
Tells you: turbine deposit and scale risk
A trend toward the limit forecasts carryover and blade deposits
Sodium
Tells you: contamination breaking through
Single-digit-ppb shifts flag makeup or condenser ingress early
The pattern
Read together, not alone
SQC is what connects five drifting numbers into one diagnosis
Want these five parameters charted live against your own action levels? Talk to a chemistry analytics specialist and we will map them to your SWAS and lab tags.
Action Levels: The Idea That Makes Chemistry Data Actionable
Here is the heart of an SQC chemistry program. A single spec limit gives you only a binary — pass or fail — and by the time you fail, damage is already happening. Action levels replace that with a graduated ladder. Each rung means something specific, and each one buys time. The chart below shows how a parameter like cation conductivity moves up through the levels, and what the program does at each one.
Process is healthy. Keep sampling at routine cadence. Nothing to do.
A real shift detected. Increase sampling frequency, investigate the cause, prepare to correct.
Material risk to the cycle. Take corrective action now — dose, blow down, isolate the source.
Continued operation damages the unit. Reduce load or shut down per the chemistry procedure.
From Lab Bench to Decision: The SQC Loop
SQC is not a report that gets filed. It is a loop that runs every time a sample comes back, turning a lab number into a control-room decision before the next shift even starts.
1
Sample
SWAS and grab samples pull from defined points across the cycle on a set schedule.
2
Measure
The lab and online analyzers return the numbers — conductivity, DO, pH, silica, sodium.
3
Chart
Each result lands on its control chart, plotted against the trend and the action levels.
4
Judge
Is it noise, or a real trend crossing a level? The chart, not a single value, decides.
5
Act
Trigger the matching response — dose, blow down, find the leak — and verify on the next sample.
What a Plant Gains When It Charts Instead of Checks
The difference between a pass/fail logbook and an SQC program is not paperwork — it is how early the plant sees trouble and how confidently it acts.
Logbook of pass/fail readings
becomes
A moving picture of cycle health
"In spec today" with no context
becomes
A trend you can see climbing toward a limit
React only when a sample fails
becomes
Act at Action Level 1, with time to spare
Corrosion found at the next outage
becomes
Ingress caught the shift it started
Want to see your chemistry logbook turned into live SQC charts? Book a demo and we will build it on your historian and LIMS data.
Frequently Asked Questions
Is SQC different from the chemistry limits we already track?
Yes, and the difference is the whole value. Your limits give a pass/fail verdict on each sample in isolation. SQC plots every result on a control chart, so you see the trend — a parameter can pass every single check while marching steadily toward its limit. SQC catches that march; the pass/fail check only catches the arrival.
Why SQC for chemistry and not SPC?
Because chemistry is sampled and tested rather than continuously driven from a setpoint. SPC controls process inputs in real time to prevent a defect forming; SQC applies statistics to measured outputs — the lab results — and feeds forward to guard against failure. A water chemistry program is fundamentally about judging results, which is SQC's home ground.
What are action levels, and who sets them?
Action levels are a tiered ladder of limits — typically Normal through Action Levels 1, 2, and 3 — where each rung triggers a defined response, from increased sampling up to load reduction. Industry guidance such as the EPRI cycle chemistry guidelines provides the framework; each plant tunes the specific values to its design, materials, and pressure.
Which parameters should a plant chart first?
Start with the ones that carry the most failure signal: cation conductivity for contamination ingress, dissolved oxygen for feedwater corrosion, pH for the protective balance, and silica for turbine deposits. Sodium is a strong early indicator of breakthrough. These few cover the dominant corrosion, scale, and carryover mechanisms.
Do we need new analyzers to implement SQC?
Usually not. The data already exists — in your SWAS, your online analyzers, and your lab records. SQC is about pulling those numbers together at a consistent cadence, charting them against action levels, and putting the trend in front of the chemist and the control room. An analytics layer over your existing LIMS and historian is typically where plants begin.
Stop reading chemistry one sample at a time.
See Your Water Chemistry as a Live SQC Dashboard
Bring one parameter — cation conductivity, dissolved oxygen, silica. We will pull it from your SWAS, online analyzers, or lab records, plot it as a control chart against tiered action levels, and show you the trend your logbook has been hiding. Turnkey analytics over your existing data: pre-configured, integrated to your historian and LIMS, live in weeks not quarters.
5
parameters that carry the signal
4
action levels, not one pass/fail
ppb
resolution where damage starts
Weeks
to live on your LIMS