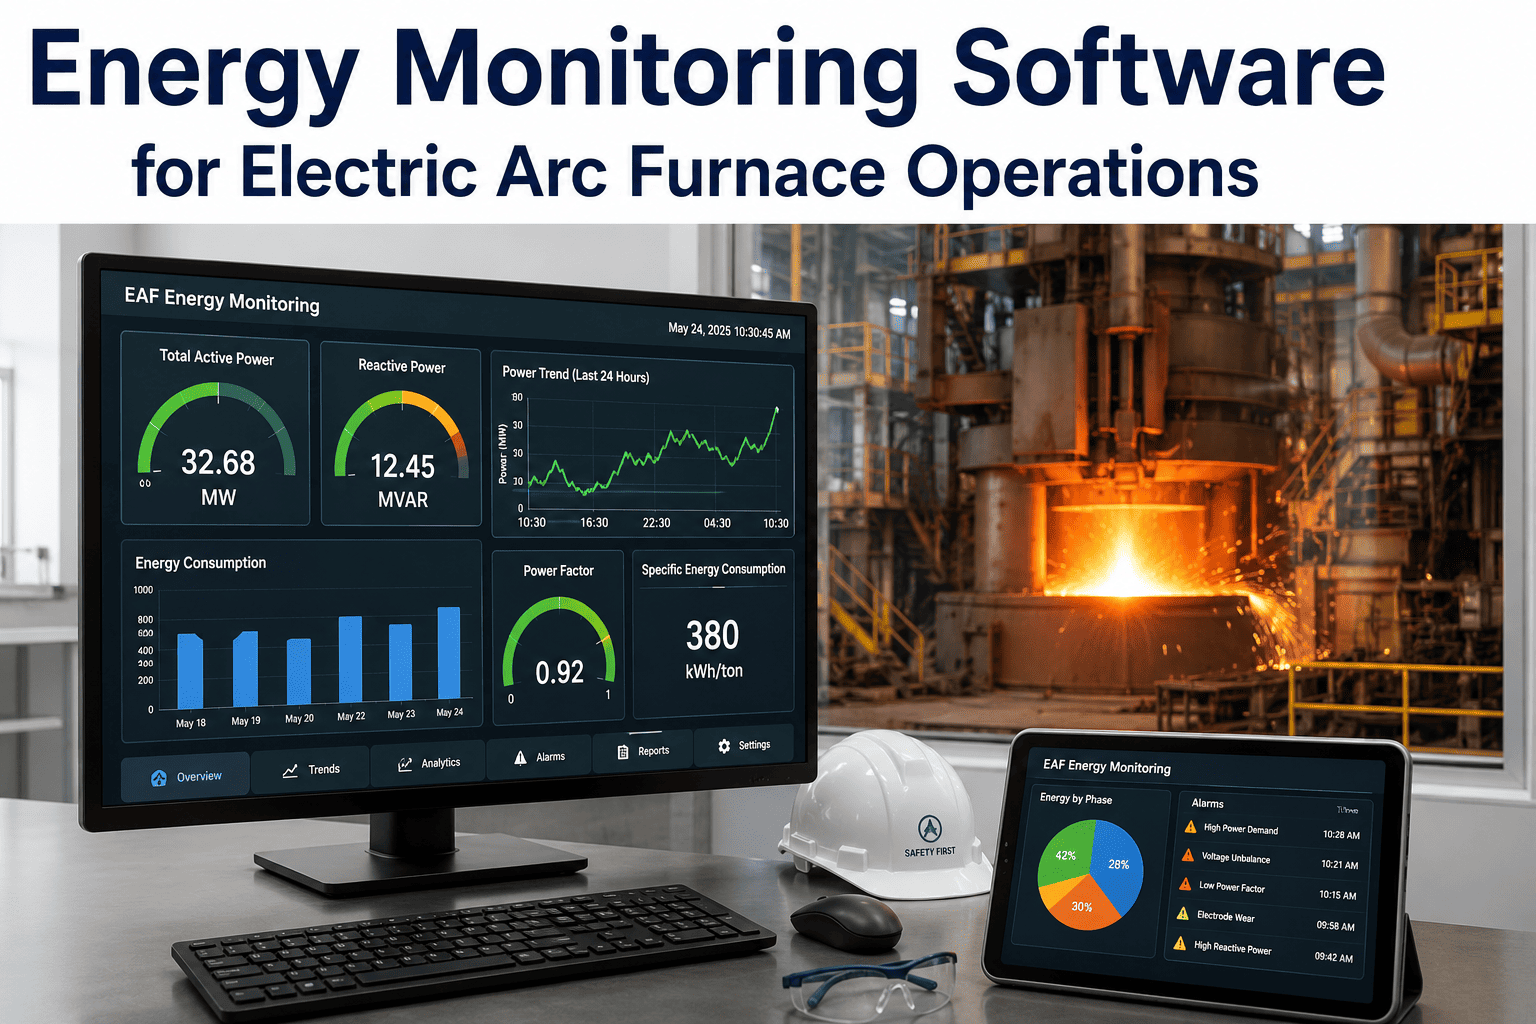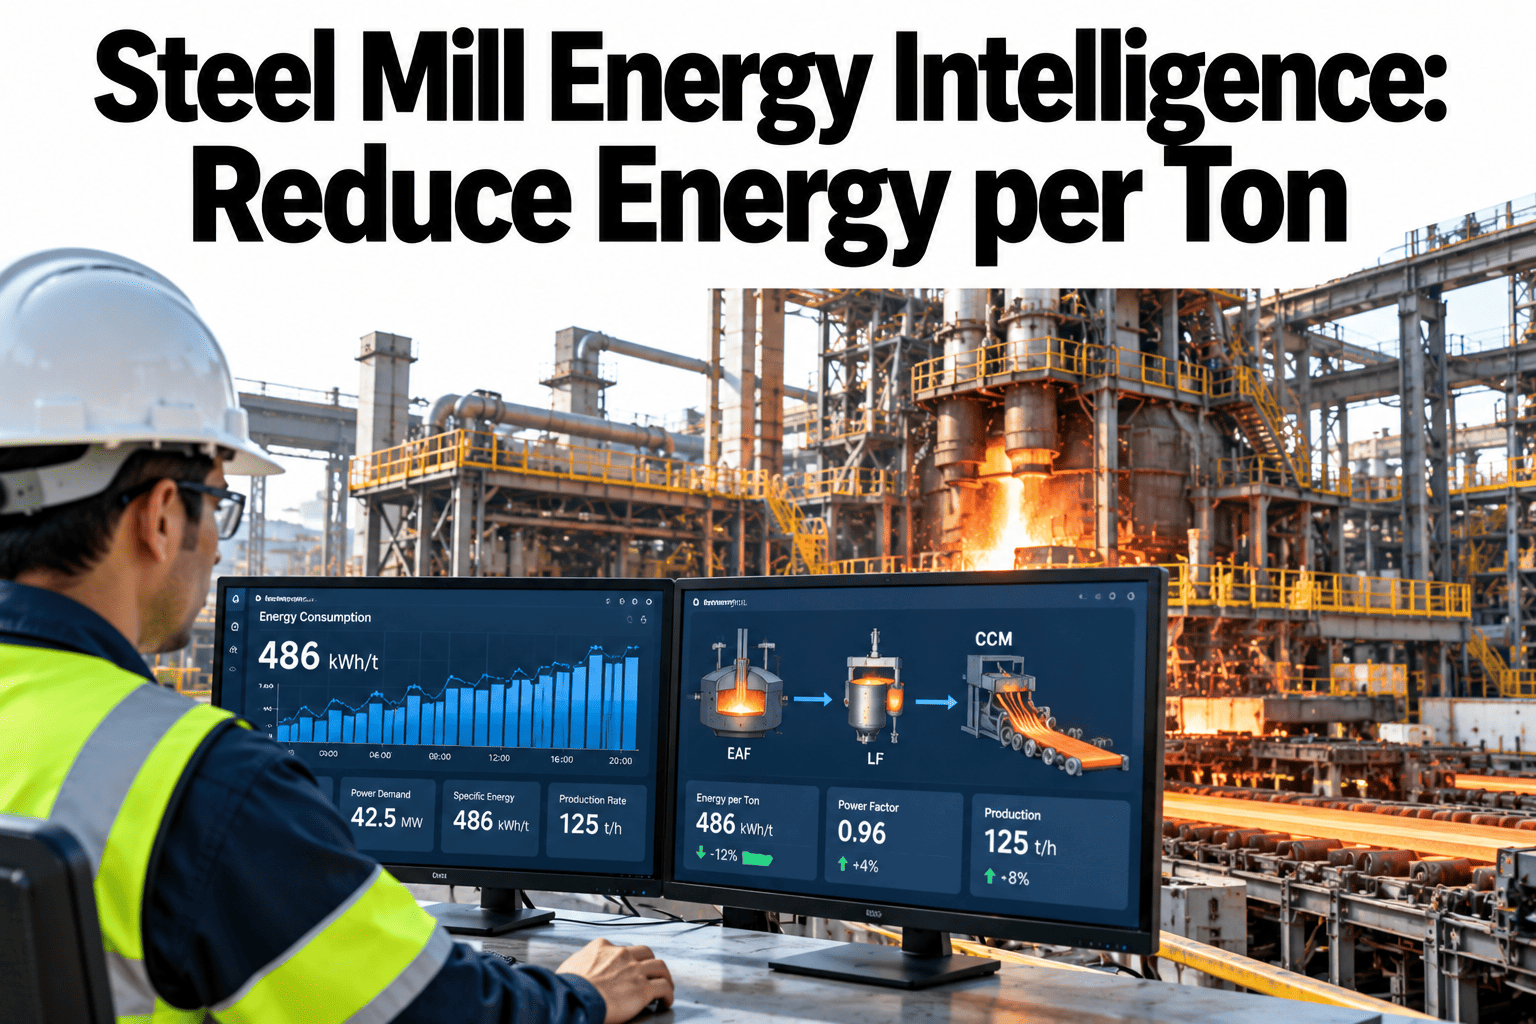
Energy per ton is one of the few metrics every steel mill tracks without fail, since it feeds so directly into cost per ton and competitive positioning. What most mills track less carefully is which specific process stage is actually driving a bad month, reheat furnace, electric arc furnace, or rolling mill, each with different energy drivers and different levers available to fix them. A plant-wide energy per ton figure blends all three together, which means a real problem in one stage can hide behind acceptable performance in the other two. Breaking the figure down by stage and tracking it against known drivers is what turns energy per ton from a scorecard number into something a team can actually act on, and if you want to see that breakdown applied to your own mill's energy data, our team can walk through it with you.
Find Out Which Process Stage Is Actually Driving Your Energy per Ton
Stage-level energy intelligence that breaks furnace, electric arc, and rolling consumption apart, so a plant-wide figure stops hiding exactly where the opportunity to reduce energy per ton actually is.
Why a Plant-Wide Figure Hides the Real Driver
Each major process stage has its own energy profile, and averaging them together is exactly what makes it hard to know where a bad month is actually coming from.
What Drives Energy Consumption at Each Stage
Breaking the plant-wide figure into its component stages reveals a specific driver worth investigating at each one.
| Process stage | Typical share of total energy | Primary driver |
|---|---|---|
| Electric arc furnace | 45 to 55% | Scrap mix and melt cycle efficiency |
| Reheat furnace | 15 to 20% | Charge temperature and soak time |
| Rolling mill | 15 to 20% | Reduction schedule and roll speed |
| Auxiliary and utility systems | 10 to 15% | Idle running and compressed air leaks |
These shares are general planning references, since the actual split depends heavily on your specific equipment mix and product range, which is why ongoing stage-level tracking matters more than any single industry figure.
How Stage-Level Tracking Surfaces Reduction Opportunities
Once energy is broken down by stage, the next step is comparing each stage's trend against its own known drivers to find where a real improvement opportunity exists.
Break Down Your Own Mill's Energy by Stage
Share a recent period of energy and production data and we will show your plant's own stage-level split.
Why Scrap Mix Deserves Special Attention in the EAF Stage
Since the electric arc furnace typically accounts for the largest single share of total energy, scrap mix, its single biggest driver, is often the highest-leverage place to focus reduction efforts.
What iFactory Steel Specialists See Across Mill Energy Reviews
iFactory steel specialists who review energy data across multiple mills consistently find that scrap mix variability in the electric arc furnace stage is the single most common driver behind an unexplained energy per ton increase, more often than any equipment degradation issue.
Their general recommendation is that mills tracking only a plant-wide energy per ton figure should prioritize splitting out the EAF stage first, since it typically carries the largest share of total energy and therefore the largest potential improvement.
What Energy and Operations Teams Ask About This Breakdown
Bring Stage-Level Energy Intelligence to Your Mill
Book a session with iFactory AI to see energy per ton broken down by furnace, EAF, and rolling stage on your own mill data.