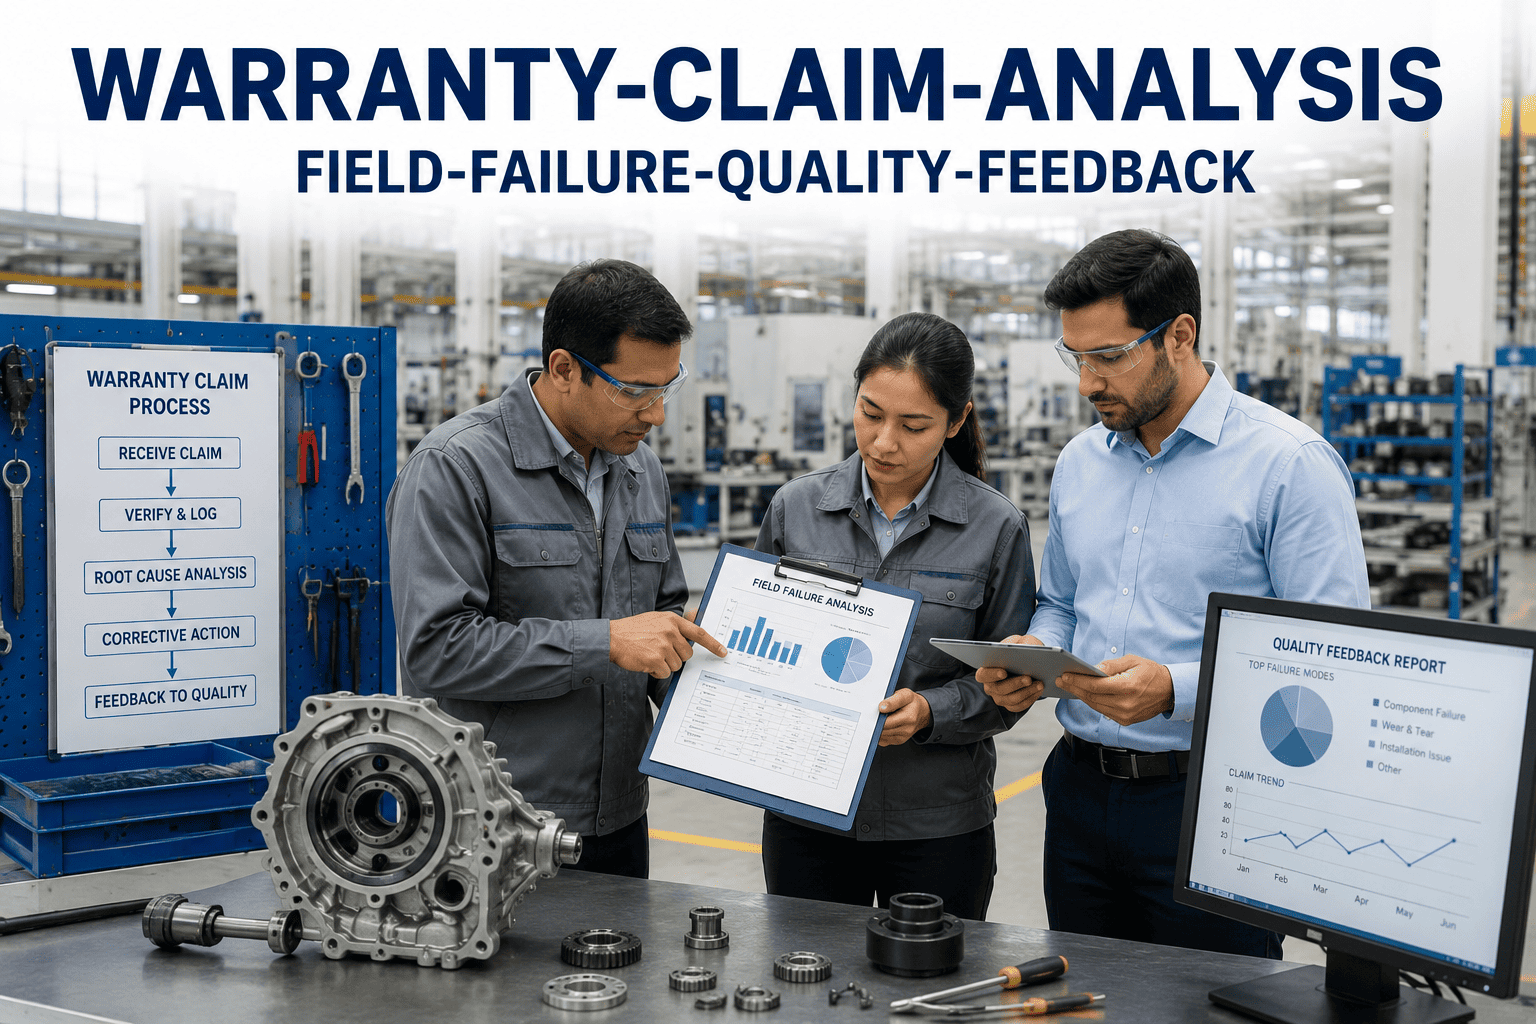
In the high-stakes arena of enterprise manufacturing, warranty claims are not merely financial liabilities; they are unprocessed intelligence signals from the field. Each returned unit, each customer complaint, and each service report carries embedded data about process deviations, material inconsistencies, and design vulnerabilities that silently erode profitability and brand reputation. For plant managers and maintenance directors overseeing complex production lines, the gap between field failure modes and manufacturing process parameters often represents millions in avoidable warranty costs. By constructing a structured feedback loop that systematically links every warranty event back to specific production batch attributes, machine settings, and quality checkpoints, organizations can transform reactive cost centers into proactive quality improvement engines. This comprehensive guide explores the architecture of a closed-loop warranty analysis system, leveraging Industry 4.0 technologies such as AI-driven pattern recognition, IoT sensor fusion, and digital twin simulations to decode failure signatures and drive continuous process optimization. Whether you are grappling with sporadic field failures or systemic quality degradation, the methodologies outlined here will empower your team to reduce warranty cost per unit, accelerate root cause identification, and elevate overall equipment effectiveness. Book a Demo to see how iFactoryApp can automate your warranty-to-quality feedback loop.
The Strategic Imperative of Warranty Data Integration
Every warranty claim is a data point that, when properly analyzed, reveals hidden process weaknesses and opportunities for quality enhancement.
Transform Warranty Costs into Quality Insights
Discover how closed-loop analysis can reduce warranty spend by up to 40% while improving first-pass yield.
Warranty Cost Per Unit Trends
Field Failure Modes Distribution
Root Cause Categorization
Systematic classification of field failures into design, process, material, and usage categories enables targeted corrective actions and reduces recurrence rates by over 60%.
Data Source Harmonization
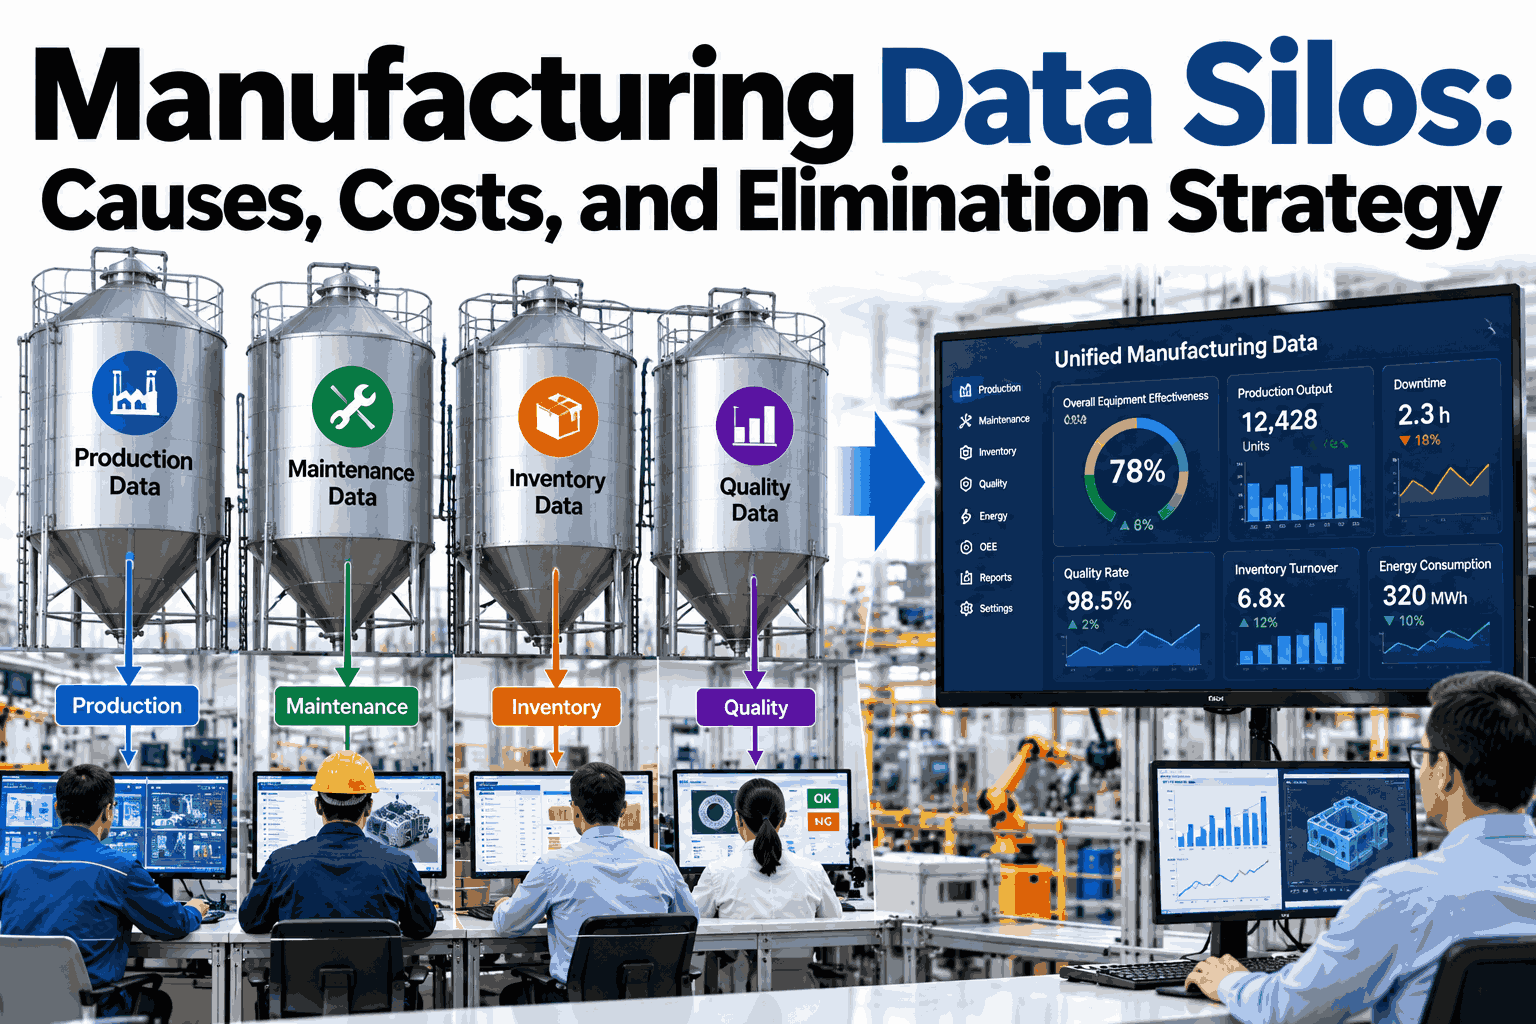
Integrating warranty databases with MES, SCADA, and CMMS systems creates a unified data lake that supports real-time correlation between field events and production parameters.
Predictive Failure Modeling
Machine learning algorithms trained on historical warranty and process data can forecast failure probabilities for new batches, enabling preemptive quality interventions.
Building the Closed-Loop Feedback Architecture
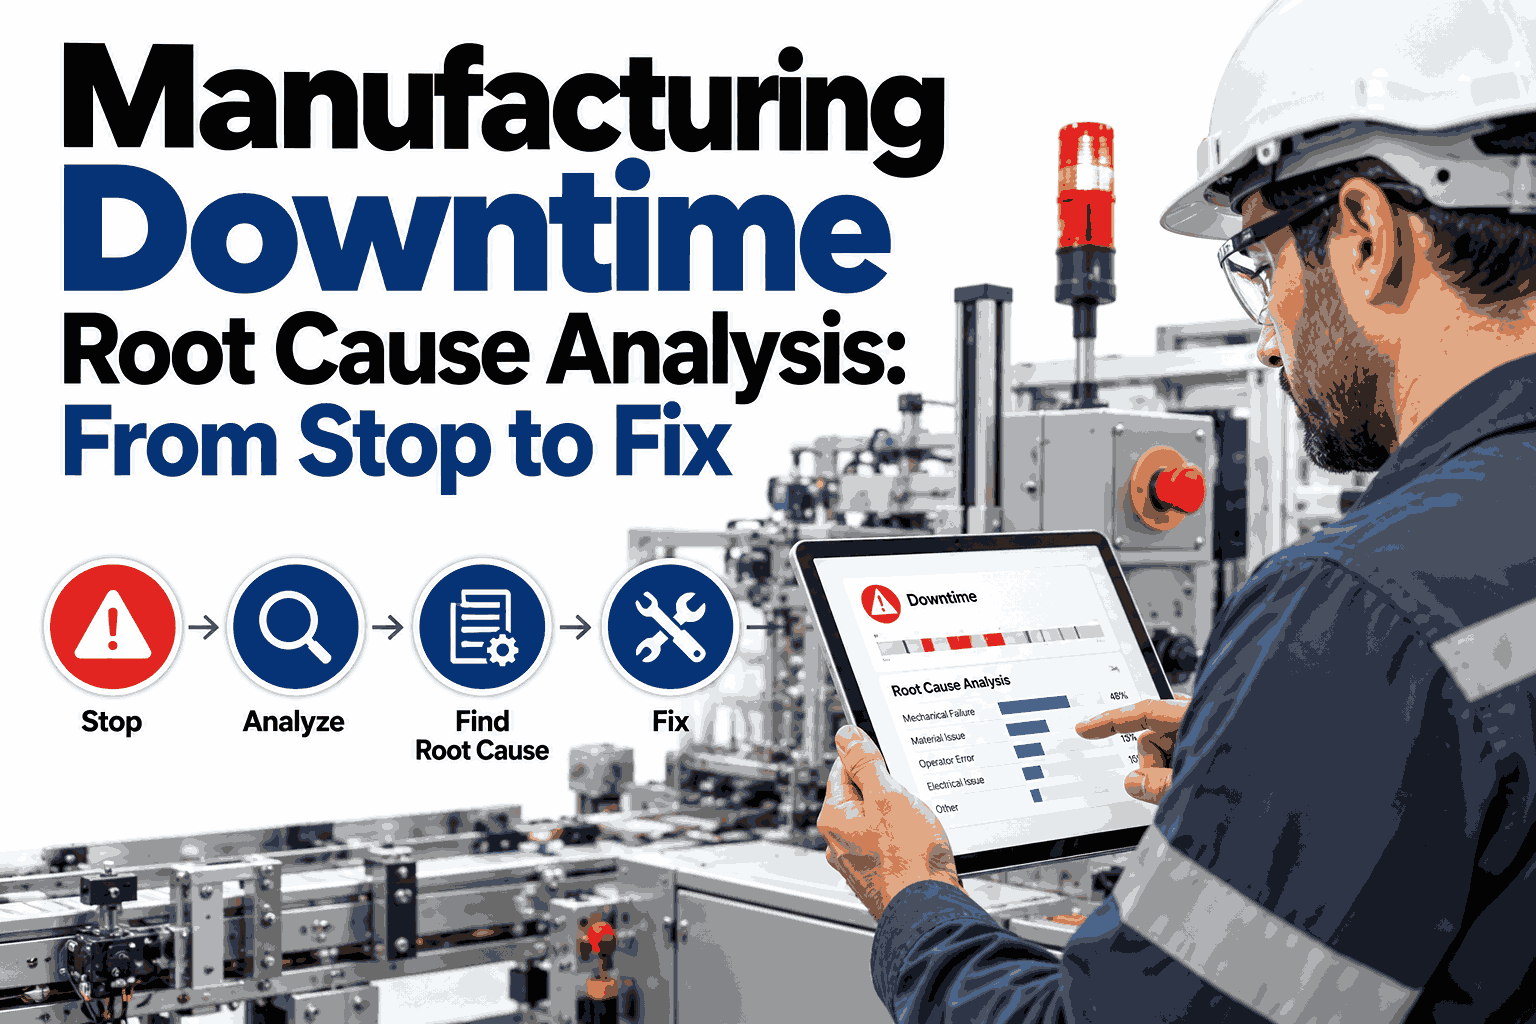
Capture Field Failure Data
Implement automated data ingestion from warranty claim systems, service reports, and customer feedback portals. Standardize failure mode taxonomies and assign severity levels for consistent analysis.
Correlate with Production Records
Link each warranty claim to specific production batch numbers, machine IDs, operator shifts, and quality inspection results using unique part serialization and IoT traceability.
Analyze Process Deviations
Apply statistical process control and anomaly detection algorithms to identify out-of-spec parameters that correlate with field failures. Use digital twin simulations to validate causal relationships.
Implement Corrective Actions
Deploy automated work instructions, machine parameter adjustments, and supplier quality alerts based on analysis findings. Track effectiveness through reduced warranty claim rates.
Monitor and Optimize
Establish continuous monitoring dashboards that display real-time warranty metrics, field failure trends, and process compliance scores. Use AI to recommend further refinements.
Accelerate Your Warranty-to-Quality Feedback Loop
Leverage iFactoryApp's AI-driven analytics to connect field failures with production data in minutes, not months.
Key Metrics for Warranty Claim Analysis
| Metric | Definition | Target Value | Impact |
|---|---|---|---|
| Warranty Cost Per Unit | Total warranty spend divided by units shipped | < $5.00 | Direct profitability improvement |
| Field Failure Rate | Number of failures per 1,000 units in first year | < 2.0 | Brand reputation and customer satisfaction |
| Root Cause Closure Time | Average days from claim to identified cause | < 30 days | Speed of corrective action |
| Feedback Loop Efficiency | Percentage of claims linked to process data | > 90% | Data-driven decision making |
| Recurrence Prevention Rate | Reduction in repeat failures after corrective action | > 80% | Long-term quality improvement |
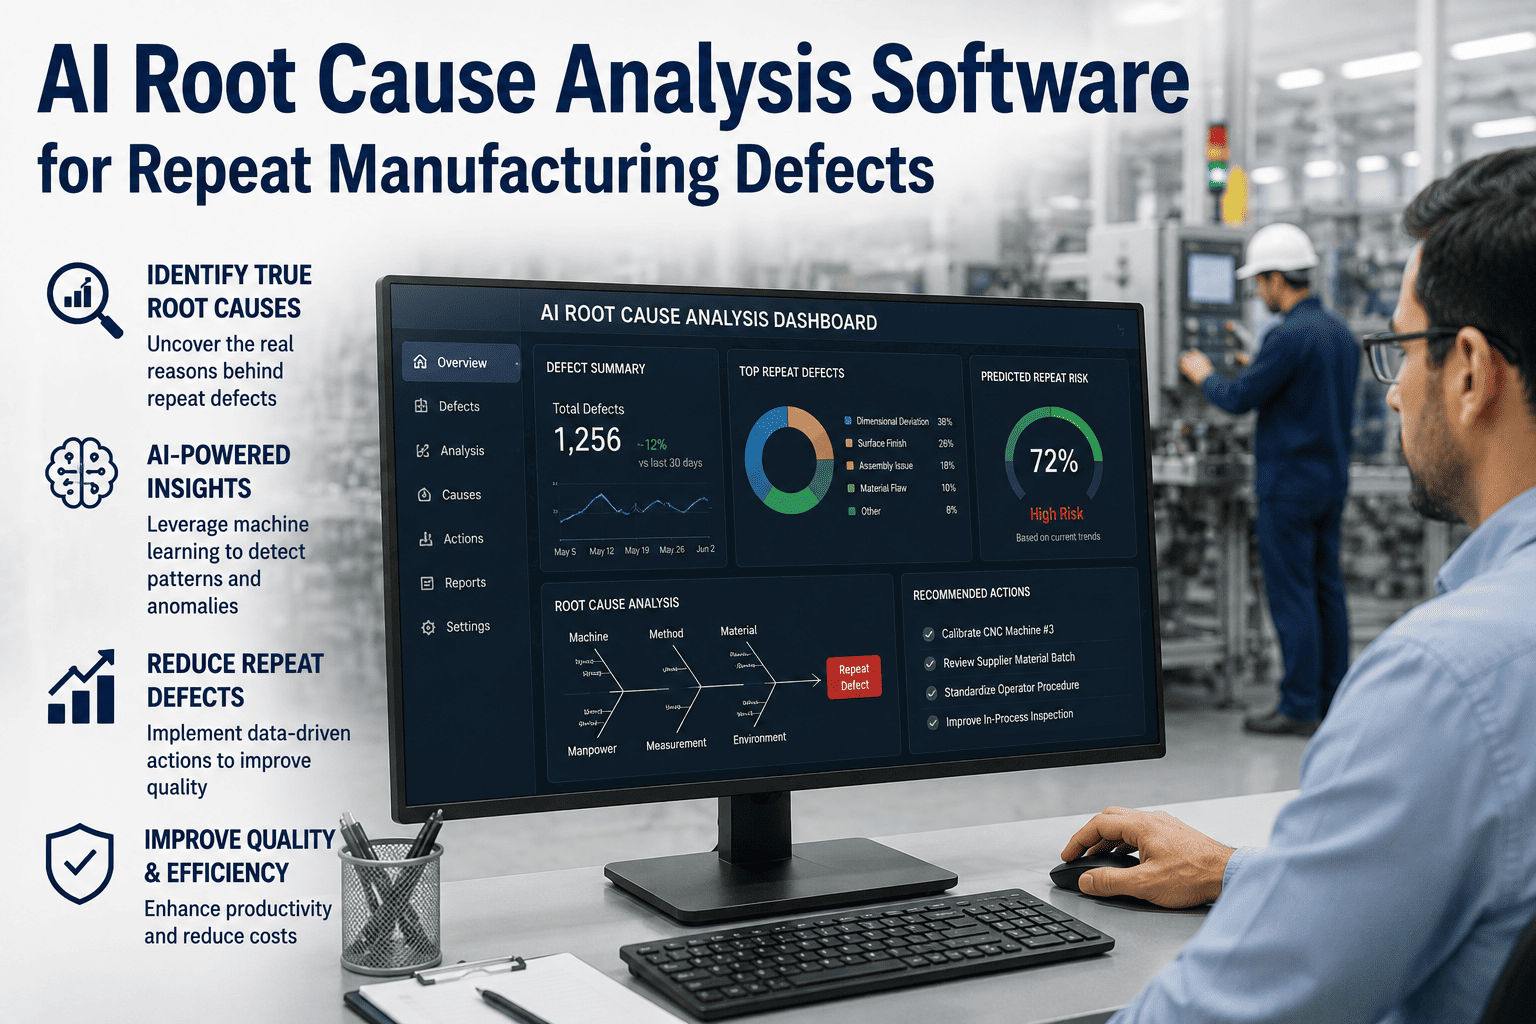
Automated Failure Mode Classification
Natural language processing models analyze warranty claim descriptions and service notes to automatically categorize failure modes, reducing manual effort by 70% and ensuring consistency across global operations.
Real-Time Process Drift Alerts
When field failure patterns emerge, the system cross-references real-time sensor data from production lines to detect process drifts that may have caused the issue, enabling immediate containment actions.
Supplier Quality Scorecards
Warranty data is automatically mapped to incoming material lots, generating dynamic supplier quality scorecards that highlight problematic vendors and drive procurement decisions.
Advanced Analytics for Warranty Trend Monitoring
Beyond basic correlation, enterprise-grade warranty analysis requires sophisticated statistical models that can detect subtle shifts in failure patterns before they escalate into widespread issues. Survival analysis techniques, such as Kaplan-Meier estimators, provide insights into the time-to-failure distribution for different product cohorts, allowing manufacturers to predict warranty exposure with high accuracy. Additionally, multivariate regression models can isolate the marginal contribution of each process parameter to field failure risk, enabling targeted optimization of critical control points. By integrating these advanced analytics into daily quality workflows, organizations can move from reactive warranty cost management to predictive quality assurance, where potential failures are anticipated and mitigated during production rather than after customer complaints arise.
Frequently Asked Questions
How can warranty claim analysis reduce overall manufacturing costs?
Warranty claim analysis directly reduces costs by identifying the root causes of field failures and enabling corrective actions that prevent recurrence. By linking claims to specific production batches, machine settings, and material lots, manufacturers can pinpoint inefficiencies and quality gaps that, when addressed, lower scrap rates, rework hours, and warranty payouts. Additionally, the insights gained from analysis support better design decisions, supplier selection, and process optimization, leading to long-term reductions in cost of quality. For a detailed walkthrough of implementation strategies, book a demo with our experts.
What data sources are essential for a closed-loop feedback system?
A robust closed-loop system requires integration of warranty claim databases, customer service logs, field service reports, and product serialization data from the supply chain. On the production side, essential sources include manufacturing execution systems (MES), supervisory control and data acquisition (SCADA) systems, computerized maintenance management systems (CMMS), and quality inspection records. IoT sensor data from machines and environmental monitoring systems provide granular process parameters. Harmonizing these diverse data sources into a unified analytics platform is critical for accurate correlation. Learn how iFactoryApp simplifies this integration by contacting our support team.
How long does it take to see results from warranty data analytics?
Initial insights can be generated within weeks of implementing a structured data ingestion and analysis pipeline, especially if historical data is readily available. However, the full benefits of a closed-loop feedback system typically materialize over three to six months as the machine learning models are trained on sufficient claim and process data, and as corrective actions are deployed and monitored. Early wins often come from identifying high-impact, single-point failures that can be quickly remedied. For a realistic timeline tailored to your operation, book a demo to discuss your specific data landscape.
What are common challenges in linking field failures to production data?
Common challenges include inconsistent data formats across different systems, lack of unique product identifiers that trace through the entire lifecycle, incomplete warranty claim descriptions, and siloed organizational structures that hinder data sharing. Additionally, time lags between production and field failure occurrence can make correlation difficult without robust time-series analysis. Overcoming these challenges requires investment in data governance, serialization standards, and cross-functional collaboration. iFactoryApp's platform addresses these issues with pre-built connectors and AI-driven data harmonization. For more details, contact our support team.
How does AI improve warranty claim root cause analysis?
AI enhances root cause analysis by automatically processing vast amounts of unstructured data from warranty claims, service notes, and sensor logs to identify patterns that human analysts might miss. Machine learning algorithms can cluster similar failure modes, detect anomalies in process parameters that correlate with failures, and even predict the most likely root cause for new claims based on historical data. This reduces analysis time from weeks to hours and improves accuracy. Advanced AI models can also simulate 'what-if' scenarios to test corrective actions before deployment. To see AI in action, book a demo.
Close the Loop on Quality Today
Stop treating warranty claims as unavoidable costs. Turn them into your most valuable source of quality intelligence.