A greenfield plant sets its energy economics on Day 1. The metering infrastructure you commission, the baseline you lock before first production, and the AI anomaly thresholds you configure in the first 90 days determine whether your energy cost is a managed variable or an uncontrolled overhead for the next 20 years. Global manufacturing wastes roughly 40% of purchased energy through equipment inefficiency, invisible leaks, and poor scheduling — and the facilities that contain this waste are not the ones that install sub-meters after an energy audit. They are the ones that design real-time energy monitoring into the facility alongside the electrical single-line diagram, before the first utility bill arrives.
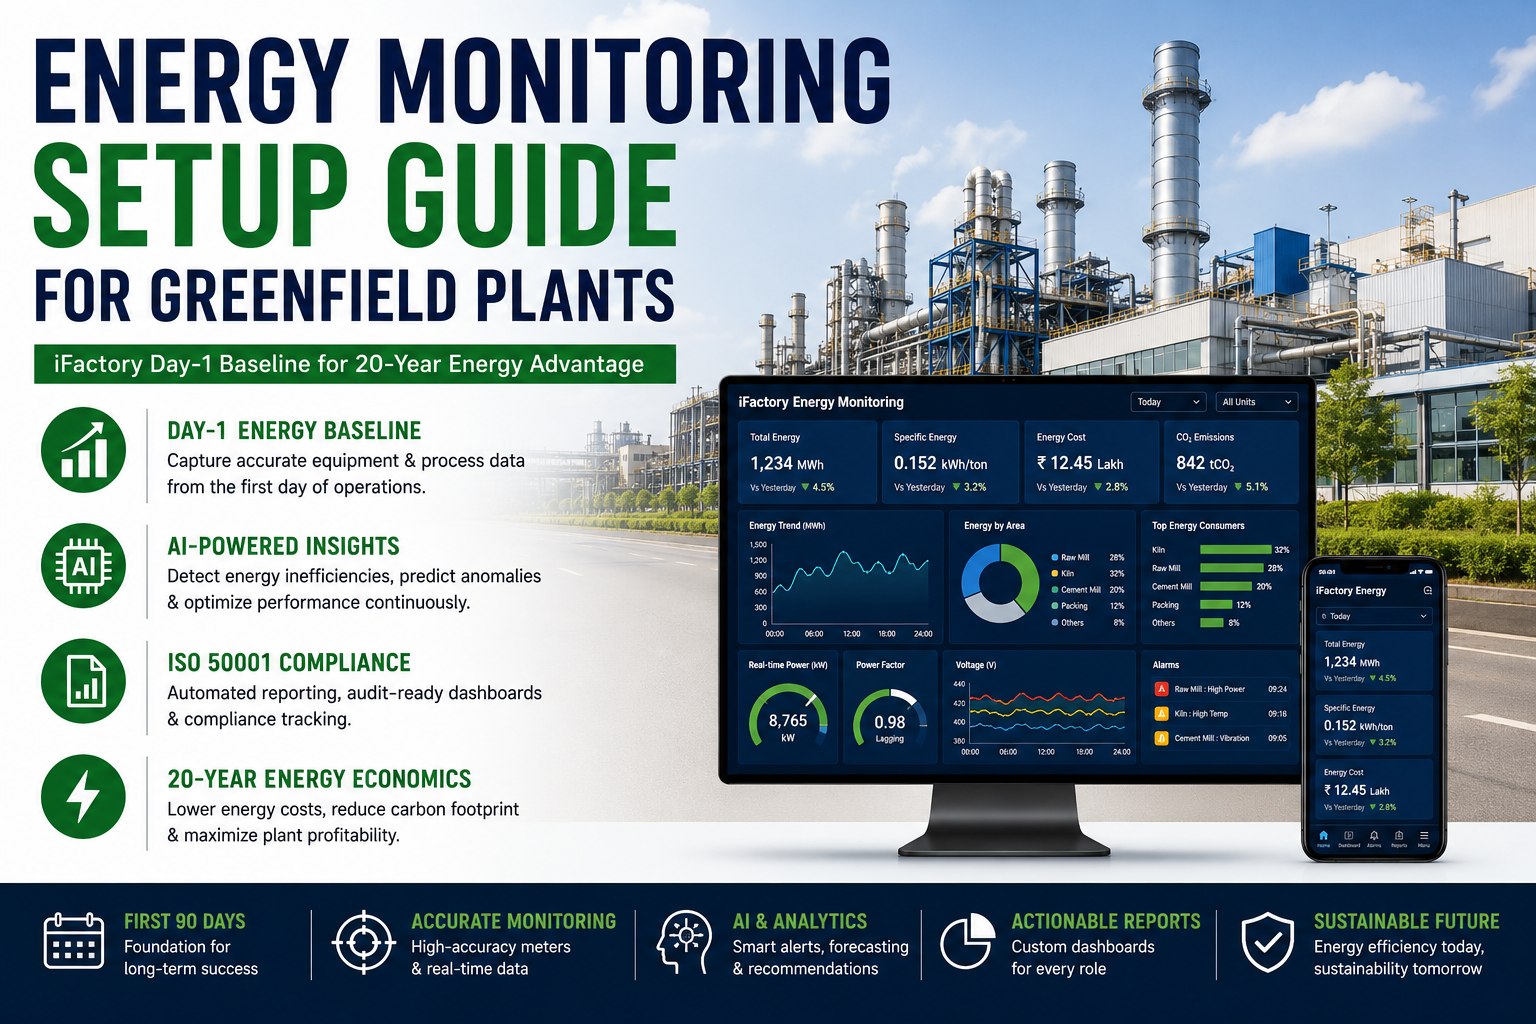
Lock in your Day-1 energy baseline with iFactory — AI-powered metering, ISO 50001 EnPIs, and anomaly detection live from your first production shift.
The 40% Problem — and the Monitoring Stack That Solves It
Where Your Purchased Energy Goes Before It Reaches Production
Manufacturing wastes 40% of purchased energy. Real-time monitoring makes every loss visible — and recoverable.
Transformer & Distribution
Resistive losses in cabling and transformers before energy reaches any load. Invisible without a sub-meter at each distribution board.
Power Factor & Reactive Demand
Utilities penalize PF below 0.90 with reactive demand charges. A greenfield plant without PF monitoring pays this penalty from the first bill.
Idle & No-Load Equipment
Motors, compressors, HVAC running at zero or partial load overnight and between batches. The largest no-capital-cost saving opportunity in most facilities.
Compressed Air Leaks
Compressed air systems leak 25–30% of their output in typical plants. Each 1mm diameter leak wastes ~1.5 kW continuously — and goes completely undetected without pressure and flow monitoring.
Why the First 90 Days Set Your Energy Economics for 20 Years
A greenfield plant that commissions without real-time energy monitoring enters a data deficit it rarely fully escapes. The baseline you measure in months 1–3 becomes the reference point against which every future efficiency improvement is measured, every ISO 50001 audit is evaluated, and every energy procurement negotiation is argued. An inaccurate baseline — or worse, no baseline at all — means every subsequent claim of energy improvement is unverifiable, every anomaly is invisible until the utility bill arrives, and every ISO 50001 audit requires reconstructing history from fragmentary data. Getting monitoring live from Day 1 is not an ambitious goal. It is the only approach with a good outcome.
Delay 1 Month
30 days of energy consumed with no baseline — ISO 50001 Clause 6.5 requires a defined reference period. Month 1 data is irreplaceable for establishing a credible pre-improvement baseline. You cannot reconstruct it from utility bills.
Delay 3 Months
One complete quarter of energy waste undetected and unquantified. For a 10 MW facility at $0.08/kWh, a 10% waste rate costs $58,000 per month unmonitored. Three months = $174,000 that an AI anomaly alert would have recovered within the first week of each event.
Delay 12 Months
You have no valid ISO 50001 baseline. Your first energy audit reveals an inflated consumption figure with no traceable cause. ESG reporting shows a first-year carbon footprint with no comparator. You spend Year 2 reconstructing data that would have cost nothing to capture from Day 1.
of manufacturing energy purchased is wasted — the largest single recoverable cost in most facilities
energy reduction in Year 1 with AI anomaly detection — documented across industrial deployments 2024–2025
primary energy reduction achieved at VDAB's 140-site deployment using AI energy management — 162% ROI same year
average payback period for full AI energy monitoring stack on a mid-size greenfield manufacturing facility
Want to see what Day-1 monitoring looks like for your facility size and energy profile? Book an energy monitoring design session with iFactory — we scope your metering architecture, AI baseline configuration, and ISO 50001 EnPI setup before your electrical contractor finalizes drawings.
The 90-Day Energy Baseline Playbook
Establishing a credible, ISO 50001-compliant energy baseline in the first 90 days of production requires four parallel workstreams running from pre-commissioning through first quarter close. Each workstream has a distinct technical scope and delivers a specific output that feeds the next. The greenfield window — where metering hardware can be designed in rather than retrofitted — is the only time this sequence can be executed at minimum cost and maximum completeness.
Metering Architecture Design
-
Main incomer meters — revenue-grade smart meters at the utility connection point (CT/VT class 0.2S minimum for ISO 50001 compliance)
-
Sub-metering at distribution boards — one sub-meter per Significant Energy Use (SEU): compressor room, HVAC, process heating, production lines
-
Data integration path designed — Modbus TCP or IEC 61850 meter protocol confirmed, historian and energy platform connectivity tested
-
EnPI definitions confirmed — kWh/tonne output, kWh/m² for facilities, SEC per production line — aligned to ISO 50001 Clause 6.4 before any data is collected
Baseline Data Capture
-
15-minute interval energy data recording from all meters from the first production minute — granularity required for peak demand analysis and ISO 50001 Clause 6.5
-
Production output correlation — energy data linked to MES/ERP production volume so EnPI (kWh/unit) is computed automatically, not manually
-
Anomaly detection baseline seeding — AI model initializes with first two weeks of data to distinguish startup patterns from steady-state operation
-
SEU identification — live data confirms which assets actually dominate the energy profile (often different from engineering estimates)
AI Baseline Calibration
-
Dynamic baseline finalized — AI correlates energy draw against production volume, ambient temperature, shift pattern, and equipment age (no static Excel model)
-
Anomaly alert thresholds set — compressor 15% above baseline triggers instant alert vs. end-of-billing-cycle discovery. Each SEU gets its own threshold calibration.
-
Peak demand analysis — 30 days of interval data identifies demand spikes, staggered start opportunities, and power factor correction targets
-
First improvement opportunities ranked — AI Pareto analysis of losses by value, with estimated savings and implementation effort per opportunity
ISO 50001 Baseline Lock & Audit Readiness
-
ISO 50001 energy baseline formally set — Clause 6.5 reference period documented, EnPIs computed, baseline report generated as audit evidence
-
SEU documentation complete — each Significant Energy Use identified, metered, assigned an EnPI target, and mapped to an improvement action plan
-
ESG / Scope 2 report generated — auditable carbon intensity data from asset-level metering, ready for CSRD, SEC climate disclosure, or BRSR submission
-
First improvement project M&V baseline set — measurement and verification baseline locked before first energy project begins, so savings are provable at audit
Need the 90-day playbook scoped for your facility type and energy profile? Book an energy baseline design session with iFactory — we produce your metering architecture, EnPI definitions, and AI baseline configuration before your commissioning team arrives on site.
ISO 50001 & ESG Compliance: What Real-Time Monitoring Automates
ISO 50001 is not complicated in concept. Its four PDCA stages — Plan, Do, Check, Act — map directly to a well-configured energy monitoring platform. The burden of certification has historically been the manual labor of collecting, cleaning, and reporting energy data across billing periods, production records, and asset registers. AI-powered energy monitoring converts that labor into automation: baselines compute continuously, EnPIs update in real time, anomalies are flagged within minutes, and audit evidence is assembled automatically throughout the year rather than in a six-week scramble before the certification body arrives.
Plan
Baselines, EnPIs & SEU identification
- AI auto-computes dynamic energy baselines from production output and contextual variables
- SEU identification from live consumption data (not engineering estimates)
- EnPI targets computed per asset and line — kWh/unit, kWh/m², SEC
- ISO 50001 Clause 6.5 reference period locked automatically with data provenance trail
Do
Continuous monitoring & anomaly detection
- 15% above-baseline compressor draw flagged in real time — not at month-end billing
- AI differentiates process-normal variation from genuine waste events
- Load forecasting enables proactive demand management before peak windows
- Equipment sequencing recommendations reduce simultaneous start demand spikes
Check
M&V, EnPI tracking & audit evidence
- Measurement and verification (M&V) baseline locks before each energy project — savings are provable at audit
- EnPI trend dashboard: baseline → target → actual deviation, automatically updated
- Audit evidence archive built continuously — no end-of-year document scramble
- Before/after energy comparison for every capital project with statistical confidence intervals
Act
Improvement ranking & continuous optimization
- AI Pareto analysis ranks improvement opportunities by annual savings value
- Cross-shift and cross-line benchmarking identifies best-performing operating patterns
- Baseline dynamically updated when production mix or equipment changes — avoiding false efficiency claims
- Supply chain ESG reporting auto-populated from asset-level metering data
Need ISO 50001 compliance automated into your energy monitoring from Day 1? Talk to iFactory's energy management team — we configure EnPIs, SEU tracking, and audit-ready reporting as part of your greenfield commissioning scope, not as a post-certification retrofit.
Day-1 Energy Baseline. AI Anomaly Alerts. ISO 50001 Audit-Ready From Month 3.
iFactory's greenfield energy monitoring platform designs metering architecture, establishes AI baselines, configures ISO 50001 EnPIs, and delivers your first audit-ready evidence package — all within 90 days of first production. The economics you lock in those 90 days determine your energy cost structure for the next 20 years.
The 7 Energy KPIs Every Greenfield Plant Must Measure From Day 1
Most greenfield plants begin energy monitoring with a single utility meter and a monthly report. This captures total consumption but misses the six additional metrics that turn energy data into operational decisions. Each metric requires a different measurement source — and each becomes impossible or expensive to add retroactively if the metering infrastructure was not designed to support it from commissioning.
Specific Energy Consumption (SEC)
kWh per unit of production output — the only metric that separates energy efficiency from production volume changes. A plant that consumes more energy but also makes more product may have improved or worsened. SEC answers this unambiguously.
Peak Demand & Demand Variance
Maximum kW drawn in any 15-minute interval in a billing period. Demand charges frequently represent 30–40% of an industrial utility bill — and they are set by a single peak event. Monitoring demand in real time enables load shifting and staggered equipment starts that eliminate peak charges entirely.
Power Factor (PF)
Ratio of active power to apparent power — utilities penalize PF below 0.90–0.95 with reactive demand charges that typically add 5–8% to the energy bill. A greenfield facility with proper metering identifies the motors and drives dragging PF below threshold within the first week of monitoring, before the first bill arrives.
Transformer & Distribution Losses
Energy consumed by electrical distribution infrastructure before it reaches any productive load. Calculated as the difference between utility meter input and sub-meter sum. Distribution losses of 4–8% are normal; losses above 10% indicate undersized transformers, poor power factor, or harmonics that are causing overheating and shortening transformer life.
Idle & No-Load Energy Consumption
Energy consumed by equipment running with no production output — overnight, during breaks, between batches. Accounts for 8–12% of total facility energy in typical manufacturing. Monitoring identifies the specific machines and time windows causing idle consumption, enabling scheduling changes that require no capital investment.
EnPI Baseline-Target-Deviation
The ISO 50001 core metric: the gap between each Energy Performance Indicator's current value and its established baseline, tracked continuously. Deviation triggers investigation and corrective action. Without this metric, ISO 50001 certification is unachievable — and energy improvement projects have no verifiable before/after comparison.
Carbon Intensity (Scope 2 Emissions)
kgCO₂e per unit of production — derived from energy consumption data using grid emission factors. Required for CSRD (Europe), SEC climate disclosure rules (US), and BRSR (India). Increasingly required by global buyers as a supplier qualification criterion. Cannot be computed credibly from monthly utility bills — requires asset-level energy data with timestamp granularity.
Expert Perspective
The most expensive energy monitoring mistake is the one most greenfield plants make: waiting until the first ISO 50001 audit notice to build the data foundation. By that point, you are trying to reconstruct a baseline from utility bills that aggregate everything together — you have no sub-meter data to tell you whether the compressor room or the process heating drove the consumption, no production correlation to compute an EnPI, and no anomaly history to show improvement against. The greenfield window is a one-time opportunity to instrument a facility correctly from first power-on. The monitoring system cost is 0.1–0.5% of project CapEx. The cost of not having it is 5–15% of annual energy spend, compounded for the life of the facility.
energy intensity reduction within 3 years for organizations with certified ISO 50001 energy management systems
ROI in first year at VDAB's 140-site AI energy monitoring deployment — 53% primary energy reduction, 30% better than target
of project CapEx — typical cost of designing energy monitoring into a greenfield facility vs. 2–3× that for retrofit
Your First 90 Days Decide Your Energy Economics for the Next 20 Years
iFactory's greenfield energy monitoring platform designs metering architecture into your facility drawings, establishes AI-powered dynamic baselines from Day 1, configures ISO 50001 EnPIs and SEU tracking automatically, and delivers your first audit-ready compliance package at the 90-day mark — for 0.1–0.5% of your facility CapEx and before your first utility bill reveals what you missed.
Frequently Asked Questions
What is an energy baseline and why does ISO 50001 require it?
An energy baseline is a quantified reference point that represents a facility's energy performance before improvement actions begin. ISO 50001 Clause 6.5 requires organizations to establish a baseline using data from a defined reference period — typically 3–12 months of measured energy data correlated with relevant variables such as production volume, ambient temperature, and equipment operating conditions. Every energy performance improvement claim in the ISO 50001 system is measured against this baseline: if you cannot demonstrate that your current EnPI is lower than the baseline EnPI, you cannot claim energy improvement. For greenfield plants, the baseline reference period should begin from the first day of production — using a Day-1 monitoring system that records 15-minute interval data from all meters. Plants that delay monitoring to month 3 or 6 have permanently lost their earliest baseline data and must use a higher starting point, making future improvement claims harder to prove at audit.
What sub-metering infrastructure does a greenfield plant need for ISO 50001 and AI energy monitoring?
A greenfield plant implementing ISO 50001-ready energy monitoring requires: one revenue-grade smart meter at the utility incomer (class 0.2S accuracy, measuring kWh, kVAR, demand, and power factor at 15-minute intervals); sub-meters at each distribution board serving a Significant Energy Use — typically the compressor room, HVAC and cooling, process heating, main production lines, and utilities. The SEU sub-meters must record at the same 15-minute interval granularity as the main incomer to enable EnPI computation and anomaly detection at asset level. For AI baseline accuracy, each sub-meter output is correlated with the production data from MES/ERP — this correlation is the difference between knowing total energy and knowing energy per unit of output. The metering protocol should be Modbus TCP or IEC 61850 for compatibility with industrial energy management platforms. Wireless sub-meters can be used where panel retrofit is difficult but require redundant data logging since wireless communication failures create gaps in baseline data that complicate ISO 50001 audit evidence.
How does AI anomaly detection work for energy monitoring and what does it flag?
AI energy anomaly detection builds a dynamic baseline model for each monitored asset by correlating energy draw against production output, ambient temperature, shift pattern, and equipment age across the first two to four weeks of operation. This model establishes what each asset is expected to consume under any combination of operating conditions — distinguishing process-normal variation from genuine inefficiency. Anomalies are flagged when actual consumption deviates from the model prediction by more than a configured threshold: a compressor drawing 15% above baseline for more than 30 minutes, a motor drawing abnormally high current suggesting bearing friction, HVAC consuming above baseline on a shift when production is lower than usual. The critical advantage over threshold-only alerts is context-sensitivity: a 20% increase in compressor draw during a heat wave is normal; the same 20% increase on a mild day is an anomaly. Static threshold alerts generate false positives in this scenario; AI baseline models do not. This anomaly detection capability is why AI monitoring recovers 5–15% of annual energy spend in Year 1 — events that would be invisible in monthly utility reports are flagged and corrected within hours of occurrence.
How does energy monitoring support ESG and carbon disclosure reporting?
ESG carbon reporting (Scope 2 emissions from purchased electricity) requires asset-level energy consumption data with timestamp granularity — not monthly utility bill totals. Carbon intensity (kgCO₂e per unit of production) is computed by multiplying sub-metered energy consumption by the grid emission factor for the relevant location and time period. Regulatory requirements driving this need include CSRD Article 8 (European companies and their supply chains from 2025), SEC climate disclosure rules (US public companies from 2024–2026), and India's BRSR framework. A greenfield plant with sub-metered energy monitoring from Day 1 has auditable, asset-level carbon intensity data from first production — providing a credible baseline for carbon intensity improvement claims and eliminating the estimation uncertainty that weakens emission reports assembled from aggregate utility bills. iFactory's energy monitoring platform auto-populates Scope 2 emissions data using continuously updated grid emission factors and generates the audit-ready evidence archives required by third-party ESG assurance providers.
What is the ROI of energy monitoring for a greenfield manufacturing plant?
The ROI case for greenfield energy monitoring combines three distinct value streams: operational savings, compliance cost avoidance, and ESG value. Operational savings: AI anomaly detection identifies 5–15% of annual energy spend as recoverable waste — for a facility with $2M annual energy cost, this represents $100K–$300K in Year 1 savings, typically exceeding the monitoring platform cost within 6–14 months. The 53% energy reduction at VDAB's 140-site deployment (162% ROI in Year 1) represents the high end of documented results. Compliance cost avoidance: ISO 50001 certification without automated monitoring requires 12–18 months of manual data collection, consultant-supported baseline analysis, and preparation of audit evidence — typically $150K–$400K in implementation cost. A monitoring platform that automates this process from Day 1 reduces certification project cost by 60–70% and eliminates the annual surveillance audit preparation burden. ESG value: supplier qualification requirements and customer sustainability mandates are increasingly linked to ISO 50001 certification and demonstrable carbon intensity data — the commercial value of this certification is facility- and contract-specific but increasingly measurable as requirements tighten in 2026–2027.