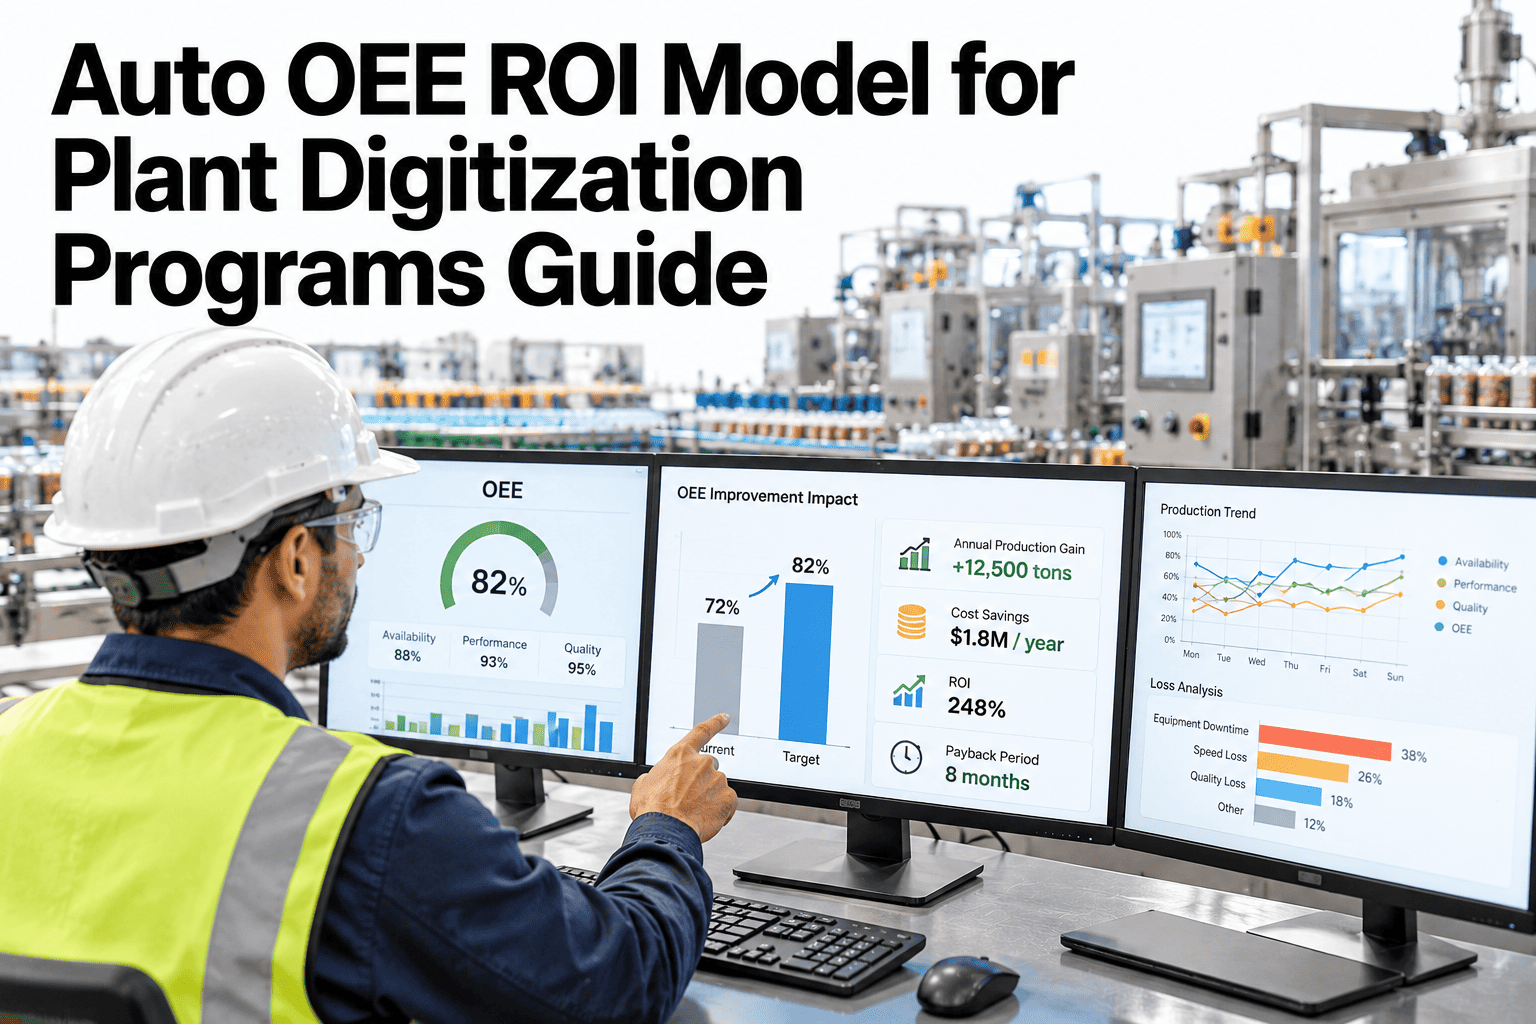
A capital committee asked to fund a digitization program usually gets a slide that says OEE will improve, with no number attached to what that improvement is actually worth. A one-point OEE gain sounds small until it is translated into additional vehicles produced per year at the plant's existing cost structure, and that translation is the piece most digitization proposals skip. Without it, the business case reads as a technology upgrade rather than a return on capital. Build a quantified ROI model for your own plant's digitization case.
What a One-Point OEE Gain Is Actually Worth
iFactory AI translates a digitization program into a quantified OEE gain, a real cost stack, and a payback timeline a capital committee can approve.
The Equation Behind a One-Point Gain
A one-point OEE improvement on a line running near its theoretical capacity converts almost directly into additional saleable output.
On a line running three shifts at a 60-second cycle, one OEE point is worth hundreds of additional units a year without adding a single hour of run time. Multiplying that unit count by contribution margin per vehicle turns the OEE gain into a dollar figure the capital committee can compare directly against the program's cost.
The Real Cost Stack
A digitization program's cost is rarely just the software license; the full stack determines the true payback period.
Quantify Your Own Digitization Case
Book a 30-minute session and build a cost-stack and payback model on your own plant's OEE and production numbers.
Model Inputs That Change the Payback Period
The same OEE gain can produce a very different payback period depending on four plant-specific inputs.
| Input | Why It Moves Payback | Typical Range |
|---|---|---|
| Contribution margin per unit | Higher margin makes each additional unit worth more | Varies by vehicle program |
| Current OEE baseline | Lower starting OEE usually means more room for a fast early gain | 55-75% typical |
| Line run hours | More planned hours multiply the value of each OEE point | 2 vs 3 shift operation |
| Integration complexity | Legacy equipment raises connection cost and extends timeline | Plant and line-age dependent |
Three Scenarios on the Same Line
Modeling cautious, expected, and stretch outcomes gives a capital committee a realistic range rather than a single optimistic number.
Cautious
A half-point OEE gain, extending payback but still inside the program's planning horizon.
Expected
A full one-point gain based on comparable programs at similar plants, the committee's base case.
Stretch
A two-point gain achievable once best practices are fully adopted across all shifts.
Answering the Committee's Objections
The same questions come up in almost every digitization funding review; the model should answer them before they are asked.
Building the Model on Your Data
iFactory AI pulls current OEE baseline and run-hour data directly from your plant systems rather than relying on estimated inputs.
Expert Review
Digitization proposals get approved faster once the OEE gain is tied to a dollar figure the committee can compare against other capital requests, rather than left as a qualitative promise. The cautious scenario matters most in that review, since it is usually what convinces a skeptical committee member the case still holds under pressure.
Frequently Asked Questions
Where does the OEE baseline figure come from?
The baseline is pulled from your plant's existing MES or production reporting rather than estimated, so the starting point of the model reflects actual current performance. Support can confirm what baseline data is already available.
How is the expected OEE gain determined?
The expected scenario is calibrated against comparable automotive plants that have completed similar digitization programs, not a flat industry assumption applied regardless of starting conditions.
Does the cost stack include hardware we already own?
Yes, existing sensors and edge hardware are factored in as sunk cost rather than re-added to the stack, so the model reflects only the incremental spend required. Walk through your current hardware inventory on a call.
Can this model support a multi-plant rollout request?
Yes, the same model structure can be built across several plants to support a phased or network-wide digitization funding request, with each plant's own baseline kept distinct.
What happens if actual results fall short of the model?
The model is reviewed against actual post-implementation OEE data, and the gap is explained by which input differed from the original estimate. Ask support how post-implementation tracking works.
Build a Business Case the Committee Can Approve
iFactory AI quantifies your digitization program's OEE gain, cost stack, and payback period on your own plant's data. Book a session to build it.