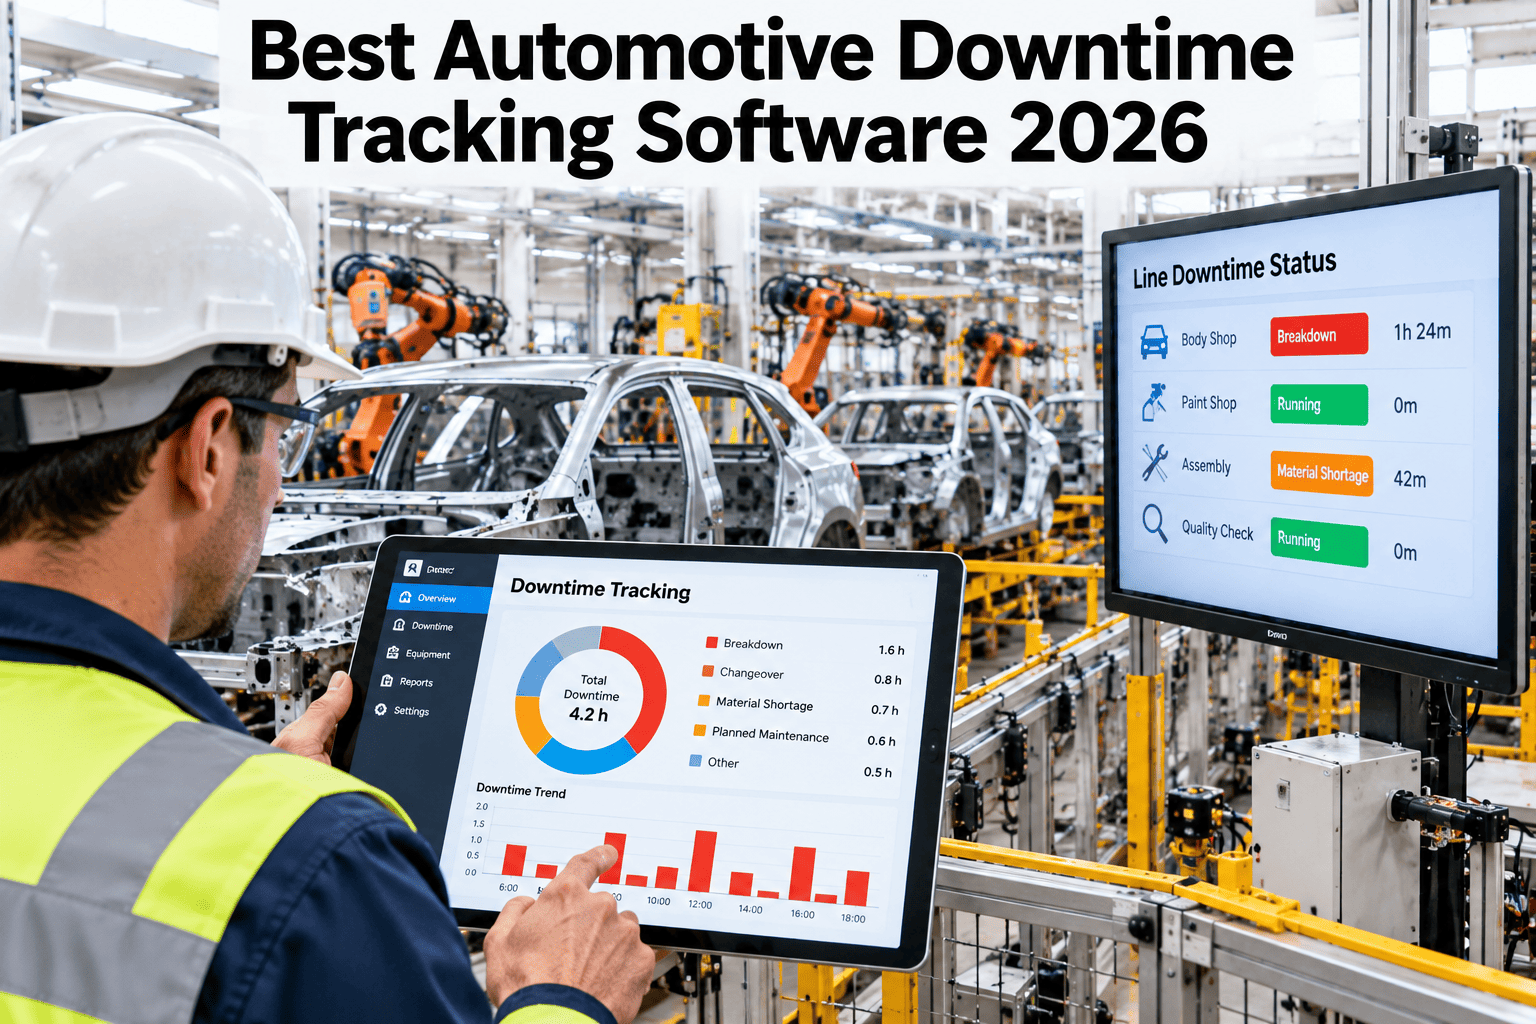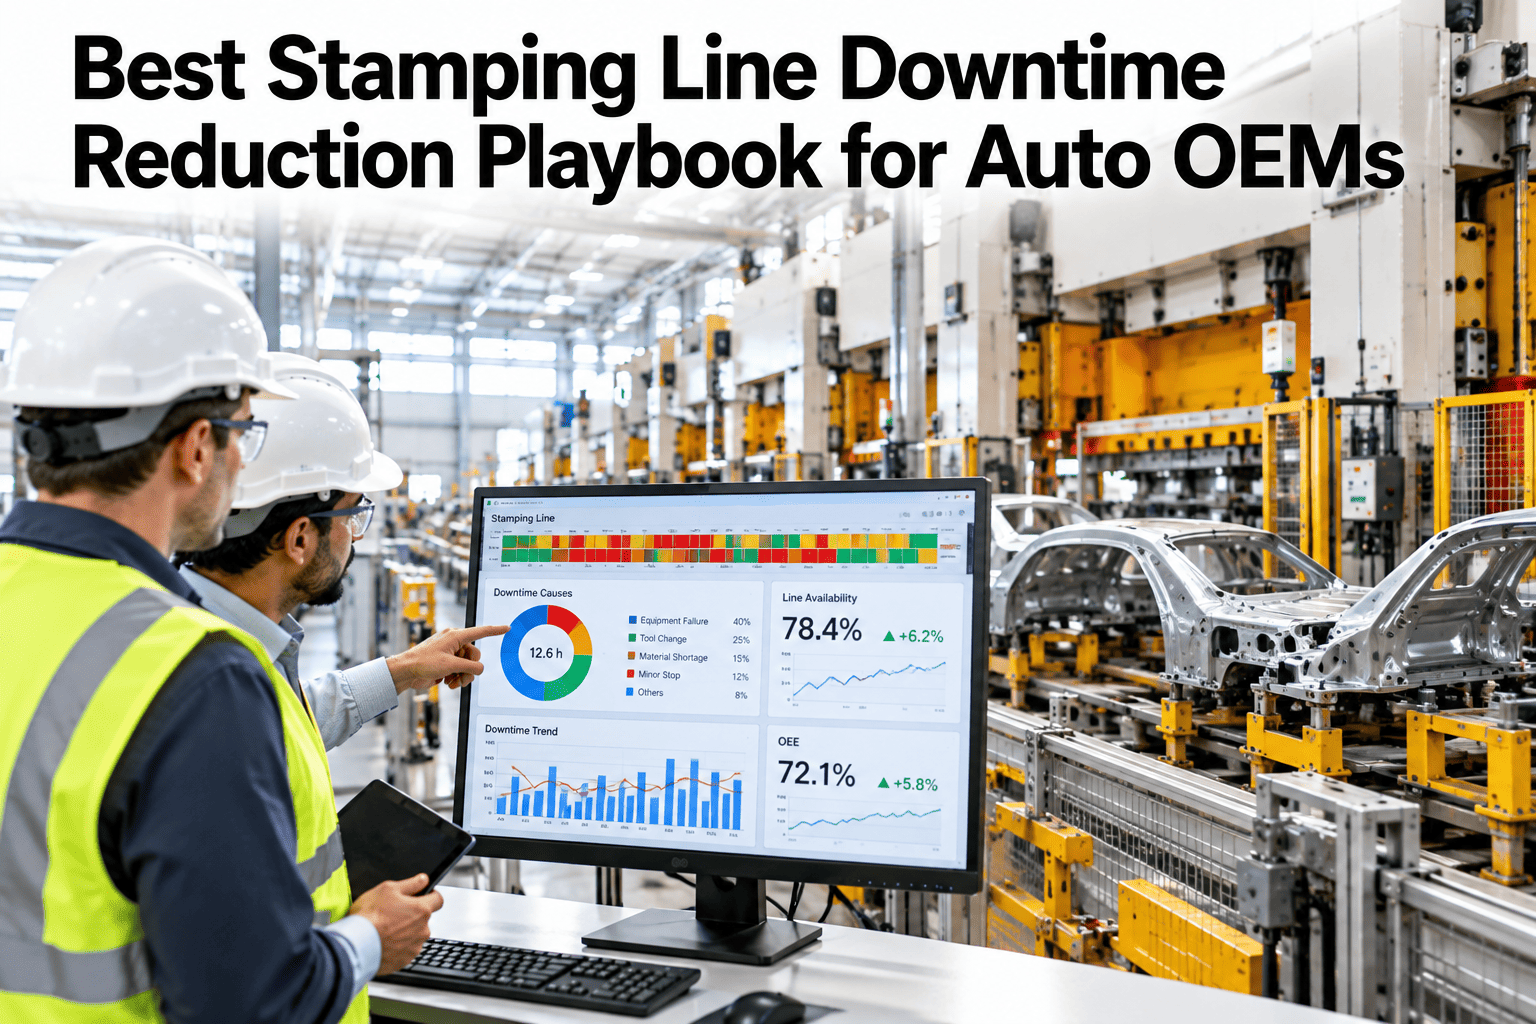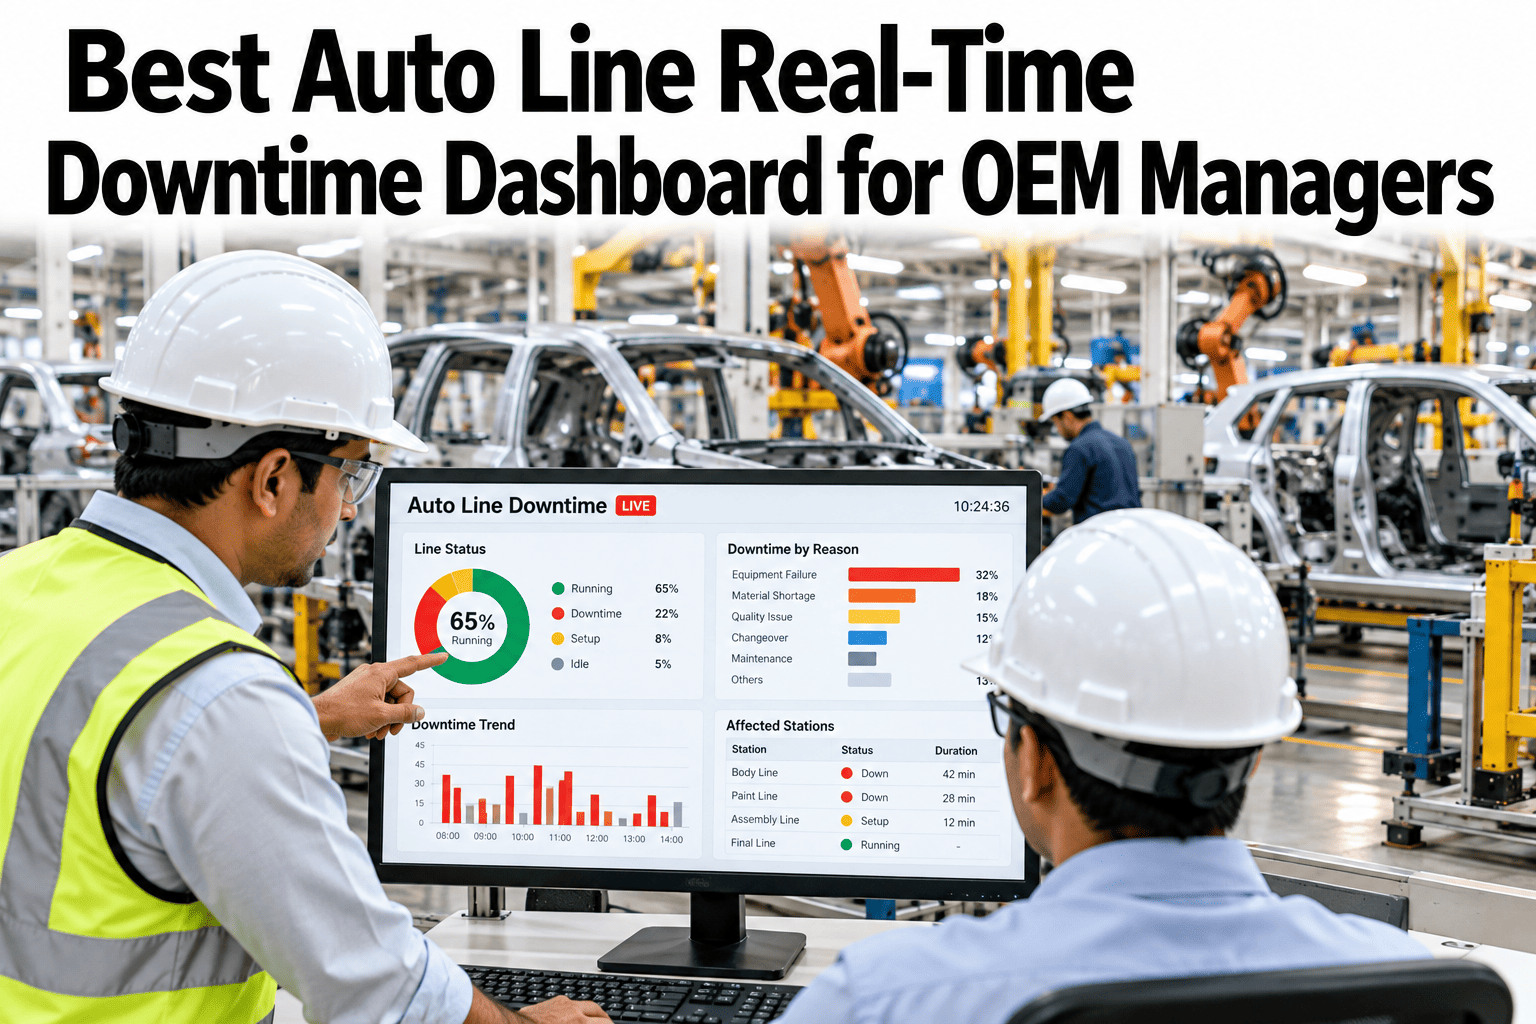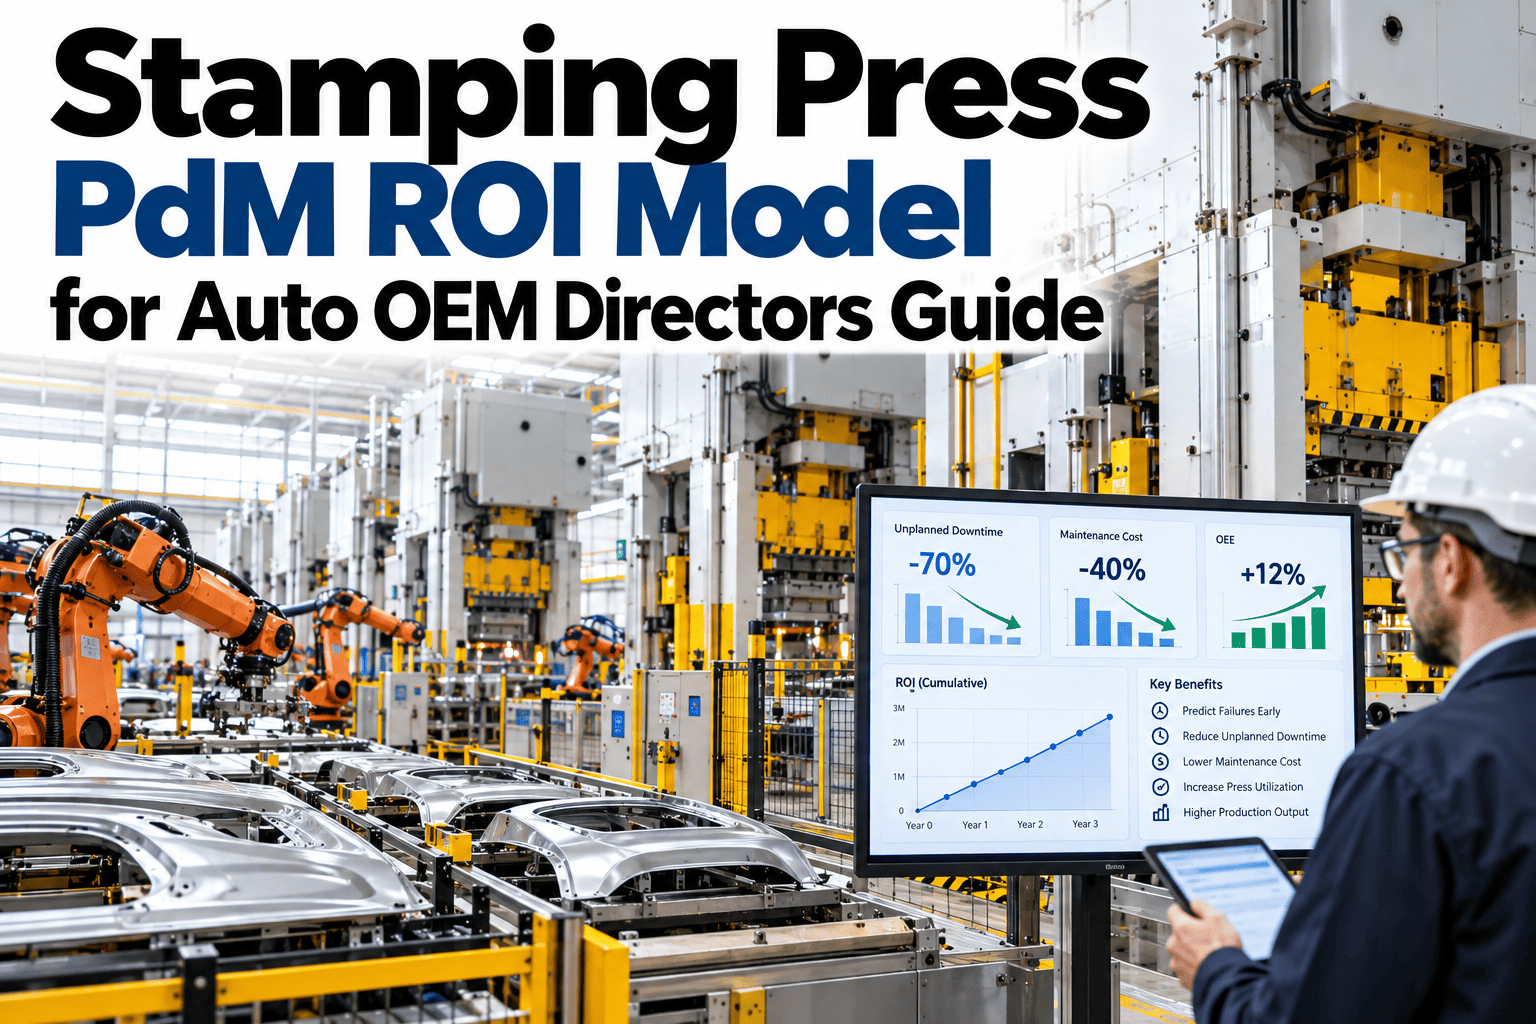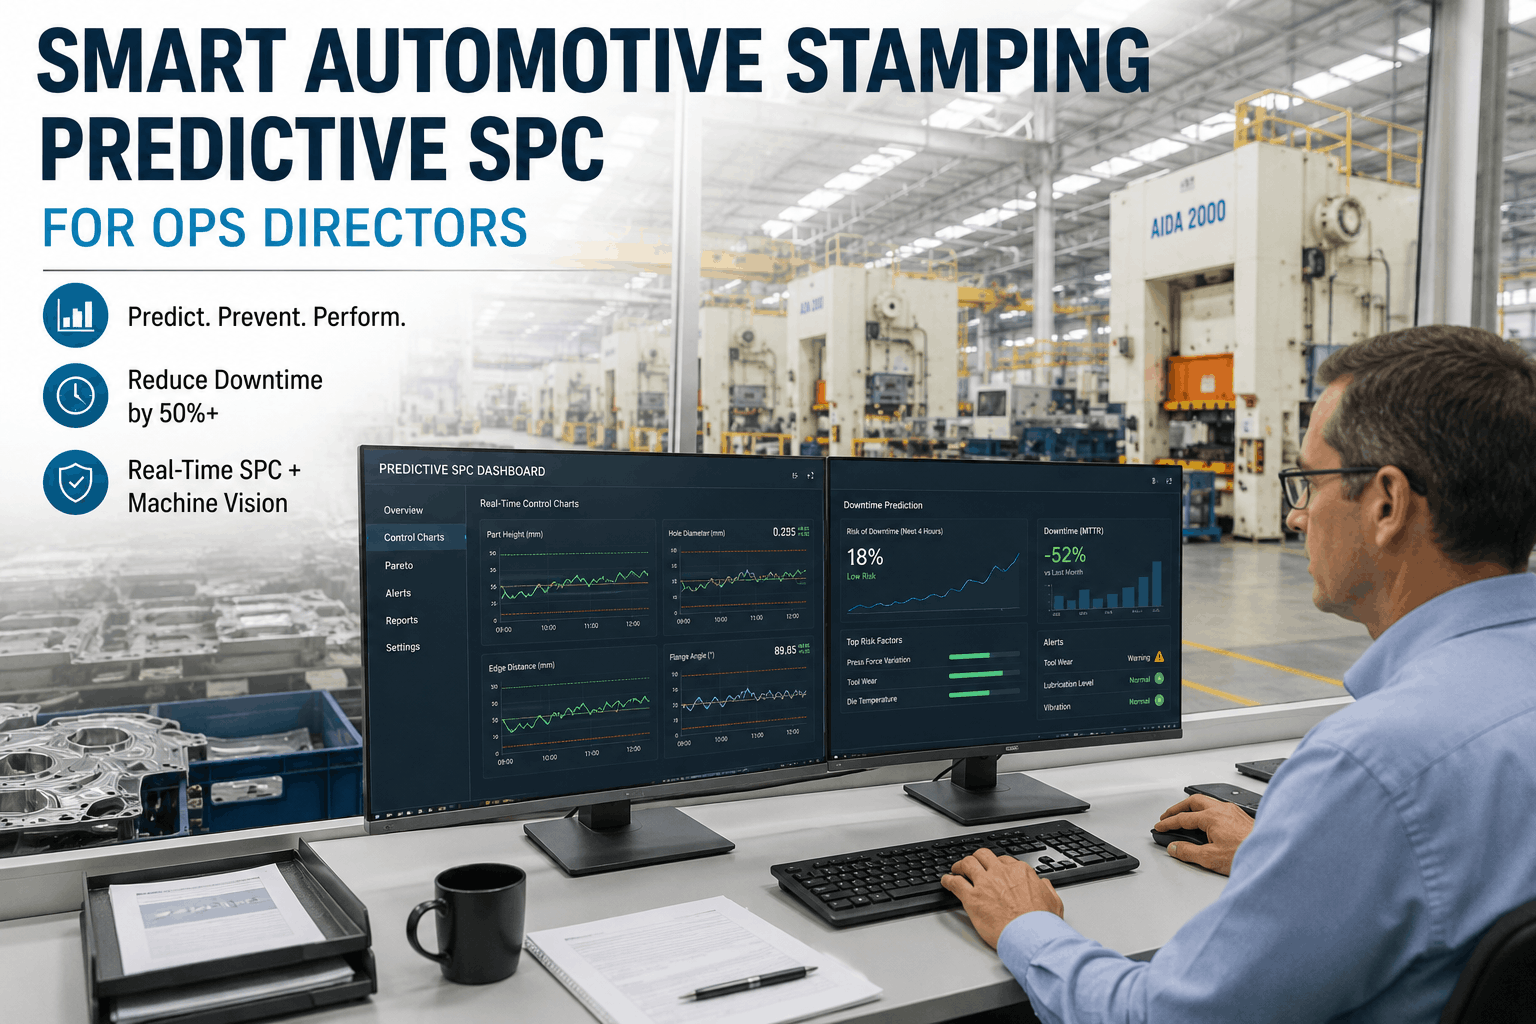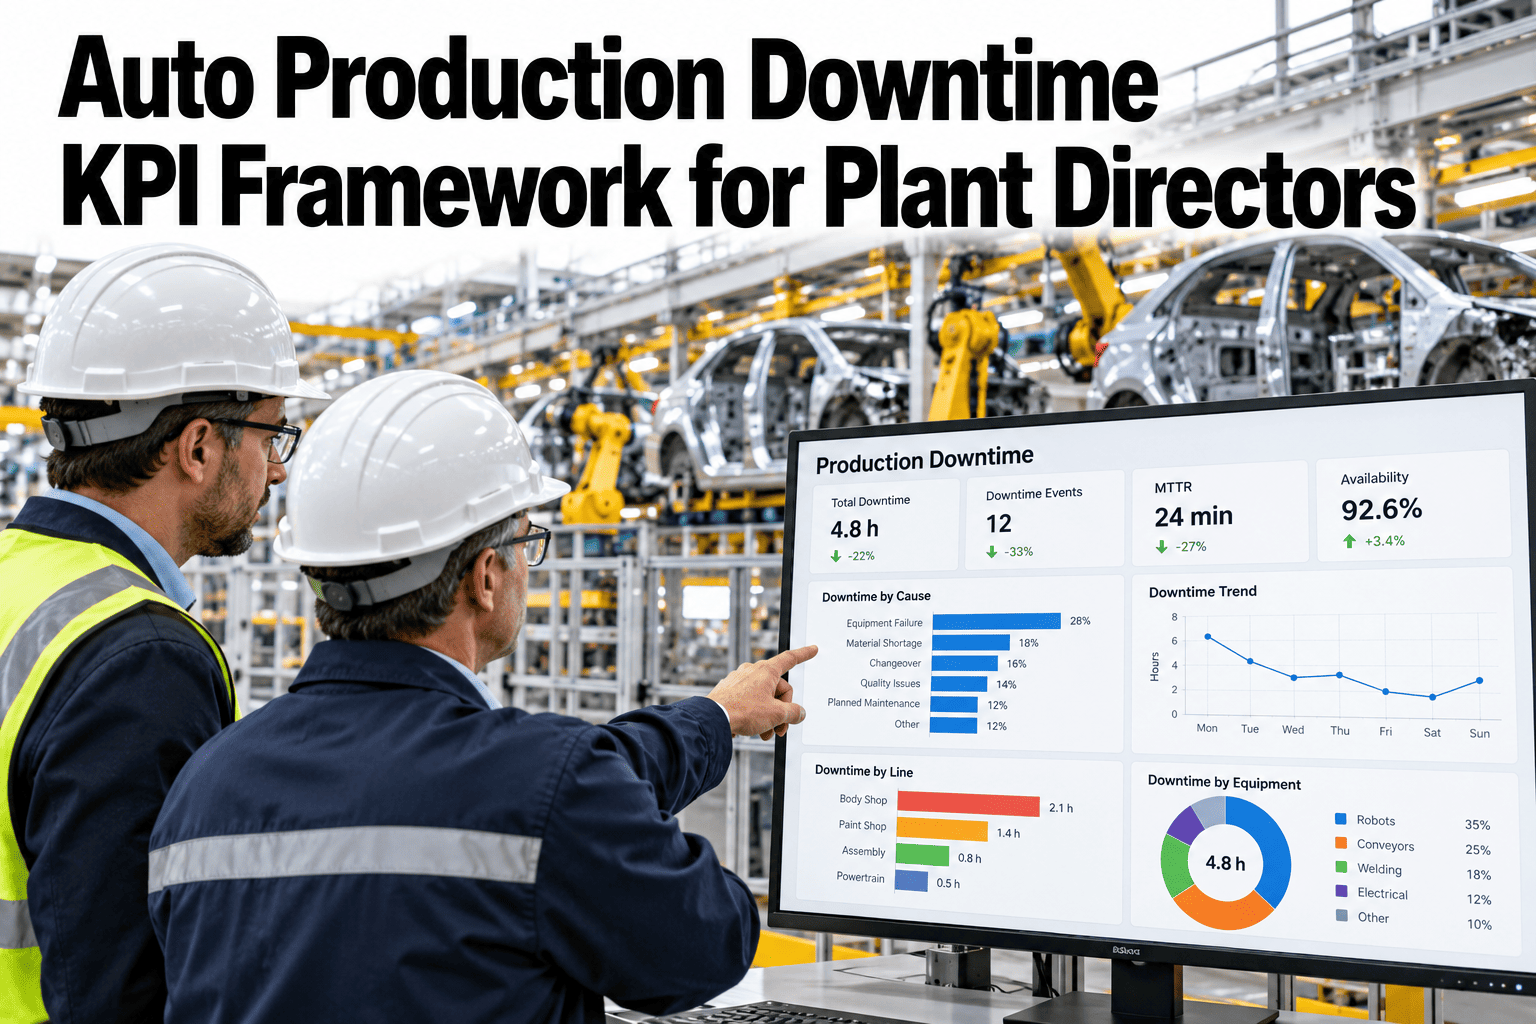
Plant directors reviewing downtime usually get a dashboard with twelve metrics on it, and by the time the meeting is over nobody can say which three actually moved the needle last week. A downtime KPI framework works only when it narrows to the handful of numbers that predict a stoppage before it happens, not the full list a reporting tool happens to calculate. MTBF, MTTR, and a ranked top-loss category view, read together, usually tell a plant director more than the other nine metrics combined. See a condensed scorecard built from your own plant's downtime data.
Three Numbers a Plant Director Actually Needs
iFactory AI condenses downtime reporting into MTBF, MTTR, and a ranked top-loss category view, updated continuously from your existing systems.
More Metrics Usually Mean Less Clarity
A dashboard with twelve downtime metrics gives a plant director twelve things to glance at and zero things to act on in the same meeting, because the instinct to track everything comes from good intentions, not from a framework that ranks causes by impact and trend. MTBF shows whether reliability is improving or decaying, MTTR shows whether the response process is getting faster or slower, and a ranked top-loss view shows exactly where to point the next improvement project — together those three answer almost every question a director actually asks in a review.
Ranking Loss Categories, Not Just Totaling Them
A total downtime number tells a director how bad the week was. A ranked breakdown tells the director what to fix first.
Rank Your Own Loss Categories
Book a 30-minute session and see your own plant's downtime causes ranked by true impact, not raw event count.
MTBF and MTTR, Read Correctly
Both metrics matter, but reading them separately leads to the wrong conclusion more often than reading them together.
| Pattern | What It Suggests | Where to Look |
|---|---|---|
| High MTBF, high MTTR | Failures are rare but hard to diagnose when they occur | Technician training, spare parts access |
| Low MTBF, low MTTR | Frequent failures that are fast to resolve | Root cause of recurring fault, not the fix speed |
| Low MTBF, high MTTR | Both frequency and response time need attention | Highest-priority line for improvement focus |
| High MTBF, low MTTR | Reliable equipment with a well-tuned response process | Candidate for best-practice sharing to other lines |
What the Scorecard Replaces
Most plants already collect this data; the framework is about surfacing the right slice of it.
Weekly Spreadsheet Pulls
Manual exports replaced by a live scorecard refreshed from the same underlying data.
Equal-Weight Dashboards
Twelve equally sized tiles replaced by three ranked, trend-aware metrics.
Line-Level Silos
Separate line reports rolled up into one plant-level director view.
Lagging Monthly Reviews
Month-end reporting replaced by a continuously updated trend line.
Rolling Out the Scorecard
iFactory AI connects directly to your existing CMMS, MES, and downtime logging tools rather than asking operators to log data twice.
Expert Review
Plant directors who switch to a three-metric framework stop spending review time debating which number is accurate and start spending it on the top-ranked cause, because the ranking itself resolves the argument about where attention should go first.
Frequently Asked Questions
Does this replace our existing CMMS reporting?
No, it sits on top of your existing CMMS and MES data rather than replacing the system of record, condensing what is already captured into a director-level view. Support can confirm compatibility with your current system.
How often does the ranking update?
The scorecard refreshes continuously as new downtime events are logged, so the ranking a director sees in a Monday review reflects the latest week rather than a month-old snapshot.
Can this scorecard roll up multiple plants?
Yes, individual line and plant scorecards can roll up to a network-level view for directors overseeing more than one site, while still preserving plant-level detail underneath. See a multi-plant rollup on a call.
What counts as a loss category in the ranking?
Categories are configured to match how your plant already classifies downtime causes, whether that is changeover, tooling, material, or equipment-specific, rather than a generic external taxonomy.
Does MTTR tracking require new technician workflows?
No, response time is calculated from existing work order timestamps already logged in the CMMS, so no additional data entry is required from technicians. Ask support how MTTR is calculated from your data.
Give Your Director Review Three Numbers That Matter
iFactory AI condenses downtime reporting into a ranked scorecard built from your own plant's data. Book a walkthrough to see it live.