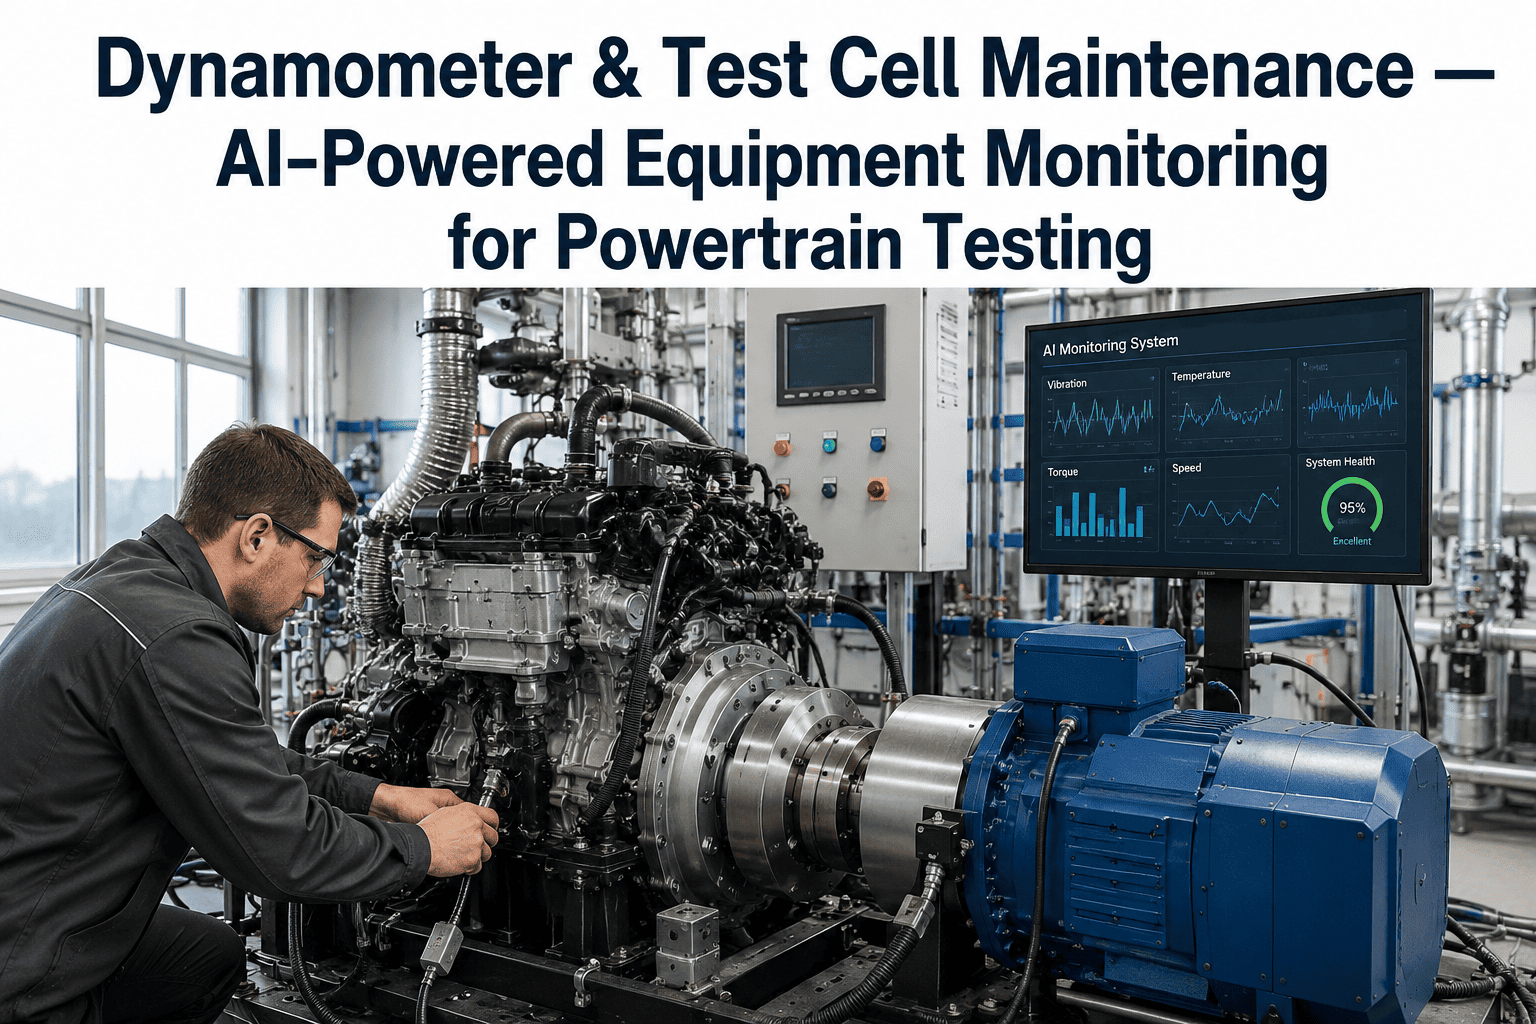
A powertrain validation lab running six engine dynamometer cells used to lose an entire test week every quarter to a coupling failure nobody saw coming — a torque cell that drifted out of calibration mid-program, a cooling tower that fouled without warning, an absorber unit that seized two days before an emissions certification deadline. Facilities running reactive maintenance on dynamometer fleets typically see 18% to 24% of operating hours lost to unplanned downtime, while AI-driven condition monitoring on vibration, temperature, and oil analysis pulls that down to 3% to 4%. That gap is the difference between hitting a validation milestone and explaining a slip to program leadership, and it is why AI-powered dynamometer and test cell monitoring has moved from a nice-to-have to a scheduling requirement in powertrain labs.
Dynamometer & Test Cell Maintenance — Predict Failures Before They Cost a Validation Program a Week
AI-powered monitoring watches absorber units, cooling systems, couplings, and instrumentation continuously across every test cell — surfacing bearing wear, coolant degradation, and calibration drift while a test is still running instead of after it has already failed a program milestone.
The Blind Spots Standard Dyno Instrumentation Was Never Built to Catch
A dynamometer test cell already carries torque transducers, speed sensors, and thermocouples — but those instruments exist to characterize the engine or motor under test, not to characterize the health of the dyno itself. Bearing wear in the absorber unit, gradual coupling misalignment, cooling tower fouling, and load cell drift all develop slowly enough that a single test run looks normal, while the trend across dozens of runs tells a very different story. A maintenance manager reviewing pass/fail results per test has no mechanism to see that trend, because nobody is aggregating vibration signatures, bearing temperature slopes, and coolant flow rates across cells and across weeks.
The consequence shows up as sudden failures at the worst possible moment. Documented cases from powertrain plants show a single dynamometer failure reducing final test stage production capability by roughly 8% for the duration of the outage, with cost avoidance from catching related faults early estimated at $500,000 or more in equipment alone. A coast-down calibration check that fails mid-program, an absorber that cannot hold a steady-state load, or a coupling that starts transmitting vibration into the load cell all look identical from the outside — a red status light — until someone has torn the cell down to find out which one it actually is.
The Failure Timeline AI Monitoring Compresses Into a Warning Window
Every dynamometer failure mode has a signature that develops over days or weeks before it becomes a stoppage. AI monitoring's advantage is not detecting the failure — it is detecting the signature early enough that maintenance happens on a planned schedule instead of an emergency one.
A Maintenance Manager Should Never Learn About a Dyno Failure From a Stopped Test
See how continuous condition monitoring on absorber units, couplings, cooling systems, and instrumentation turns a surprise teardown into a scheduled maintenance window.
The Four Subsystems That Determine Whether a Test Cell Stays Available
A dynamometer is not a single machine — it is four interdependent subsystems, and a monitoring platform earns its keep by watching all four continuously rather than waiting for one of them to trip a hard limit.
What Changes When a Test Cell Fleet Moves From Calendar-Based to Condition-Based Maintenance
Calendar-based preventive maintenance replaces parts on a fixed schedule regardless of actual condition — sometimes too early, wasting a serviceable bearing, and sometimes too late, missing a failure that developed faster than the schedule assumed. Condition-based maintenance driven by continuous monitoring replaces that guesswork with an actual read on component health.
| Maintenance Dimension | Calendar-Based (Reactive) | AI Condition-Based |
|---|---|---|
| Detection window | After failure or at fixed interval | Days to weeks before failure |
| Unplanned downtime | 18% to 24% of operating hours | 3% to 4% of operating hours |
| Parts replaced | On schedule regardless of condition | Based on measured wear trend |
| Root cause visibility | Teardown required to diagnose | Component flagged before teardown |
| Calibration drift | Found at next scheduled check | Flagged as it develops |
| Program impact | Emergency reschedule, milestone risk | Maintenance scheduled around test calendar |
Seeing Every Cell's Health From One Dashboard Instead of Six Separate Logbooks
A lab with multiple test cells running different programs in parallel needs a single view of fleet health, not six independent maintenance logs that only get compared when something has already gone wrong. A fleet-level dashboard ranks cells by risk score, surfaces which absorber units are approaching their historical failure window, and tracks calibration currency across every load cell and thermocouple in the building — so a maintenance manager plans the week around actual equipment condition rather than guesswork carried over from the last shift handover.
Why a Degrading Dyno Quietly Corrupts the Test Data It Produces
The most expensive failure mode is not a stopped cell — it is a cell that keeps running while its instrumentation has drifted. A load cell reading 1.5% high, a coupling introducing torsional noise into a torque signal, or a thermocouple lagging actual temperature by several seconds can all produce a complete, plausible-looking data set that is quietly wrong. Continuous monitoring catches the drift at the source, protecting the validity of every test run collected on that cell until the fault is corrected — which matters more in an emissions certification or durability program than almost anything else the lab does that week.
Questions Maintenance Managers Ask About AI-Powered Dynamometer Monitoring
Stop Losing Test Weeks to Failures a Trend Line Already Knew About
Continuous monitoring across absorber units, couplings, cooling systems, and instrumentation — turning surprise teardowns into scheduled maintenance windows that protect the test program calendar.