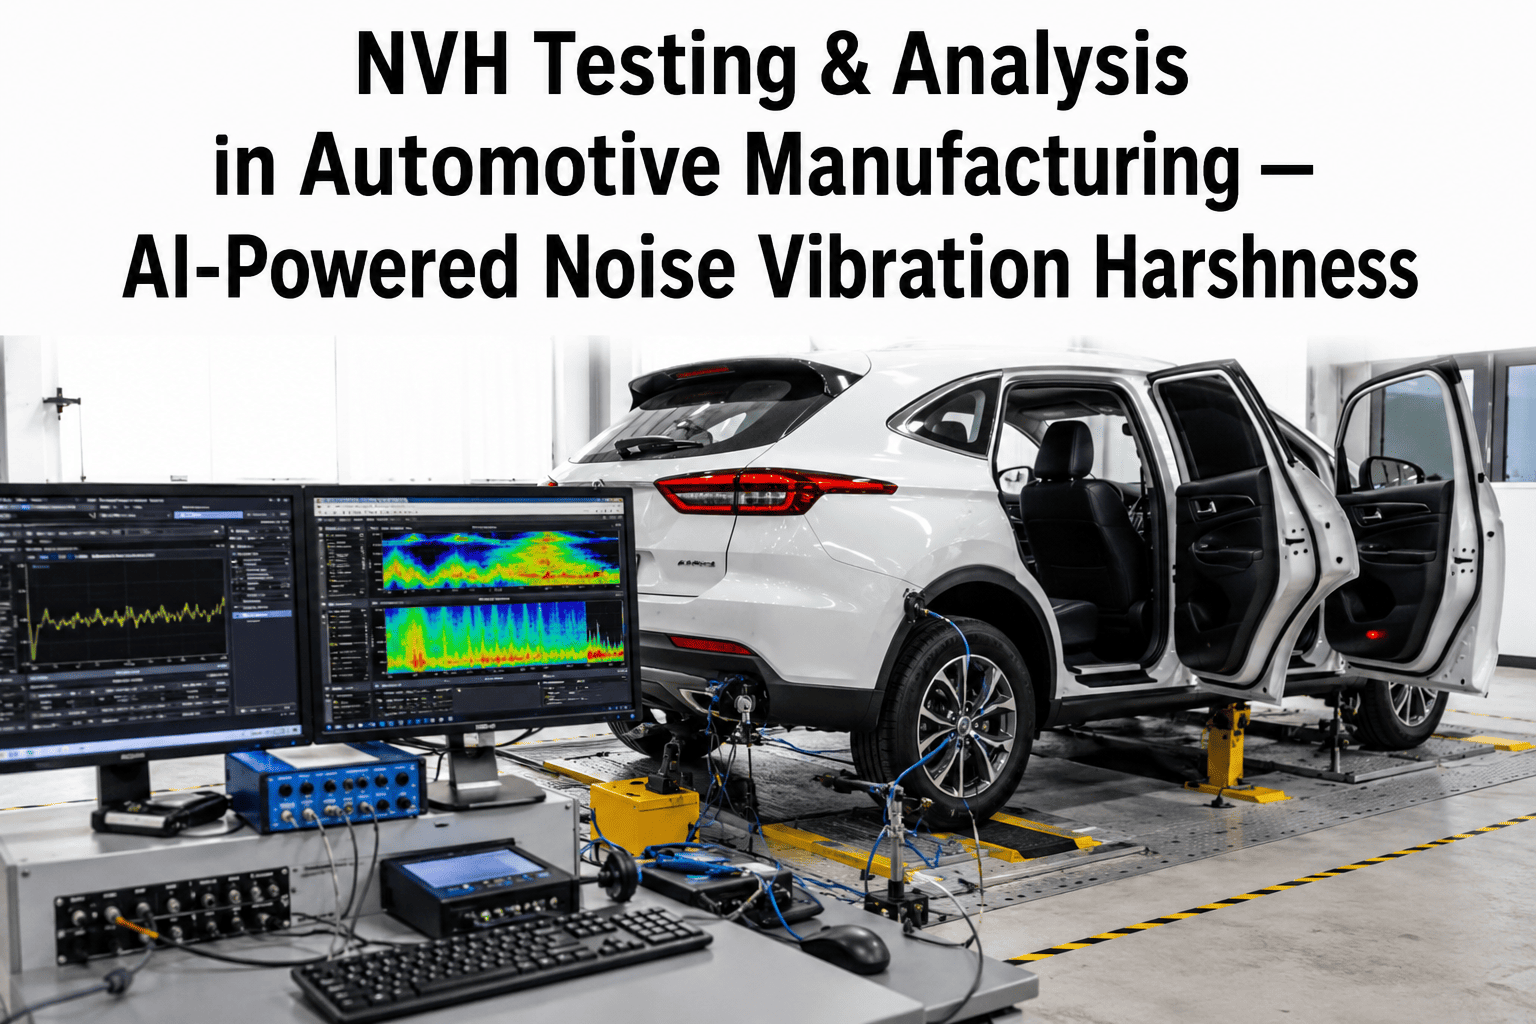
NVH Testing & Analysis in Automotive Manufacturing — AI-Powered Noise Vibration Harshness

By James Smith on July 24, 2026

automotive-nvh-noise-vibration-harshness-testing-ai

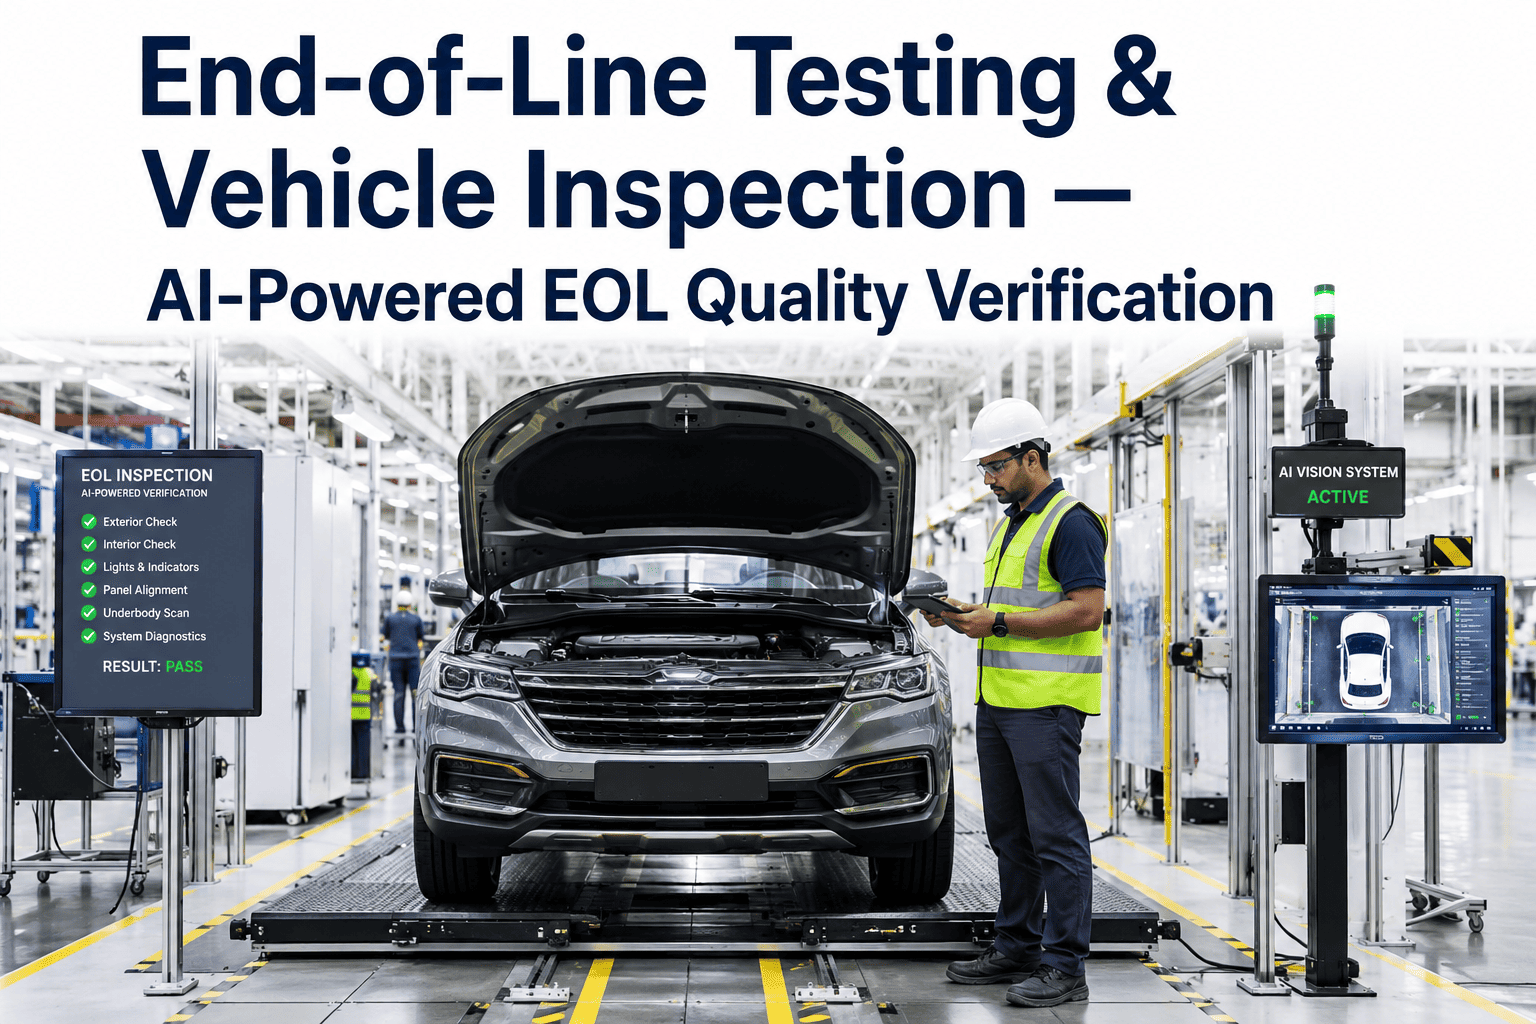
A process engineer standing at the end-of-line NVH station knows a specific kind of frustration — a vehicle fails the noise, vibration, and harshness check, the acoustic signature clearly shows an abnormal peak at a specific frequency, and yet tracing that peak back to a torque spec on a bracket bolt three stations upstream can take days of manual correlation across separate assembly logs. Every abnormal NVH signature has a root cause somewhere in the assembly process — a fastener torque, a gasket seating pressure, a bearing preload — but finding it manually means treating each failed vehicle as its own investigation. AI-powered NVH testing changes that by correlating end-of-line acoustic signatures directly against upstream assembly parameters, turning a days-long root cause hunt into a flagged correlation the moment the signature appears.

NVH TESTING · ACOUSTIC ANALYSIS · AI ROOT CAUSE

NVH Testing & Analysis — AI-Powered Noise, Vibration and Harshness Detection in Production

AI-driven NVH analysis correlates end-of-line acoustic and vibration signatures with the exact assembly parameters that produced them — identifying root cause in minutes instead of days and catching a drifting process before it produces a wave of failed vehicles.

READING A NOISE SIGNATURE

What an Abnormal Frequency Peak Is Actually Telling the Process Engineer

Every NVH signature is a frequency spectrum, and a healthy vehicle produces a predictable, repeatable pattern across that spectrum. An abnormal peak at a specific frequency band is rarely random — it typically maps back to a rotating component's operating speed, a resonance in a specific structural panel, or a looseness at a known interface, which is why an experienced NVH engineer can often guess the general source of a problem just from where the peak sits.


Abnormal amplitude peak flagged against the expected baseline spectrum
FROM SIGNATURE TO ROOT CAUSE

Why Manual Correlation Between Sound and Assembly Data Takes So Long

The technical difficulty in production NVH work has never been detecting the abnormal signature — end-of-line acoustic test stations are good at that already. The difficulty is connecting that signature back to a specific assembly event on a specific vehicle, because the acoustic data and the assembly process data typically live in entirely separate systems, recorded by different equipment, on different timescales. A process engineer chasing a root cause manually has to pull torque logs, gasket seating records, and bearing preload data for the affected vehicle, then compare that against a healthy reference vehicle, one parameter at a time.

AI-powered analysis shortens that chain by ingesting both data streams continuously and building the correlation automatically — so when a vehicle's end-of-line signature shows an abnormal peak, the platform has already checked it against every upstream assembly parameter recorded for that specific vehicle identification number and surfaced the parameters that deviated from the healthy baseline. What used to be a multi-day investigation becomes a flagged candidate list the moment the vehicle leaves the acoustic test station.

Stop Investigating NVH Failures One Vehicle at a Time

See how AI correlation connects an abnormal acoustic signature directly back to the assembly parameter that caused it.

HOW THE CORRELATION WORKS

Four Steps From Acoustic Test to Confirmed Root Cause

Step 1
End-of-Line Signature Capture
Acoustic and vibration data is captured for every vehicle at the end-of-line test station and tagged to its unique vehicle identification number.
Step 2
Baseline Comparison
The signature is compared against a healthy baseline spectrum for that vehicle configuration, flagging any amplitude peak outside the expected tolerance band.
Step 3
Assembly Parameter Pull
Every recorded assembly parameter for that same vehicle identification number — torque, preload, seating pressure — is pulled and compared against its own healthy baseline.
Step 4
Correlated Candidate List
Parameters that deviated in a way historically associated with the flagged frequency band are ranked and surfaced to the process engineer as root cause candidates.
WHERE NVH ISSUES ORIGINATE

The Assembly Interfaces Production NVH Problems Trace Back To Most Often

Fastener Torque
Under-torqued brackets and panel attachments are a leading source of buzz and rattle signatures that only appear once a vehicle is in motion.
Bearing Preload
Incorrect wheel bearing or driveline bearing preload produces a distinct frequency signature tied directly to rotational speed.
Gasket & Seal Seating
Inconsistent seating pressure on door and body seals changes wind noise and cabin acoustic transmission in ways that show up clearly in an acoustic spectrum.
Powertrain Mount Alignment
Mount misalignment shifts resonance behavior across the whole structure, often producing a signature that looks like a component fault but is actually an installation issue.
EV AND HYBRID NVH

Why Quieter Powertrains Have Made Every Small NVH Issue Louder

As internal combustion engine noise has disappeared from more of the vehicle lineup, sounds that were previously masked by engine noise are now the dominant acoustic signature a customer notices — which is a large part of why NVH and BSR quality has become a higher-visibility issue across the industry in recent years. A production line that used to tolerate a marginal signature because it was inaudible under engine noise on a combustion vehicle may find that exact same signature is now the first thing a customer complains about on the electric version of the same platform.

FREQUENTLY ASKED QUESTIONS

Questions Process Engineers Ask About AI-Powered NVH Testing

Does this replace the end-of-line acoustic test station, or work with the existing one?
It works with the existing acoustic test station rather than replacing it — the platform ingests the signature data the station already produces and adds the correlation layer against assembly process data, so the underlying test equipment and pass/fail thresholds stay in place. Book a demo to see integration with your current end-of-line equipment.
How does the platform know which assembly parameters actually caused a specific frequency signature?
The correlation model is trained on your own historical data — vehicles with known confirmed root causes for past NVH issues — building a pattern library that links specific frequency bands to specific assembly parameter deviations over time, which improves in accuracy as more confirmed root causes are logged. Contact support to discuss how much historical data your line currently has available.
Can this help with squeak and rattle issues as well as pure vibration or noise signatures?
Yes — buzz, squeak, and rattle signatures share the same underlying acoustic and vibration data streams as broader NVH testing, and many production lines run correlation for both under the same platform rather than treating them as separate monitoring problems. Book a session to review coverage for both NVH and BSR signatures.
Does this work for electric and hybrid powertrain lines, which have different noise characteristics?
Yes — the baseline spectrum and correlation model are built per vehicle configuration, so an EV or hybrid line gets its own baseline reflecting the absence of combustion engine noise, rather than being compared against a baseline built for a conventional powertrain. Talk to support about setting up a baseline for an electric or hybrid platform.
How quickly does the platform surface a root cause candidate after a failed vehicle is flagged?
The correlation runs automatically as soon as both the acoustic signature and the assembly parameter data for that vehicle identification number are available, typically surfacing a ranked candidate list within minutes rather than the days a manual investigation would take. Book a demo to see the turnaround time on a sample case.
ACOUSTIC SIGNATURE · ASSEMBLY DATA · ROOT CAUSE — ONE CORRELATION

Turn a Days-Long NVH Investigation Into a Flagged Root Cause

AI correlation between end-of-line acoustic signatures and upstream assembly parameters — catching a process drift before it produces a wave of failed vehicles.
Share This Story, Choose Your Platform!