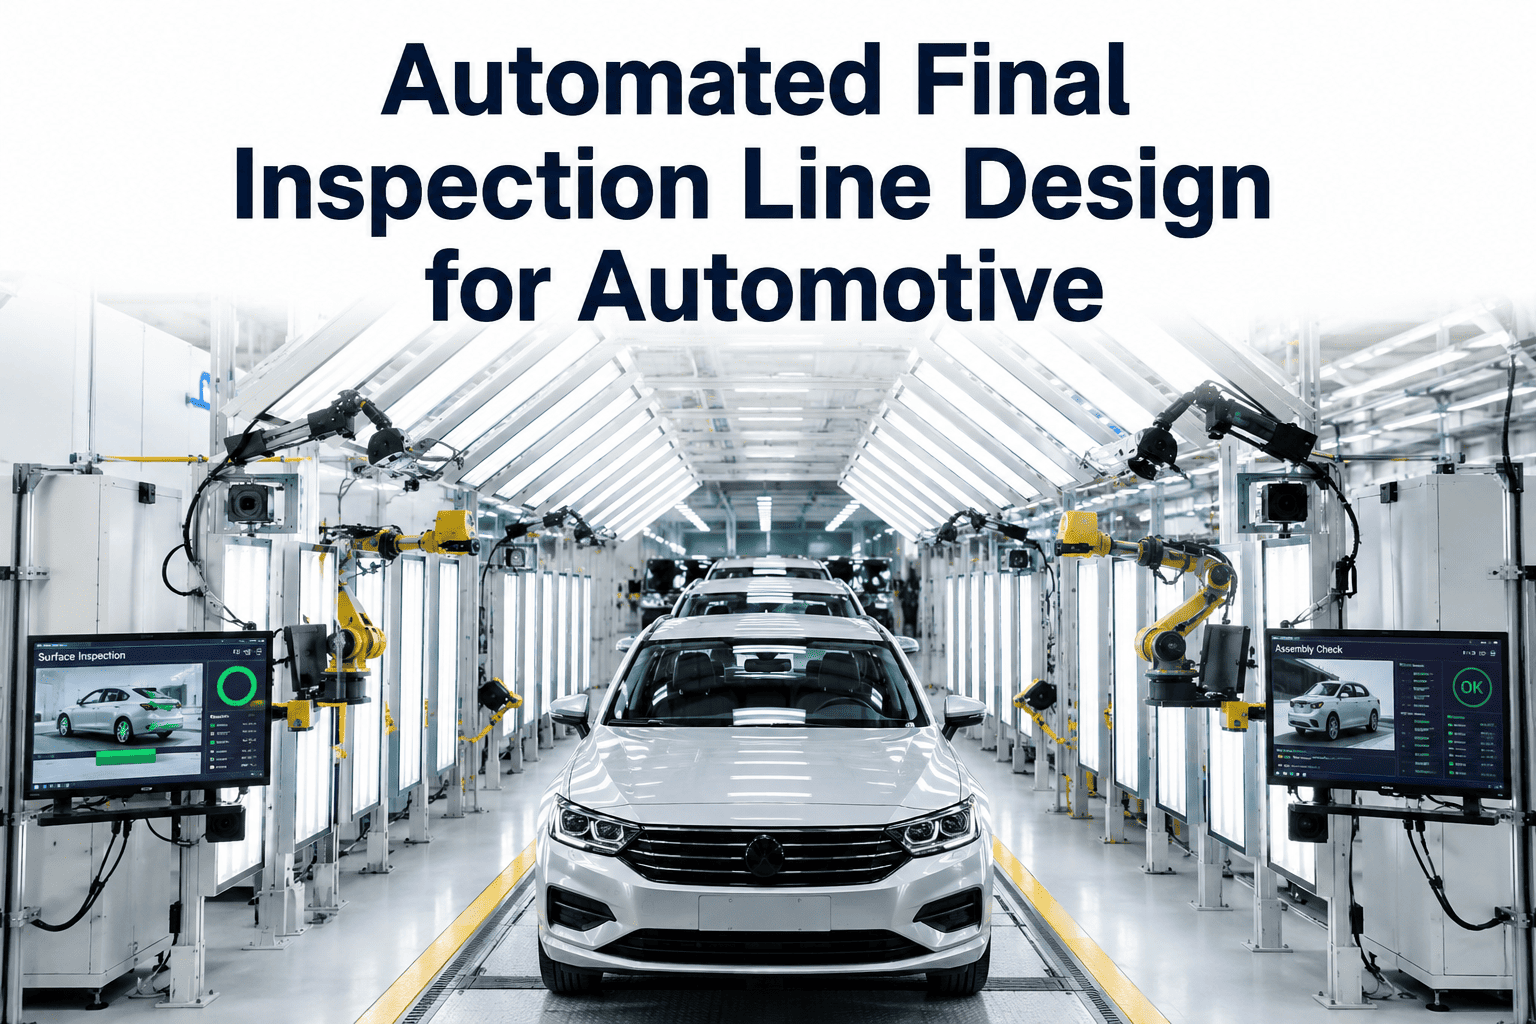
Final inspection is supposed to be the last check before a vehicle leaves the plant, not the place where finished units pile up waiting their turn. When one inspection station has to clear every vehicle the line produces, any small slowdown there ripples back through the whole plant, because nothing downstream can move until that single gate clears. Auto OEM operations teams who want to see their own final inspection queue mapped against actual throughput can review a bottleneck analysis using their own line data with iFactory AI.
One Inspection Gate Should Never Set the Pace for the Whole Line
iFactory AI maps final inspection load against line output, designs parallel-station capacity, and automates defect capture so the last gate stops being the slowest one.
How a Single Gate Becomes the Line's Real Constraint
A line can run every upstream station at full rate and still finish fewer vehicles per shift than it should, simply because one final inspection point cannot process units as fast as they arrive. The gap shows up as a growing queue of finished vehicles waiting for their last check, not as a slowdown anywhere visible upstream.
Three Ways to Close the Gap Without Slowing the Line
Find Out How Big Your Inspection Gap Actually Is
Share your line rate and inspection cycle time and a short session will show whether the gap is structural or seasonal.
Designing a Parallel-Station Layout That Actually Balances
Why Automated Defect Capture Changes the Math
A large share of final inspection time often goes to checks that are well-defined and repetitive — surface scratches, panel gaps, missing trim — exactly the kind of defect a vision system can capture consistently without fatigue. Automating that slice does not remove the inspector, it removes the part of their job that does not need human judgment, freeing real time for the ambiguous calls that do.
Plants that automate the repetitive share first, before adding a second physical station, sometimes close most of the gap without any new floor space at all, a sequencing iFactory AI's team can help assess against your own defect mix.
A Composite Scenario: The Backlog That Only Showed Up on Fridays
A plant's final inspection queue looked fine most days, but consistently backed up by mid-afternoon every Friday, when a higher-complexity trim variant ran. The station had enough average capacity across the week, but not enough peak capacity for that single variant's longer inspection time. Adding a dynamic routing rule that shifted lighter-variant vehicles to a secondary check point on Fridays specifically, rather than adding permanent capacity for a once-a-week spike, cleared the backlog without new headcount.
When the Fix Is Upstream, Not at the Gate Itself
Sometimes the real reason final inspection runs slow is not the station at all — it is a defect rate high enough that nearly every vehicle needs extra scrutiny or rework before it can pass. In that case, adding inspection capacity treats the symptom while the actual fix sits upstream at whichever station is generating the defects that inspection keeps catching late.
Frequently Asked Questions
Stop Letting One Station Set the Pace for the Whole Line
iFactory AI maps your inspection queue against real throughput and designs the fix that fits your layout. Book a walkthrough with your own line data.