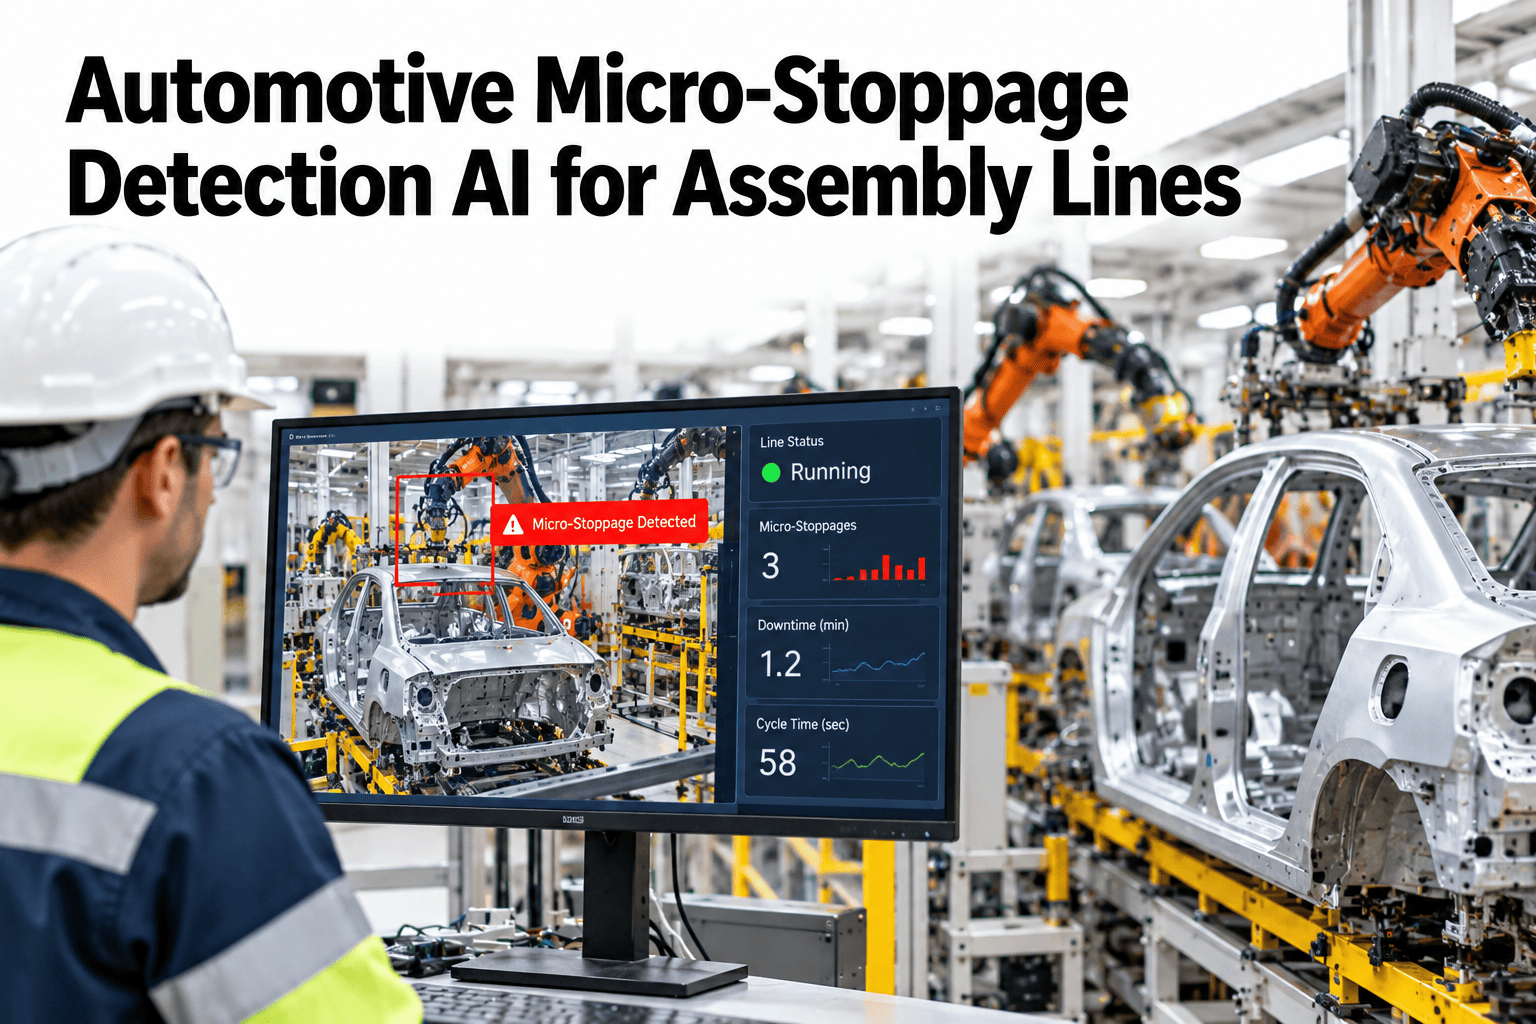
A stoppage that lasts twenty seconds doesn't trigger most downtime logging systems, which are tuned to catch stops measured in minutes, yet an assembly line can accumulate dozens of these sub-minute events in a single shift. None of them look significant individually. Clustered together by pattern, they often point to the exact same root cause repeating itself, invisible to a manual review that only sees isolated, forgettable blips. Sub-minute event capture, pattern clustering and root-cause attribution surface this hidden OEE loss that manual tracking structurally cannot catch. Operations teams can review their own micro-stoppage patterns in a short session.
Dozens of Sub-Minute Stops a Shift, Invisible to Manual Tracking
iFactory captures every sub-minute stop and clusters them by pattern, revealing root causes manual logging structurally misses.
Why Manual Tracking Structurally Misses This
A twenty-second stop doesn't last long enough for anyone to log it manually, and even when it does trigger a system entry, nobody has time to compare it against dozens of other similarly brief events to find the pattern.
| Capability | What It Catches | Why Manual Review Misses It |
|---|---|---|
| Sub-minute event capture | Every stop, even a few seconds long | Too brief and frequent to log manually in real time |
| Pattern clustering | Groups of events sharing timing, duration or location signatures | Comparing dozens of brief events for a shared pattern isn't feasible by hand |
| Root-cause attribution | The likely shared cause behind a cluster of similar stops | Requires correlating stop data against equipment and process signals simultaneously |
Find Out How Much Hidden Downtime You're Carrying
Book a 30-minute session and iFactory will capture and cluster your own micro-stop data to surface hidden patterns.
Three Layers of Micro-Stoppage Detection
Sub-Minute Event Capture
Every stop, regardless of duration, is logged automatically from equipment signals, no manual entry threshold to miss.
Pattern Clustering
Events are grouped by shared signatures like duration, station and timing, surfacing a pattern that would be invisible stop by stop.
Root-Cause Attribution
Clustered patterns are correlated against equipment and process data to point toward the likely shared cause.
Signals You're Carrying Hidden Micro-Stop Loss
Where iFactory Fits
iFactory captures, clusters and attributes micro-stops automatically, surfacing the hidden OEE loss manual tracking structurally cannot catch.
Automatic Sub-Minute Logging
Every stop event is captured directly from equipment signals, regardless of how brief.
Automated Pattern Clustering
Events sharing timing, duration or location signatures are grouped automatically, surfacing patterns continuously.
Root-Cause Correlation
Clustered events are correlated against process and equipment data to point toward a likely shared cause.
Hidden Loss Quantification
The cumulative time cost of micro-stops is quantified, making the case for addressing patterns that look trivial individually.
Reviewed by iFactory's Automotive Operations Analytics team for alignment with current hidden loss analytics practice. The cluster patterns shown are illustrative; actual clustering should be run against your own equipment signal data.
Frequently Asked Questions
What counts as a micro-stop versus a normal cycle pause?
This is defined by comparing actual stop duration against the station's expected cycle pattern, so a brief, abnormal interruption is distinguished from a normal part of the cycle rather than using a single fixed duration threshold. Support can help define this for your own stations.
How does pattern clustering avoid false groupings?
Clustering uses multiple shared characteristics, like duration, timing and station, together rather than a single loose criterion, which reduces the risk of grouping unrelated events as if they shared a cause.
Does this require new sensors on existing equipment?
Often not, since most modern equipment already generates signal data through its PLC that can be used for event detection without adding new hardware. See what your current equipment already provides in a short session.
How confident is the root-cause attribution?
Attribution is presented as a strong candidate correlation, not a certainty, and still requires engineering confirmation before acting, but it dramatically narrows the investigation compared to starting from dozens of unrelated-looking events.
How does this feed into our overall OEE reporting?
Micro-stop time is attributed to the performance or availability factor as appropriate, giving a more complete and accurate OEE picture than one built only from manually logged stops. Ask support how this integrates with your current OEE calculation.
Surface the OEE Loss Hiding in Plain Sight
iFactory captures and clusters every micro-stop to surface the patterns manual tracking misses. Book a walkthrough on your own line.