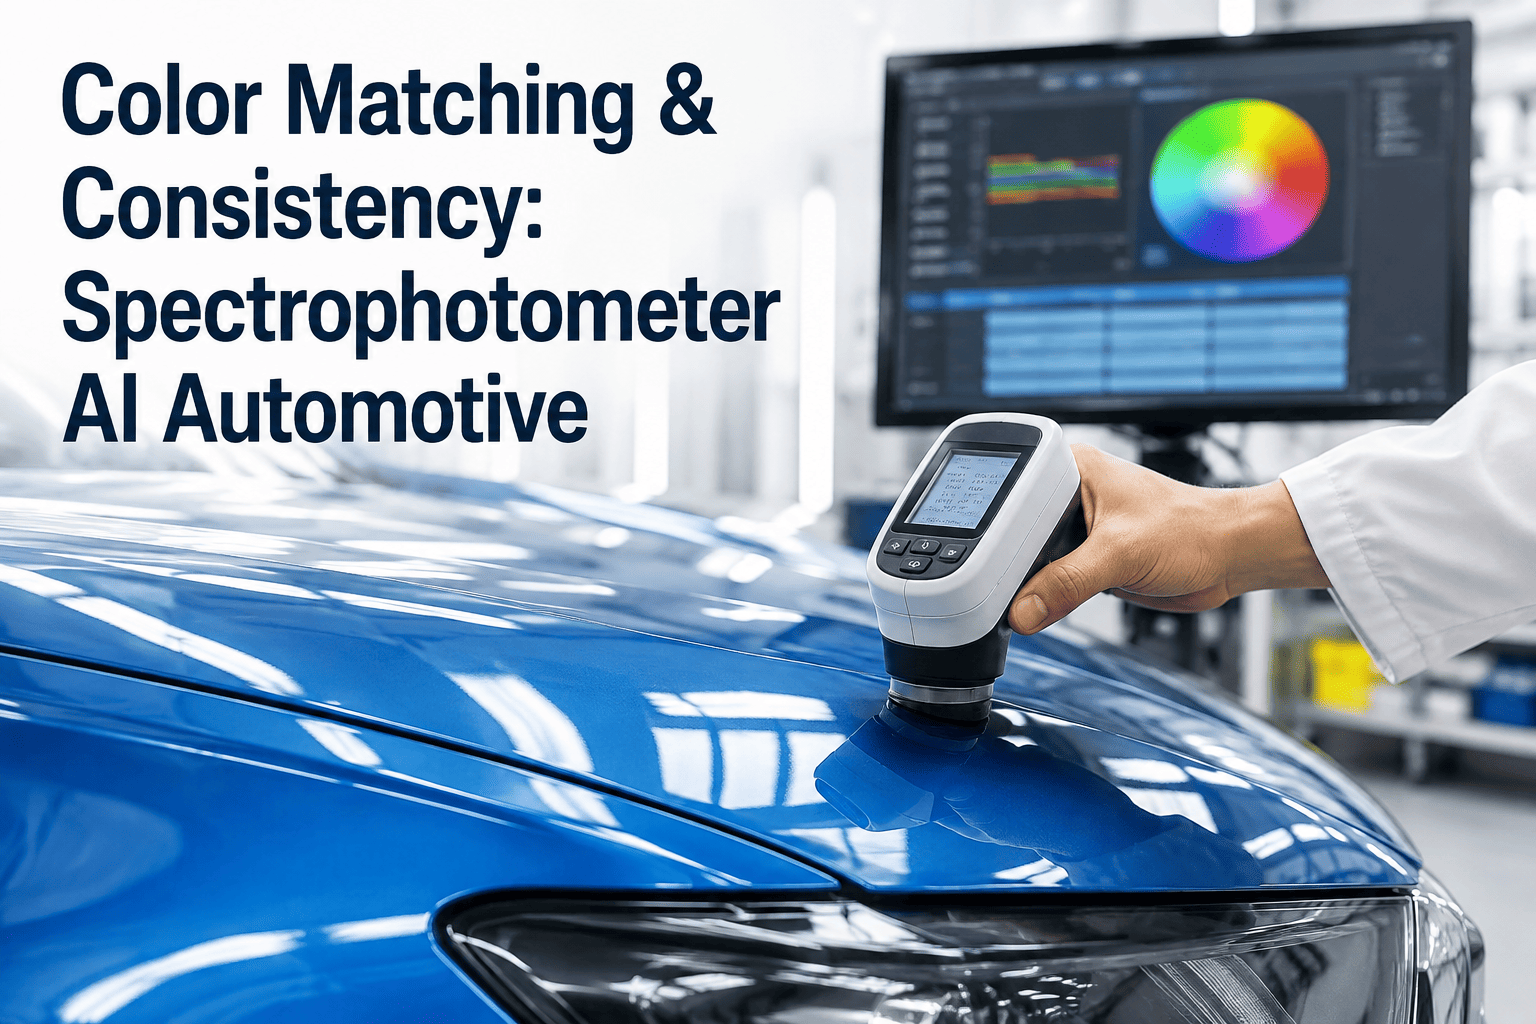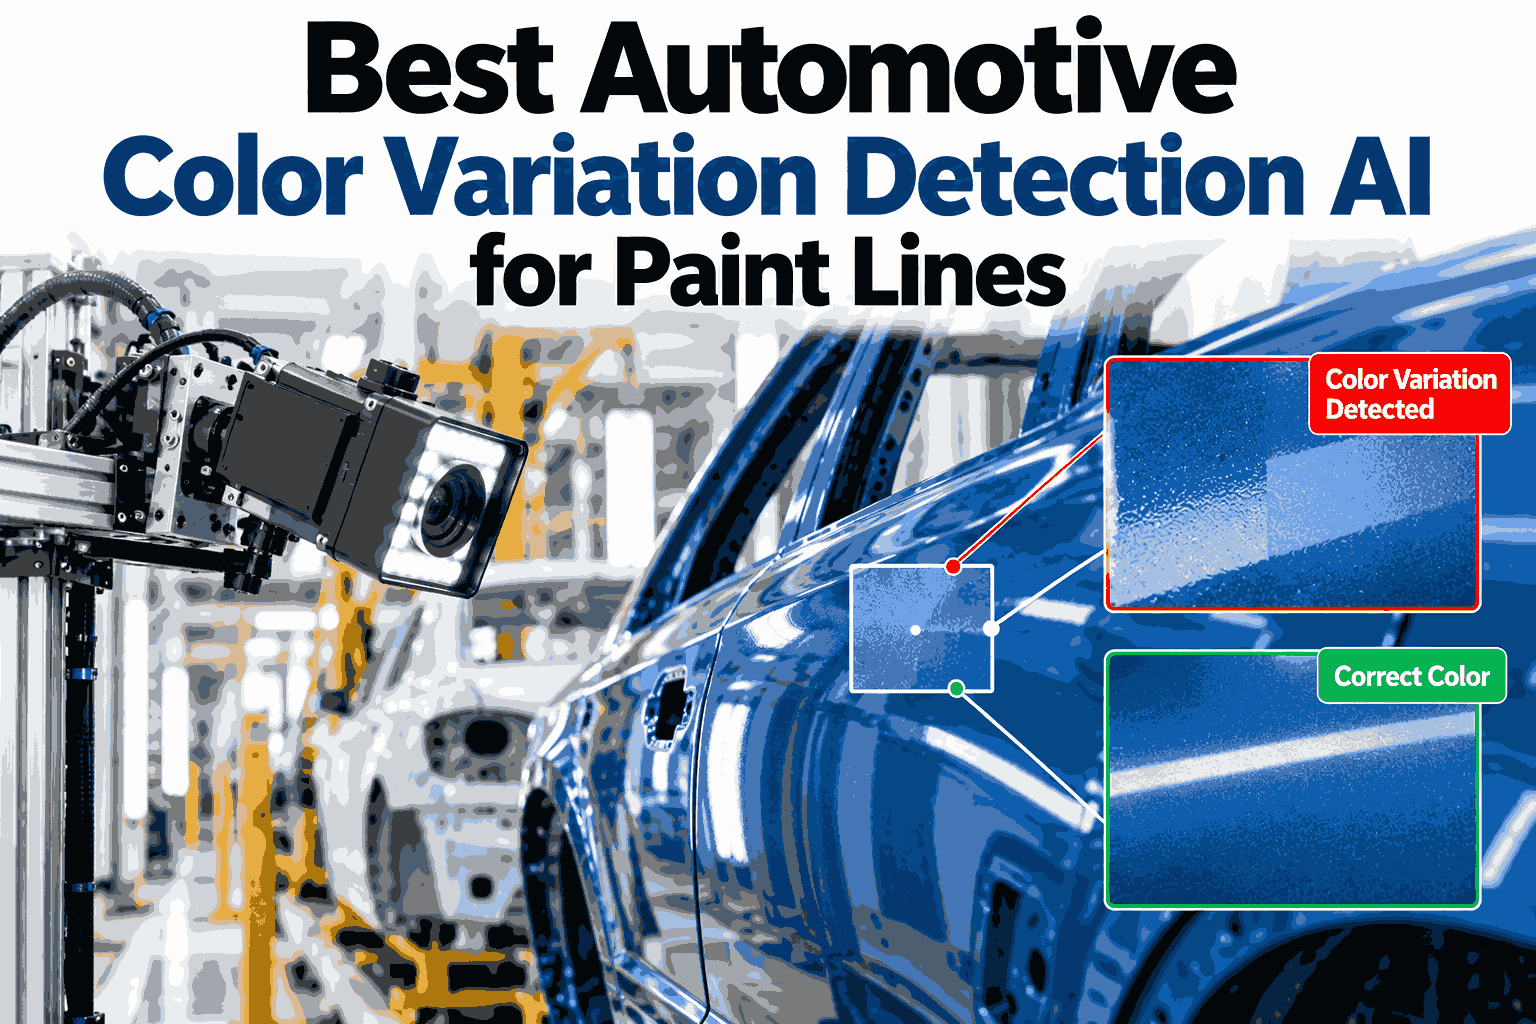
A bumper can leave the paint shop looking identical to the fender beside it and still clash once both sit under afternoon sun on a dealer lot. Color is judged by customers within seconds, and a small shift between panels, batches, or shifts is often enough to trigger a complaint or a costly repaint. Measuring that shift with a spectrophotometer is the easy part, while spotting the trend across thousands of readings is where most plants struggle. Paint teams looking for a smarter approach can watch iFactory AI track delta-E drift on real paint line data in a guided 30-minute session before shortlisting tools.
Catch Color Drift Before Two Panels Stop Matching
iFactory AI reads spectrophotometer data, monitors delta-E, and analyzes metallic effect so color variation is caught on the line instead of on the lot.
One Vehicle, Many Panels, One Color
A single car is painted across different substrates, sometimes on different lines or in different batches. Every panel has to land inside the same visual window.
Illustrative swatches. Real judgments come from measured values against your color standard.
Reading Delta-E Without Guesswork
Delta-E is a single number for the distance between two colors. A value near one is generally about what a trained eye can just notice, and plants set tighter or looser limits per color and panel.
Differences sit below what most customers would ever see, so no action is needed.
Differences appear side by side, so panels that sit next to each other deserve closer attention.
Differences show clearly in daylight and usually mean rework or a process fix.
Metallic Effect Changes With the Angle
Metallic and pearl paints shift as you move around the car. A reading from one angle can look perfect while another angle quietly drifts, which is why multi-angle data matters.
Near the viewer, where color looks brightest.
Mid angle, where flake orientation shows.
Steep angle, where the color deepens.
See Your Color Data Read Across Every Angle
Book a 30-minute demo and iFactory AI will show how spectrophotometer data, delta-E trends, and metallic effect work together on your own paint colors.
Where Variation Comes From
Most color drift traces back to a handful of causes. The table links each one to where it shows up and what the data reveals.
| Source | Where It Shows | What the Data Reveals |
|---|---|---|
| Paint batch change | Step change between batches | Jump in delta-E at the batch boundary |
| Film thickness | Panel zones with heavy or light coverage | Gradual lightness shift across the panel |
| Bell or spray setting | Metallic flake alignment | Flop and shade move while face stays steady |
| Oven profile | Gloss and hue after cure | Slow hue drift tied to temperature |
| Substrate difference | Plastic against metal panels | Consistent gap between panel types |
Drift Builds Quietly Across a Shift
No single reading looks alarming when the drift is slow. Tracked over time, the pattern is plain to see, and it crosses the limit before anyone notices.
Illustrative trend of delta-E across successive bodies. The goal is to act well before the limit line.
A Composite Scenario: The Bumper That Slowly Faded Away
A plant kept approving bumpers panel by panel, yet dealers reported a visible mismatch on one metallic color late in each week.
Illustrative example based on common paint line patterns, not a specific customer result.
What Good Color AI Should Deliver
Delivered Turnkey, Live in 6 to 12 Weeks
iFactory AI arrives pre-configured on an NVIDIA server with software pre-loaded. Rack it, connect power and Ethernet, and the team handles the rest.
Frequently Asked Questions
What does delta-E monitoring actually tell us?
It gives a single number for how far a measured panel sits from your color standard. Monitored over time, it shows whether color is stable, drifting, or jumping at a batch change. A live look at delta-E trends on your own colors makes the value clear.
Can it catch variation in metallic and pearl paints?
Yes, when the spectrophotometer measures at several angles. The system tracks face, flop, and shade separately, so a shift in flake behavior is caught even if straight-on color still looks acceptable to the eye.
Does it work with our existing spectrophotometers?
Plants rarely want to replace measurement hardware, so the software reads data from the instruments already installed. Review your current instrument setup with the iFactory AI team in one short call.
How does it help match plastic bumpers to metal panels?
Different substrates and coating lines respond differently to the same paint. The system compares panels from the same vehicle against one standard and highlights consistent gaps so teams can adjust the process that causes them.
How long does deployment take?
Delivery is turnkey and typically takes 6 to 12 weeks. The hardware arrives pre-configured, integration covers cabling, network, and plant systems, and the last phase trains your teams. Plan a rollout around your paint line schedule in a 30-minute conversation.
Keep Every Panel Matching From the First Body to the Last
iFactory AI turns spectrophotometer readings into early warnings on delta-E and metallic effect, so color stays consistent across panels, batches, and shifts. Book a walkthrough on your own paint data.