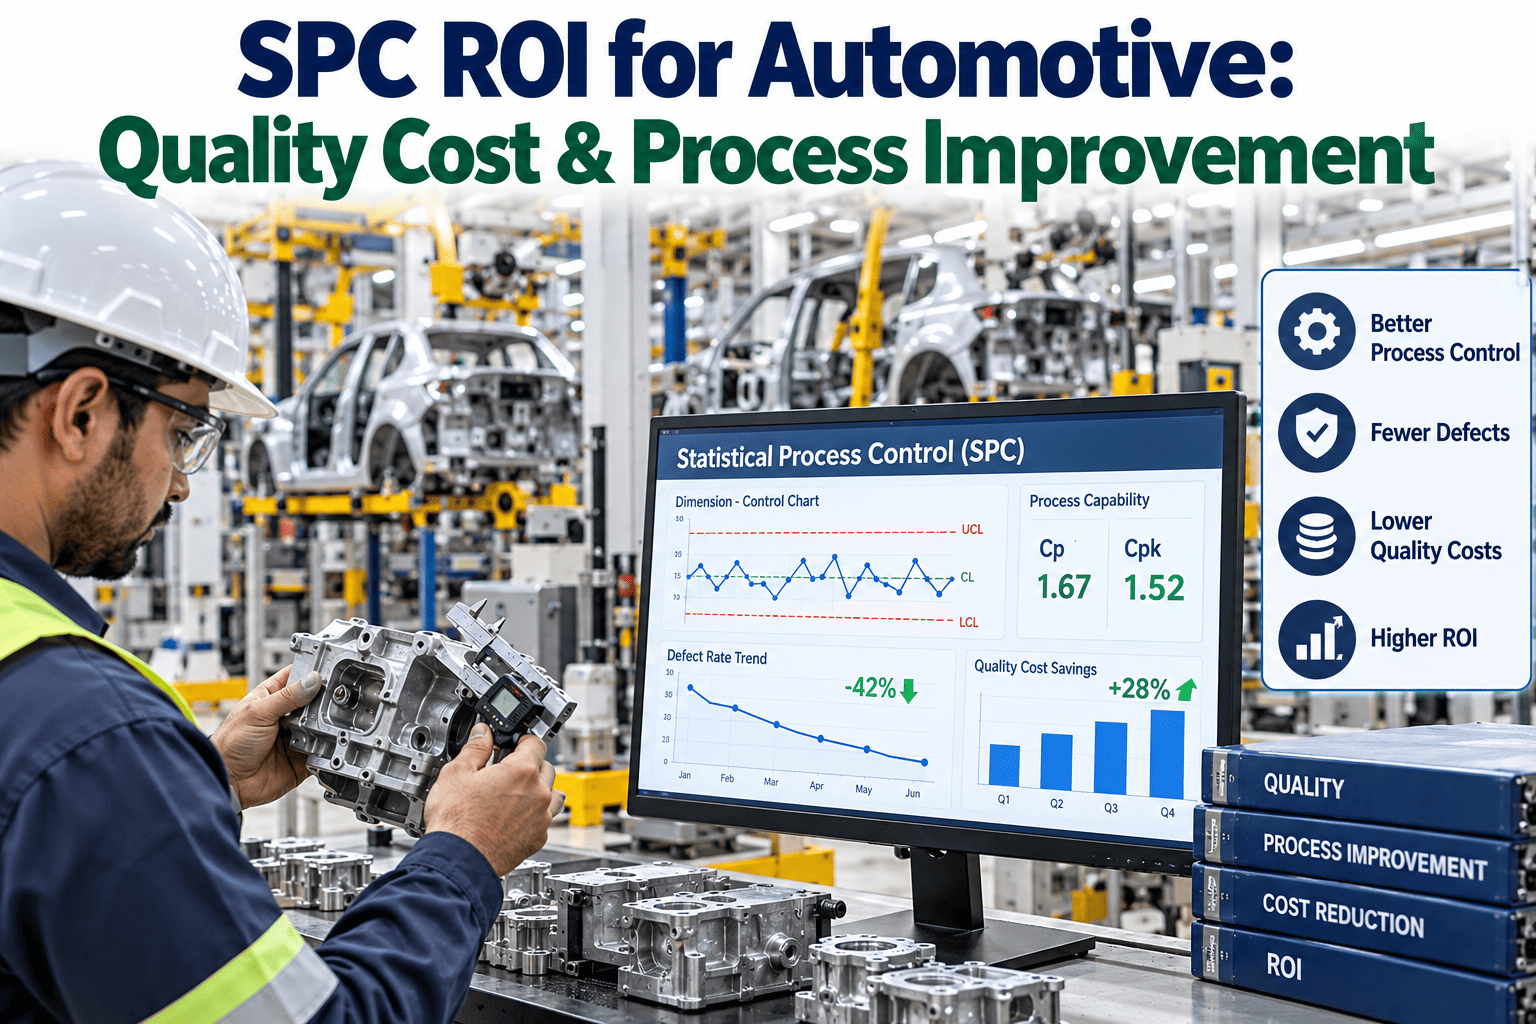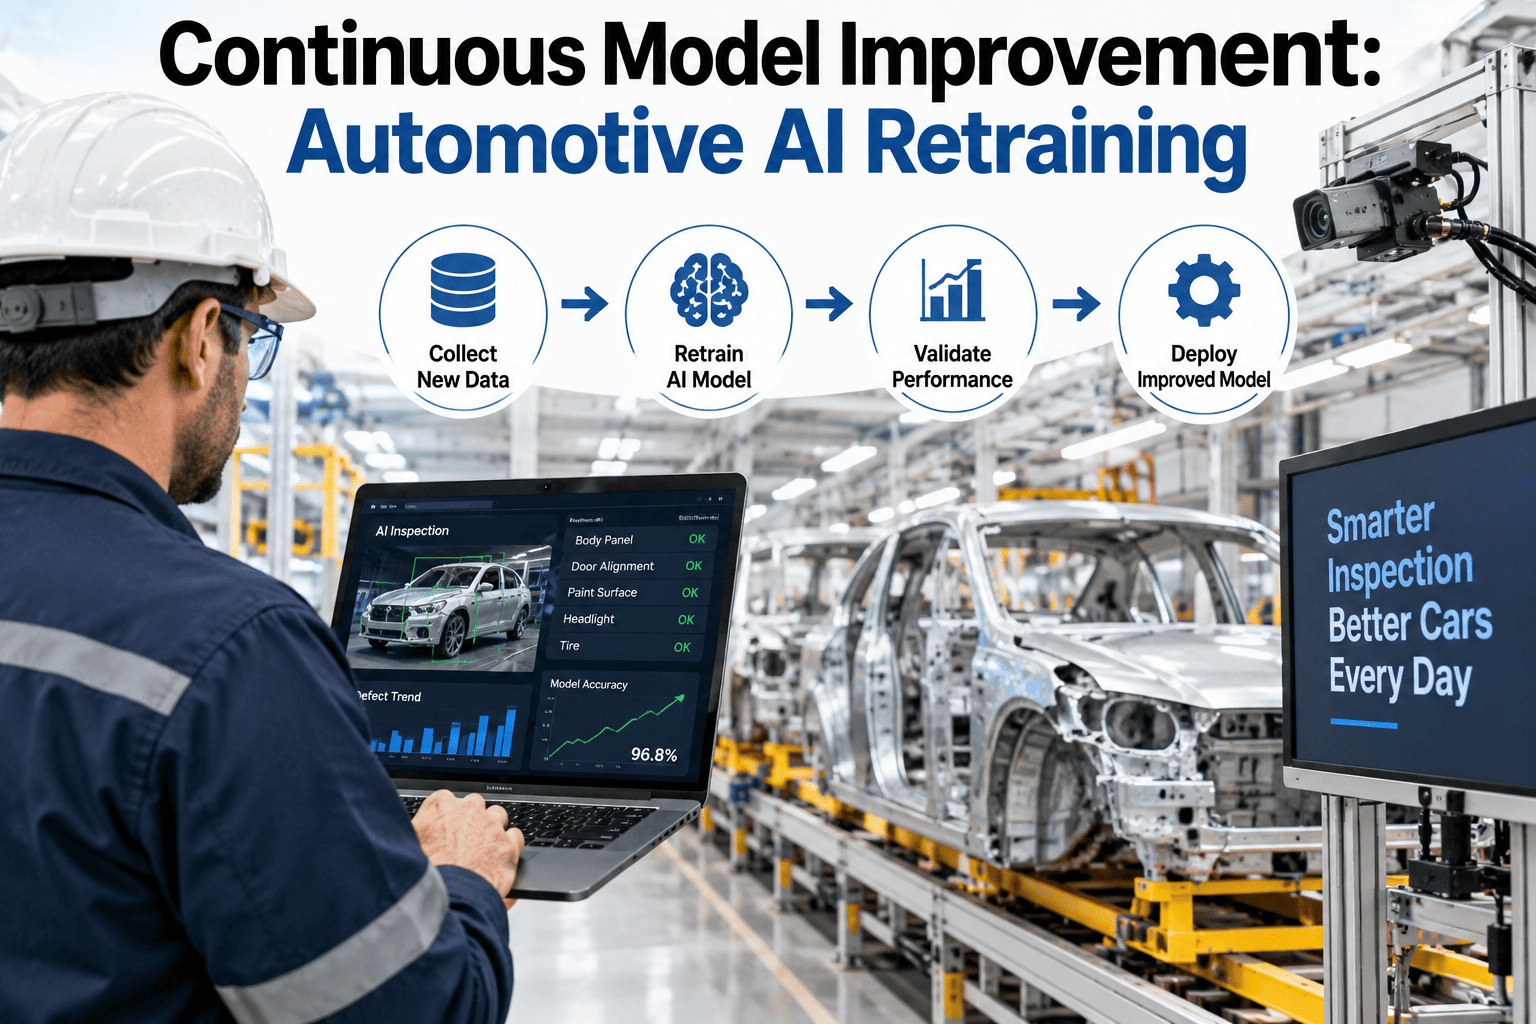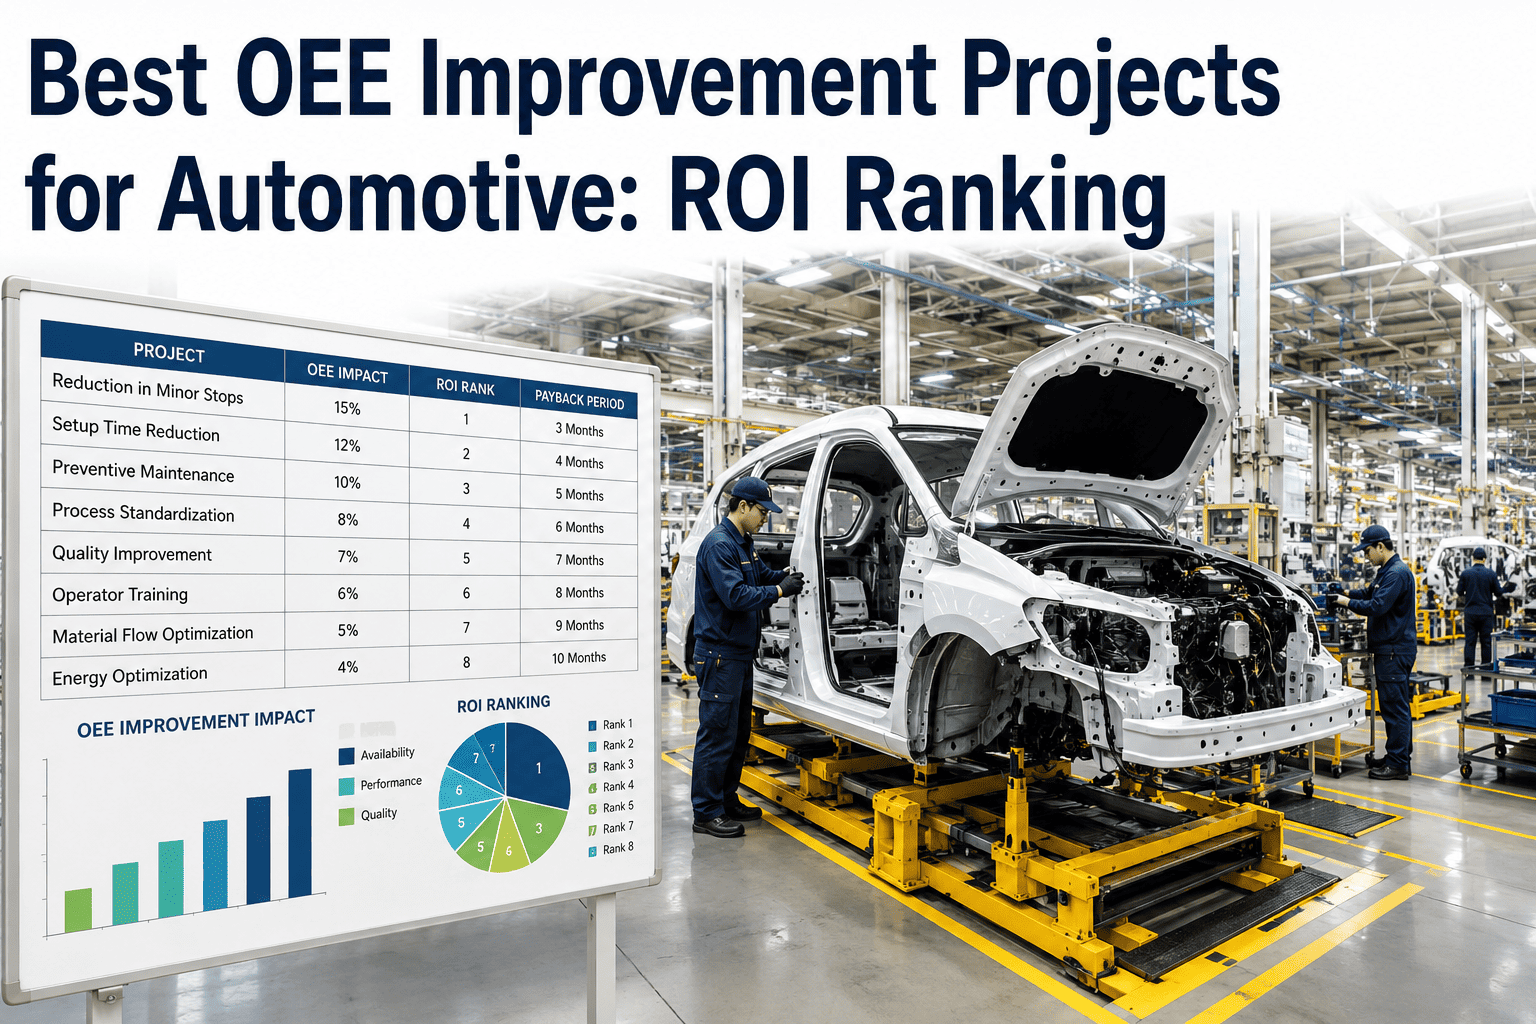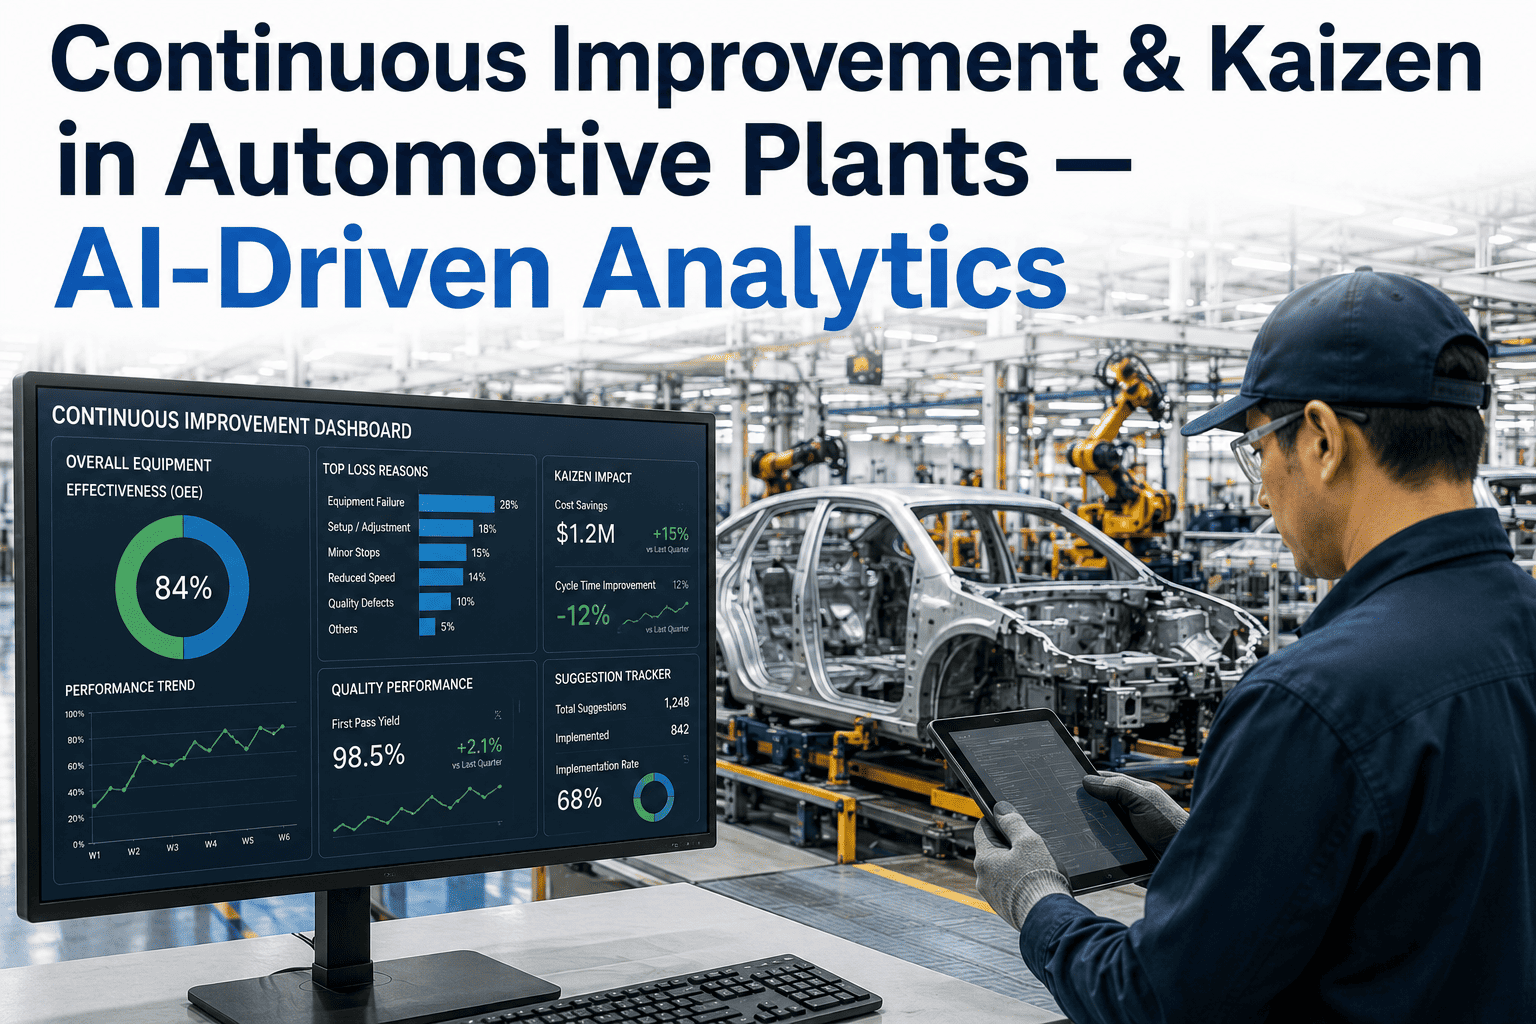
Fifty-eight percent is where the median automotive plant sits on OEE. Eighty-two percent is where the top tenth operate. The 24 points between them are not a mystery — they are breakdowns that gave warning, micro-stops nobody counted, lines running below rated speed and rejects found too late. This playbook works through what it takes to close that gap in nine months with on-prem AI, using a modelled plant with every assumption shown, including how nine avoided hydraulic press stops add up to $483K. To run the same model on your own numbers, book an OEE gain review.
From 58% to 82% OEE in Nine Months: The AI Playbook for Automotive Plants
A 24-point OEE gain is the same as getting 41% more good parts out of the hours you already schedule. iFactory finds the points by measuring every loss at the machine, predicting the failures that cause the longest stops, and telling supervisors which loss to attack this shift — all on an NVIDIA AI server inside the plant.
- Losses measured at the PLC, not on a clipboard
- Press, robot and spindle failures predicted weeks ahead
- Live in 6–12 weeks, then three improvement cycles
Where the 24 Points Are Hiding
OEE is availability multiplied by performance multiplied by quality, so a plant at 58% is rarely poor at one thing — it is ordinary at all three. In the model, availability of 74%, performance of 83% and quality of 94.5% multiply to 58%. Reaching 82% takes 90%, 93% and 98%. None of those targets is exotic on its own; the difficulty is knowing, line by line, which loss is costing the most this week. For a split of your own lines, speak with our OEE engineers.
Half the gain is availability, which is why predictive maintenance on the constraint machines comes first. But more than a third is performance — the loss most plants cannot see at all, because a line running 10% slow never appears in a downtime report.
The Nine-Month Roadmap
Nine months is three quarters: one to see the losses properly, one to take out the big stops, one to recover speed and yield. The milestones below are modelled, and each set of components multiplies to the OEE shown. Plants starting above 58% move through the early stages faster and find the last points harder. To map the stages onto your own calendar, book a roadmap session.
Baseline
OEE reported by shift from manual logs. Stops under five minutes go unrecorded. Maintenance is mostly reactive.
A 74 · P 83 · Q 94.5See every loss
iFactory live on all lines. Stops classified automatically. Quick wins on the top repeat faults and the worst changeovers.
A 78 · P 85 · Q 95Take out the big stops
Predictive models running on presses, robots and spindles. Failures become planned jobs. Changeover standard in place.
A 86 · P 88 · Q 96.5Recover speed and yield
Micro-stop causes removed, rated speeds restored, quality drift caught before the reject. Gains held by daily review.
A 90 · P 93 · Q 98Find Your First Five Points in Six Weeks
Pick the line that limits the plant. We connect its PLCs, classify every stop for six weeks and return a ranked loss list with the OEE points attached to each item — so the first improvement cycle starts with evidence, not opinion.
The Hydraulic Press Example: How Nine Avoided Stops Become $483K
Hydraulic presses are a good place to start because their failures are slow and expensive. Contamination, pump wear and seal degradation develop over weeks, yet the stop itself arrives without notice and takes most of a shift to repair. iFactory's hydraulic monitoring watches case-drain flow, pressure transients, oil temperature, particle count and cylinder position, and gives lead times of three to eight weeks depending on the component. That is long enough to move the repair into a planned stop. Our reliability specialists can review which signals your presses already provide.
The hourly figure is an assumption, and a cautious one: published estimates for US Tier 1 suppliers put an idle press or assembly line at $900 to $2,100 a minute. Put your own cost per hour and stop history into the same sum to get your own number; a plant with a higher hourly cost reaches the same total with fewer avoided stops.
Five Plays That Move the Number
Every OEE programme that works runs the same handful of plays; what differs is the order and the evidence behind each. iFactory supplies the evidence and tracks whether each play is holding. To see which would pay first on your lines, book a loss review.
Measure losses at the machine
Run, stop and cycle signals read directly off the PLC, with every stop classified against the six big losses. No typing, no rounding to the nearest five minutes.
Foundation for all three factorsPredict failures on the constraint
Condition models on the presses, robots and spindles that set the plant's pace. A failure found three weeks early is a planned two-hour job instead of a seven-hour stop.
Moves availabilityStandardise the changeover
Each changeover timed element by element and compared with the best on record, so the gap between crews is visible and closable.
Moves availabilityHunt micro-stops and restore speed
Stops of a few seconds are counted and grouped by cause. Lines running below rated cycle time are flagged with the reason they were slowed.
Moves performanceCatch quality drift before the reject
Weld current, torque curves and forming pressures are watched for the pattern that comes before a first-pass-yield fall, and vision inspection catches what gets through.
Moves qualityHold the gain every day
A ten-minute review of yesterday's top three losses, written by the AI and owned by the supervisor. Without it, the number slides back within a quarter.
Keeps all threeWhat the AI Does Day to Day
The models run on a GPU server in the plant, close enough to the line to work at cycle speed, with machine data kept on site. What reaches people is short and specific: the loss, the likely cause, and the next action. Ask our application team for a walkthrough on live plant data.
- Ranks losses in OEE points. Every stop and slowdown is converted into the points it cost, so a supervisor can compare a breakdown with a slow cycle on the same scale.
- Predicts the long stops. Hydraulic, bearing, servo and spindle signals are tracked against each machine's own normal, with a time-to-act estimate.
- Finds the moving bottleneck. The constraint station is recalculated through the shift, so effort follows the real limit.
- Writes the shift summary. Losses, causes and open actions are drafted at handover for the supervisor to confirm.
Four Reasons OEE Programmes Stall
Many plants have run an OEE initiative, seen the number rise for a quarter and then watched it settle back to where it began. The reasons are consistent enough to plan around, and each one is a data problem before it is a people problem — which is why the playbook starts with measurement and ends with a daily review, not the other way round.
OEE is counted differently on every line
One line excludes changeovers, another uses a generous ideal cycle time. The scores cannot be compared, so effort goes to the line that reports worst, not the one that loses most. A single definition, applied automatically, comes first.
The average is chased, not the constraint
Raising OEE on a machine that already has spare capacity adds nothing to output. The points that matter are on the station that sets the plant's pace — and that station changes through the shift.
The data arrives without a reaction
A dashboard that shows a loss but assigns no owner and no next step becomes wallpaper within a month. Each alert needs a named person and a standard response.
Gains are not held
A fixed fault returns when the crew rotates or the part changes. Without a daily look at yesterday's top losses, a plant can win ten points in a quarter and give five back in the next.
Delivered as a Turnkey AI System — Hardware and Software Together
iFactory ships as a complete bundle: a pre-configured NVIDIA AI server, racked and ready, with the OEE engine, predictive models and dashboards pre-loaded. Rack it, plug in power and Ethernet, and the AI is live on your plant network. Our team handles cabling, network setup, PLC and SCADA integration, operator training and 24×7 remote monitoring — the first quarter of the roadmap, delivered. For a scoped proposal, book a deployment call.
Ship, network and data
Server delivered and racked. PLCs, robots and press controllers connected. Ideal cycle times and planned-stop calendars loaded so OEE is counted the same way on every line.
Model training and pilot
Stop classification and condition models trained on your own signals. Live boards run on the pilot line and figures are reconciled with supervisors.
Go-live and training
All lines live, daily loss review in place, team leaders and maintenance trained, and the first ranked improvement list agreed.
Frequently Asked Questions
Is this a real customer case study?
No. It is a modelled scenario built to show how a 24-point OEE gain is made up. The 58% and 82% figures are the median and world-class levels from a published 2026 benchmark; the component values, milestones and dollar amounts are worked examples with assumptions stated. We can run the same model on your data.
Is moving from 58% to 82% OEE in nine months realistic?
It is ambitious and depends on the starting point. Plants at the median usually have large, visible losses — unrecorded micro-stops, reactive maintenance, uneven changeovers — and those respond quickly once measured. The last points, from the high 70s upward, are harder and need daily discipline. Some plants will take longer; a few will not need nine months.
Which OEE factor should we attack first?
Whichever costs the most points on the constraint line, which the first weeks of data will show. In most median plants that is availability, driven by breakdowns and changeovers. Performance is typically second and the least visible, because slow running and micro-stops rarely reach a downtime report.
How does AI reduce hydraulic press downtime?
By detecting wear while the press is still running. Rising case-drain flow, pressure transients, temperature, particle count and position drift indicate pump, valve, seal and fluid problems weeks ahead. The repair is then scheduled into a planned stop with parts on hand, replacing a long unplanned stop with a short planned one.
How is the $483K figure calculated?
It is a worked example: nine avoided hydraulic stops averaging seven hours give 63 hours recovered; at an assumed $7,000 per hour of lost press-line output that is $441,000, plus $42,000 of avoided emergency parts, freight and overtime. Your figure depends on your own cost per hour and stop history.
Do we need new sensors or a new MES?
Usually not to begin. OEE and stop classification use signals already in the PLCs. Predictive models start with what the machines provide — pressures, temperatures, currents, positions — and sensors are added only where a specific failure mode justifies them. iFactory works alongside an existing MES or can serve as one.
How long does deployment take, and what do we need to provide?
A typical plant is live in 6–12 weeks. You provide rack space, power, an Ethernet connection, access to PLC networks, ideal cycle times and a production lead for each line. iFactory supplies the pre-configured NVIDIA AI server, software, integration and training. To scope your plant, contact our scoping team.
Put Your Own Numbers Into the 58-to-82 Model
One turnkey system — NVIDIA AI server, OEE and predictive software, integration and training — delivered and live inside 12 weeks. Bring your current OEE and downtime history; leave with a ranked list of where your points are.
- 1Current OEE by line, and how it is calculated
- 2Twelve months of unplanned stops on your worst three machines
- 3Your cost per hour of lost output
- 4The line that limits the plant today