Every plant has more OEE improvement ideas than budget to fund them. Change the changeover procedure, upgrade the robot controller, retrain the third shift, install condition monitoring on the press — each has a champion and a business case, and rarely does anyone rank them against each other on the same footing before committing capital. The plants that close the gap to top-quartile OEE fastest are not the ones running the most projects; they're the ones running the right three or four, ranked by return per dollar and per week of engineering time, in the right order. This guide lays out a practical ranking method for exactly that decision — and if you want a second opinion on your own project shortlist, book a prioritization session with iFactory.
Fund the Projects That Actually Move OEE First
A ranked, ROI-driven project portfolio recovers more capacity per dollar than an unranked backlog of good ideas.
Why Good Projects Still Deliver a Bad Portfolio
It is entirely possible to fund five individually well-justified projects and still see almost no movement in plant-wide OEE within a year. The reason is usually that all five projects targeted overlapping losses, competed for the same maintenance technicians, or addressed the third-largest loss category while the biggest one sat untouched. Ranking fixes this by forcing every candidate project onto the same scale before a single dollar is committed.
The Impact-vs-Effort Grid
Before calculating precise ROI figures, a quick visual sort into four quadrants separates the projects worth detailed analysis from the ones that can wait.
Quick wins
High impact, low effort — changeover SMED events, alert threshold tuning, shift-handover standardization. Fund these first, always.
Strategic bets
High impact, high effort — condition-based maintenance rollout, robot controller upgrades, line rebalancing. Fund after quick wins, sequenced by budget cycle.
Fill-in tasks
Low impact, low effort — minor operator training refreshers, small tooling swaps. Useful, but never at the expense of a quick win.
Reconsider
Low impact, high effort — full line automation for a marginal loss category. Revisit only after the top two quadrants are addressed.
Rank Your Own Project Backlog
iFactory's loss data makes it straightforward to see which quadrant each candidate project actually falls into, based on real Pareto data rather than gut feel.
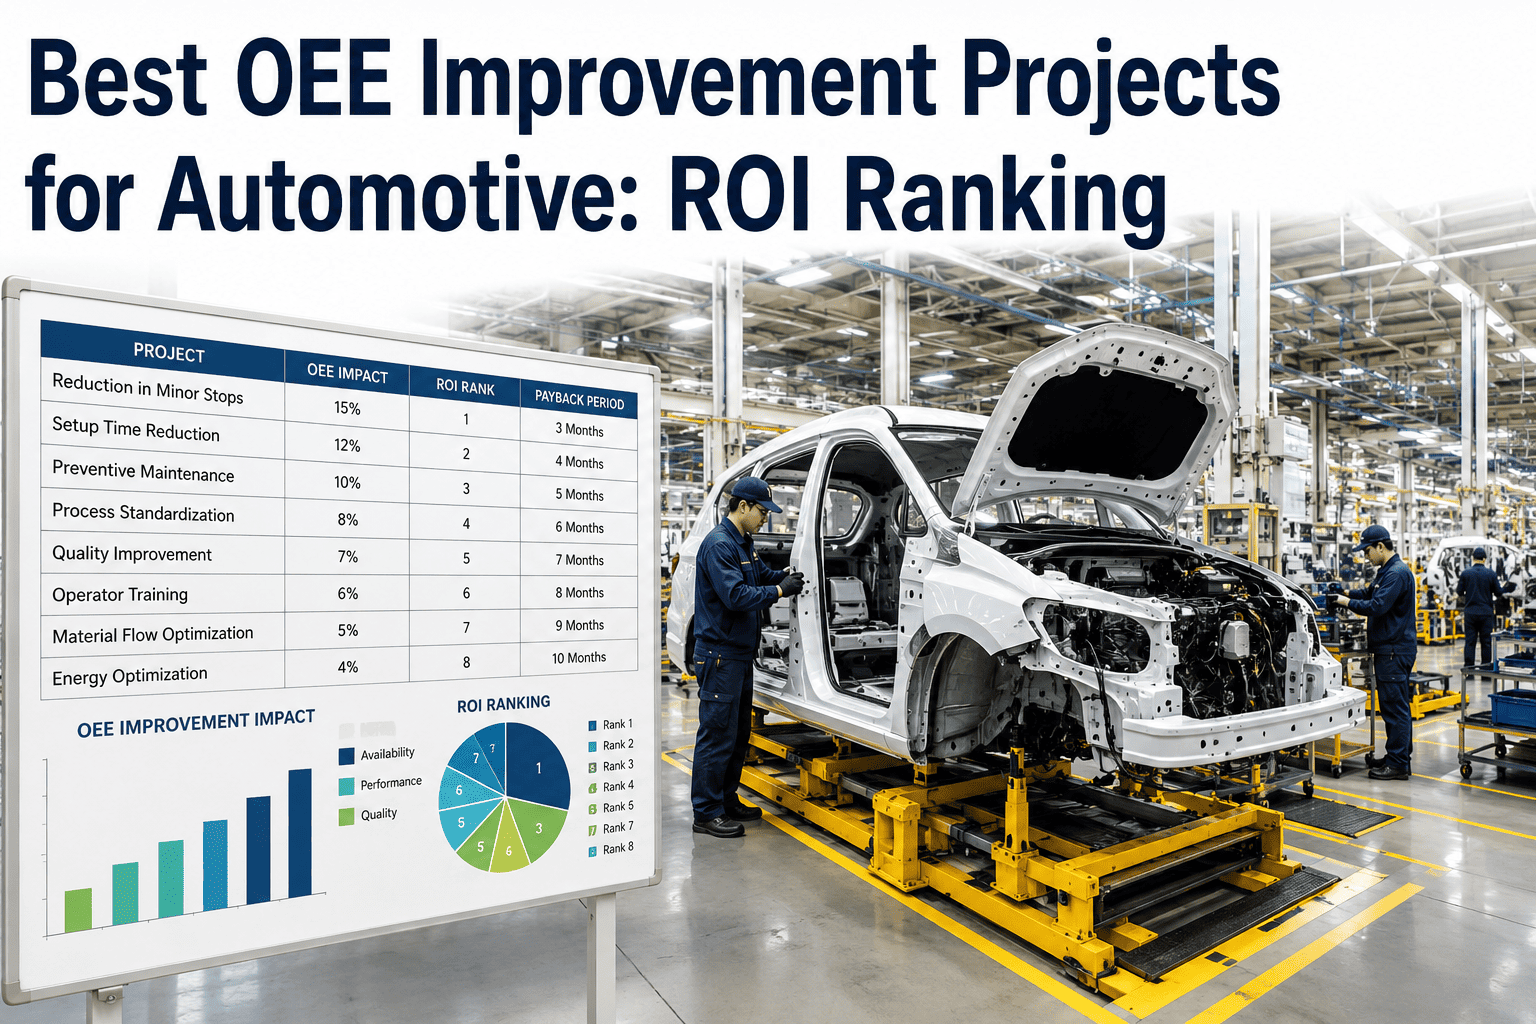
Sample Ranking: Five Common Automotive Projects
The table below shows how five typical automotive OEE projects stack up once ranked by projected OEE point gain per engineering week invested — a useful common denominator when comparing dissimilar project types.
Note: figures are illustrative starting points for portfolio discussion — the actual ranking for your plant depends on which loss category currently dominates your own Pareto chart.
Managing the Portfolio, Not Just the List
A ranked list is a starting point, not a finished portfolio. Three additional constraints usually reshuffle the order once real resourcing enters the picture.
Shared resource contention
Two top-ranked projects competing for the same maintenance electrician will both slip. Sequence rather than parallelize when skilled resources overlap.
Line downtime windows
A project requiring a planned line stop should be batched with other stop-requiring work in the same maintenance window rather than scheduled independently.
Compounding dependencies
Fixing a changeover process before installing condition monitoring on the same asset avoids re-validating the monitoring baseline after the process changes.
Re-Ranking on a Quarterly Cadence
A ranking done once and never revisited drifts out of date as soon as the top loss category shifts. Building a quarterly re-ranking habit keeps the portfolio honest.
Pull the current Pareto
Refresh the ranked loss categories against the last quarter's live OEE data before revisiting any project list.
Score completed projects
Compare actual OEE gain against the original estimate for anything finished last quarter — this calibrates future estimates.
Re-rank the backlog
Re-run the impact-versus-effort sort with fresh loss data — a project that ranked third last quarter may now rank first.
Commit the next quarter's top two
Fund and staff only the top-ranked one or two projects fully, rather than spreading thin across the whole list.
Frequently Asked Questions
How many OEE improvement projects should a plant run at once?
Most plants get better results running one or two fully resourced projects at a time than five underfunded ones running in parallel. Spreading engineering time across too many initiatives simultaneously tends to slow every project down and makes it harder to isolate which change actually drove an OEE improvement when several run concurrently.
Should every project be justified purely by OEE point gain?
OEE gain is a strong common denominator for ranking, but safety, compliance, and warranty-driven projects sometimes need to be funded regardless of their OEE ranking. The practical approach is to rank OEE-driven projects against each other using the impact-versus-effort method, while tracking mandatory projects separately so they don't distort the improvement portfolio's apparent priorities.
How do we estimate OEE gain for a project before it's been done anywhere in our plant?
Start with the loss category's current share of total downtime or speed loss from your live Pareto data, then apply a conservative percentage reduction based on how similar projects have performed elsewhere in the industry — a first SMED event on an unoptimized changeover often recovers 30–50% of that category's time, while later refinements yield smaller increments.
What's the biggest reason a highly ranked project underdelivers?
Underestimating the engineering weeks required is the most common cause, usually because the estimate assumed dedicated resourcing that competing priorities later pulled away. Building in a resourcing buffer and confirming technician availability before committing to a project's ranking position avoids the most common source of portfolio slippage.
Can this ranking method work without a live OEE dashboard in place?
It can, using manually compiled loss data, though the ranking will be less precise since manual logs tend to understate micro-stops and speed loss. Many plants use this exercise as the trigger to move to live measurement — once the real Pareto is visible, the ranking often changes significantly. Book a session to see your actual loss ranking before committing next quarter's budget.
Rank Your Improvement Backlog Against Real Loss Data
Book a 30-minute session with iFactory and leave with a ranked project list built on your plant's actual OEE and loss Pareto — not a generic checklist.