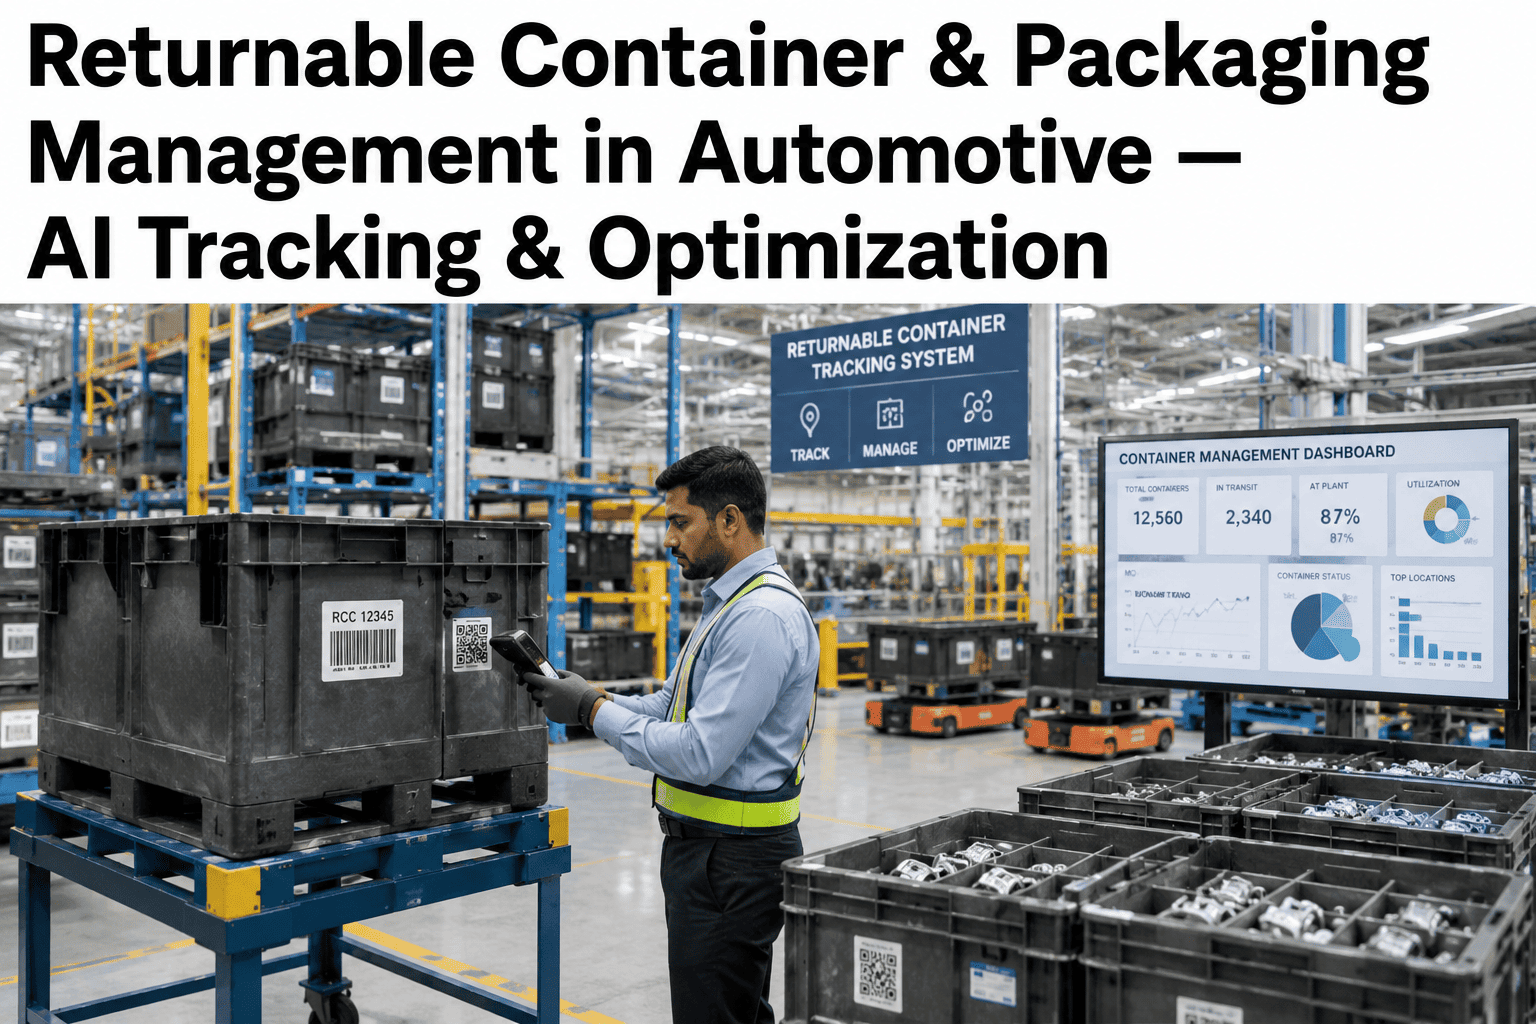
A returnable rack that should be cycling between your plant and an OEM dock every four days instead sits idle in a trailer yard for two weeks, and nobody notices until the line runs short and a cell has to switch to costly one-way dunnage overnight. Automotive plants routinely operate fleets of several thousand returnable containers, dunnage trays, and steel racks across dozens of shipping lanes, and without a live view of where each asset actually is, container shortage becomes a recurring production risk instead of a rare exception. iFactory tracks the full returnable packaging fleet continuously, predicts shortages before they hit the line, and turns container management from a guessing game into a scheduled operation — see the full capability at iFactory support.
AI-Driven Asset Tracking · Automotive Packaging & Containers
Returnable Container Management: Know Where Every Rack, Tote, and Dunnage Tray Is, Every Hour of the Day
iFactory tracks returnable container fleets across every shipping lane, predicts availability shortfalls before they threaten a build schedule, and manages cleaning cycle compliance so containers are never pulled from rotation unexpectedly.
2,140
In Transit to Plant
1,860
On the Production Floor
85
Overdue Return — Flagged
The Container Lifecycle
Every Returnable Asset Moves Through Six Stages — And Loses Visibility at Every Handoff
A returnable rack does not simply travel from plant to OEM and back. It moves through loading, transit, dock receipt, unpacking, washing, and staging, and each handoff between parties is a point where tracking data traditionally goes dark.
1
Loaded at Supplier Plant
3
Received & Unpacked at Line
4
Staged for Return Trailer
Where the Fleet Gets Lost
Four Reasons Returnable Container Fleets Run Short Even When Total Asset Counts Look Healthy
Trailer Yard Dwell
Empty racks staged for return sit in a trailer yard queue behind loaded outbound freight, and without a location ping, a two-day dwell can silently stretch to two weeks.
Cross-Docking Leakage
Containers routed through a consolidation center for a milk run pickup are the easiest assets to lose track of, since ownership of the tracking record often changes at the cross-dock.
Wash Cycle Bottlenecks
A backed-up cleaning line holds hundreds of containers out of rotation at once, and without a queue view, planners keep ordering more dunnage instead of clearing the backlog.
Cross-Program Mixing
Racks designed for one part number end up absorbed into another program's rotation at a shared dock, quietly reducing the pool available for their intended line.
Turn Your Container Fleet From a Cost Center You Track in Spreadsheets Into an Asset You Manage in Real Time.
iFactory combines RFID, GPS, and dock-scan data into one continuous view of fleet location, condition, and availability across every lane and every program.
Before vs. After
Container Management — Manual Tracking vs. iFactory Fleet Analytics
Function
Manual / Spreadsheet Tracking
iFactory Fleet Analytics
Container Location
Estimated from shipping documents, often several days out of date
Tracked continuously via RFID and dock-scan events across every lane
Shortage Prediction
Discovered when a line runs out and dunnage must be sourced on short notice
Forecast days ahead based on cycle time trends and current in-transit counts
Wash Cycle Scheduling
Cleaning batches queued manually, often reacting to backlog rather than preventing it
Wash demand forecast from return volume so cleaning capacity is scheduled ahead of the surge
Cross-Program Loss
Container drift between programs discovered during an annual physical count
Program ownership tracked per asset with alerts on unexpected program crossover
Dunnage Spend
One-way dunnage purchased reactively whenever the returnable pool runs short
Returnable pool sized and rotated to minimize reliance on one-way dunnage purchases
Measured Outcomes
What Packaging Teams See After Deploying Fleet Analytics
6.4 days
Average Trailer Yard Dwell Cut
A Tier 1 supplier reduced average empty-container dwell time in the return trailer yard from 9.8 days to 3.4 days after deploying continuous tracking.
27%
Reduction in One-Way Dunnage Spend
Plants that eliminated reactive dunnage buying by forecasting returnable pool availability report spend reductions in this range.
4–7 days
Shortage Warning Lead Time
How far in advance a predicted container shortfall is typically flagged, based on current cycle time and in-transit inventory trends.
18%
Smaller Total Fleet Required
Faster cycle times from reduced dwell allow the same production volume to run on a smaller total container fleet, cutting capital tied up in packaging assets.
Under 2 hrs
Fleet Location Data Refresh
Location and status data across RFID and dock-scan touchpoints refreshes continuously, keeping the fleet dashboard current throughout the shift.
30–45%
Fewer Wash Cycle Bottleneck Events
Forecasting wash demand ahead of the return surge reduces the frequency of containers sitting idle in a cleaning queue.
Field Case
Finding 600 Missing Racks Without an Annual Physical Count
A seating supplier running returnable steel racks across four shipping lanes had grown accustomed to an annual physical inventory that always turned up several hundred fewer racks than the books showed, with the gap typically written off as loss. After deploying continuous RFID tracking at dock scan points, the fleet dashboard surfaced roughly 600 racks that had drifted into a neighboring program's rotation at a shared cross-dock facility months earlier — still in active use, just tagged to the wrong program's count. Reclaiming those racks avoided an emergency capital order for replacement fleet that had already been drafted for approval, and the shared cross-dock now flags program ownership automatically at every scan.
~600Racks recovered from cross-program drift
$0Emergency capital spend avoided
1Cross-dock now flagging ownership live
Frequently Asked Questions
Returnable Container Management — What Packaging Managers Ask First
What tracking technology does iFactory use for returnable containers?
iFactory supports RFID tagging, GPS-enabled telematics on trailers and returnable racks, and dock-scan barcode events, and it can combine all three within the same fleet depending on what a given container type already carries. High-value steel racks and specialty dunnage typically justify RFID or GPS for continuous location data, while lower-cost totes and reusable bins are often tracked adequately through scan events at key handoff points such as dock receipt, wash-in, and wash-out. The system is configured to match tracking investment to asset value rather than requiring uniform instrumentation across the entire fleet.
Book a Demo to review the right tracking mix for your fleet.
How does the shortage prediction actually work?
The forecasting model tracks each container type's full cycle time — load, transit, unload, return transit, wash, and restage — against current production consumption rate and in-transit counts. When the number of containers available for the next scheduled load falls below what upcoming production will require, based on the observed cycle time trend rather than a static assumption, an alert is raised with enough lead time to either expedite a return shipment or adjust the wash queue priority before the shortfall reaches the line.
Can this manage containers shared across multiple OEM programs and suppliers?
Yes — most automotive packaging fleets are shared assets moving between multiple suppliers, cross-docks, and OEM plants, and iFactory is built around that reality. Each container is tracked with a program and ownership tag that travels with it through every handoff, so cross-program drift is flagged at the point it happens rather than discovered during a periodic count. Reporting can be filtered by owner, program, part number, or shipping lane depending on what a given stakeholder needs to see.
Does this integrate with our existing wash and inspection line?
iFactory connects to most wash line control systems and manual inspection logging tools through standard integration methods, pulling wash-in and wash-out timestamps into the same fleet visibility dashboard used for transit and dock tracking. Where a wash line has no existing digital logging, a simple scan-based check-in and check-out process can be added at minimal disruption to the current cleaning workflow.
Contact support to review your current wash line setup.
How long does deployment take across a multi-lane container fleet?
A single-lane deployment with RFID tagging already in place on the container fleet typically goes live in two to three weeks, covering tag registration, dock-scan point configuration, and baseline cycle time calibration. Multi-lane fleets requiring new tagging across several thousand assets, or coordination with third-party cross-dock facilities, generally take six to ten weeks depending on how many external partners need to be onboarded into the scan network.
Book a Demo for a timeline specific to your lane count.
Your Container Fleet Is Worth More Than the Spreadsheet Tracking It Suggests. See Where Every Asset Actually Is.
Continuous returnable container tracking, shortage forecasting, and wash cycle management across every shipping lane — live in as little as two weeks.