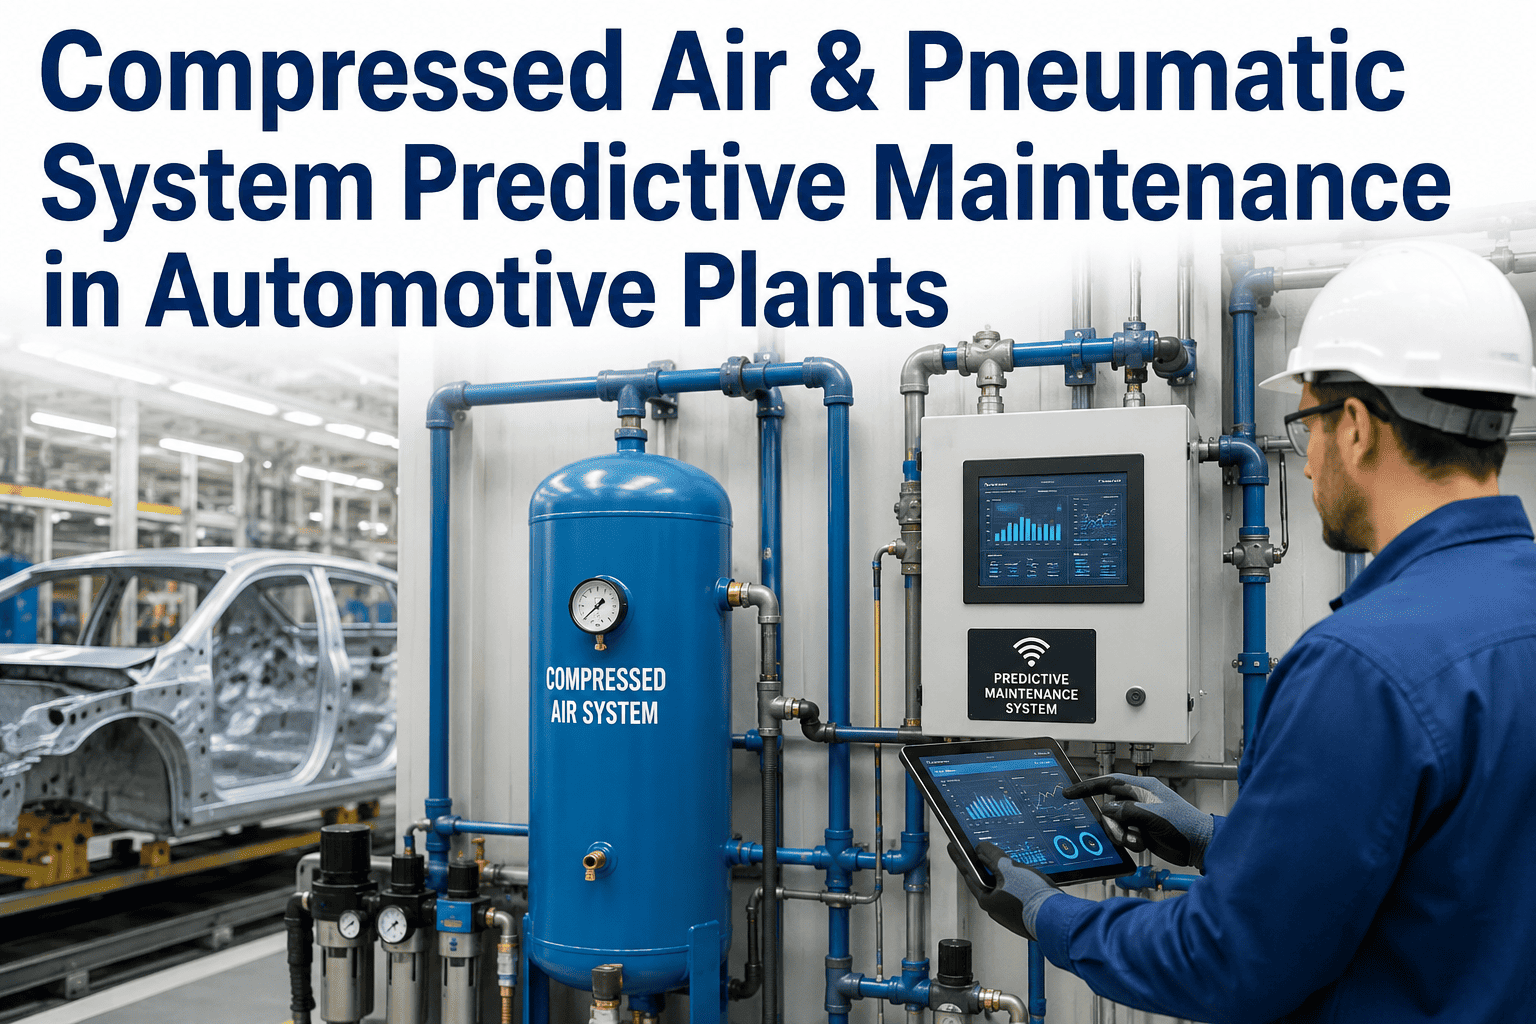
Compressed air is often called the fourth utility on an automotive plant floor, and it is almost always the most expensive one to waste. Independent audits of manufacturing sites consistently find that leaks, over-pressurization, and inefficient compressor scheduling quietly consume a quarter to a third of everything a plant generates, long before that air ever reaches a torque wrench or a pneumatic clamp. Assembly lines depend on that air arriving at steady pressure every single cycle, so when a compressor starts working harder to compensate for hidden losses, the first symptom maintenance teams usually see isn't a bill, it's a tool that underperforms during a shift. iFactory's compressed air monitoring platform was built to catch that loss at its source instead of waiting for a torque failure to reveal it.
Stop treating compressed air like it's free
iFactory monitors your compressor plant and pneumatic tool network continuously, catching leaks, pressure drops, and compressor degradation before they interrupt an assembly shift or inflate an energy bill nobody questioned.
A single leak map explains most of the waste
Picture every cubic foot of air your compressors produce in a shift as one long bar. Most plants have never actually looked at how that bar splits, because nobody bills departments for compressed air the way they bill for electricity or gas. Once you chart it, the picture is uncomfortable but very fixable.
A single eighth-inch leak running at typical plant pressure can waste well over two thousand dollars a year in electricity on its own, and most plants carry dozens of leaks of that size or larger scattered across quick-connects, hose reels, and cylinder seals. Multiply that across an assembly hall, add a compressor running a few extra PSI above what the process actually needs, and the six-figure number stops sounding exaggerated.
Annual leak surveys can't keep up with a plant that changes daily
| Factor | Periodic Leak Survey | iFactory Continuous Monitoring |
|---|---|---|
| Detection frequency | Once or twice a year, if scheduled | Continuous, every shift |
| New leak discovery | Delayed until next survey window | Flagged within hours of onset |
| Compressor scheduling | Fixed set points, rarely revisited | Matched to real-time demand |
| Pressure optimization | Manual, based on old assumptions | Continuously tuned to process need |
| Cost visibility | Rough estimate at audit time | Live dollar-cost dashboard by line |
| Work order creation | Manual, often delayed weeks | Automatic on leak confirmation |
Energy costs and tighter production schedules raise the stakes
Industrial electricity rates have continued climbing in most manufacturing regions, and compressed air is one of the least efficient ways to deliver energy to a process, since a large share of the electrical input is lost as heat before it ever becomes usable air pressure. That inefficiency was tolerable when energy was cheap and schedules had slack built in. Neither is true anymore. A plant running two or three shifts with tight takt times can't absorb a compressor tripping offline mid-shift because it was quietly compensating for leaks nobody had mapped.
There's also a quality dimension that gets overlooked. Pneumatic torque tools, riveting guns, and clamping cylinders are calibrated assuming a stable supply pressure. When pressure sags because of leaks or an undersized compressor working overtime, torque accuracy drifts, and that drift can show up downstream as a fastener quality escape long after the air system was the actual root cause. Tracing a torque anomaly back to a pressure problem without continuous monitoring data is slow, and by the time it's found, a batch of assemblies may already need rework.
From compressor house to the last quick-connect
Instrument the supply side
Flow, pressure, and power sensors are added at compressor discharge, receiver tanks, and major branch lines, feeding a continuous baseline of how much air is actually being produced.
Listen for leaks acoustically
Ultrasonic sensing and pressure-differential analysis pinpoint leak locations down to the fitting or hose segment, ranking them by dollar cost so repair crews fix the expensive ones first.
Match supply to real demand
The model learns each line's actual air demand curve across a shift and adjusts compressor staging and pressure set points so the plant stops producing air nobody is using.
Auto-generate work orders
Confirmed leaks and early compressor degradation signs route straight into your maintenance system with location, severity, and estimated annual cost attached.
Most plants have never seen their own leak map. Book a demo and we'll build one from your compressor data in the first session.
What plants typically see within two quarters
What a pilot looks like on your floor
Works with your existing compressors
No compressor replacement required; sensors retrofit onto discharge lines, receivers, and key branch points.
On-premise deployment
Runs on an NVIDIA appliance inside your plant network, keeping production and energy data on site.
Six to eight week pilot
Includes a baseline leak survey, live monitoring calibration, and a documented savings report by week eight.
Line-by-line cost visibility
Dashboards attribute compressed air cost to specific assembly lines or work cells, not just the plant total.
Expands to full plant coverage
Once the pilot proves out, additional branch lines and compressor houses are added without re-architecting the system.
24x7 managed monitoring
iFactory's team watches for new leaks and compressor anomalies so your maintenance team isn't staring at another dashboard.
Why compressed air is an easy first AI pilot
Compressed air optimization is one of the fastest-paying AI pilots available on a plant floor because the savings show up on a utility bill everyone already reads monthly. There's no need to build a new business case from scratch; the current compressed air spend is the baseline, and any reduction is immediately visible without needing a full quarter of new data collection to prove the point.
It's also low-disruption to implement. Sensors clamp onto existing piping and compressor discharge points without shutting down production, and operators don't need to change how they use pneumatic tools at all. Many plants use a successful compressed air pilot as the entry point for expanding predictive monitoring into other utility systems, from chilled water loops to hydraulic power units, once maintenance leadership has seen the model work on air.
Compressed air monitoring, explained plainly
Find out what your compressed air system is really costing you
iFactory maps the leaks, the over-pressurization, and the idle waste hiding in your plant's air system. Book a demo and see it charted against your own data.