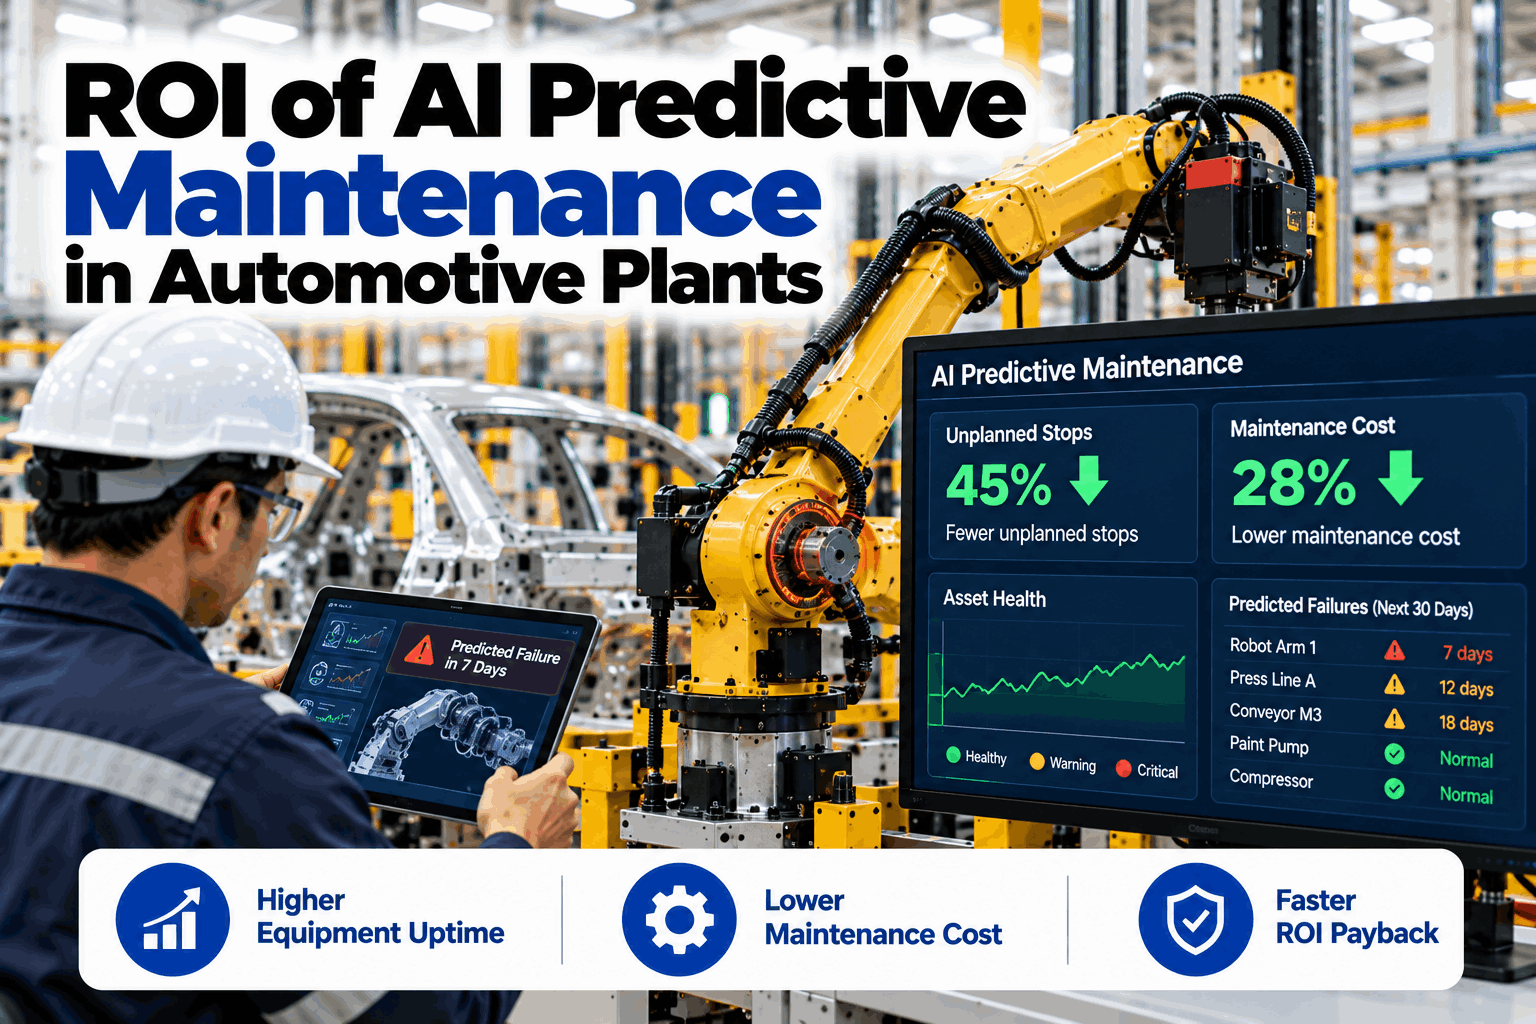
Every automotive plant has a maintenance strategy. Most of them are reactive dressed as preventive — calendar-based service intervals that were set at commissioning and never updated, paper-based inspection routes that get completed faster when production is behind, and a breakdown response system refined to near-perfection because it runs so often. The plants that operate at 99.7% availability and 28% lower maintenance cost than the fleet average are not running better equipment. They are running the same equipment on a fundamentally different information model: one where a welding robot's J3 gearbox tells the maintenance system it is degrading four days before it seizes, where a stamping press main bearing's vibration signature is compared against its own load-normalised baseline rather than a generic alarm threshold, and where the technician who shows up with the replacement part has already read the alert, pulled the OEM torque specification, and booked the planned downtime slot. Predictive maintenance in an automotive plant is not a technology purchase — it is a programme. Getting it right requires the right asset selection, the right sensor strategy, the right data model, and the right integration with the maintenance workflow that already exists. This guide covers all four. iFactory Predictive Maintenance is built to run that programme — across robots, presses, transfer lines, and critical utilities, live.
iFactory Predictive Maintenance — Automotive Manufacturing
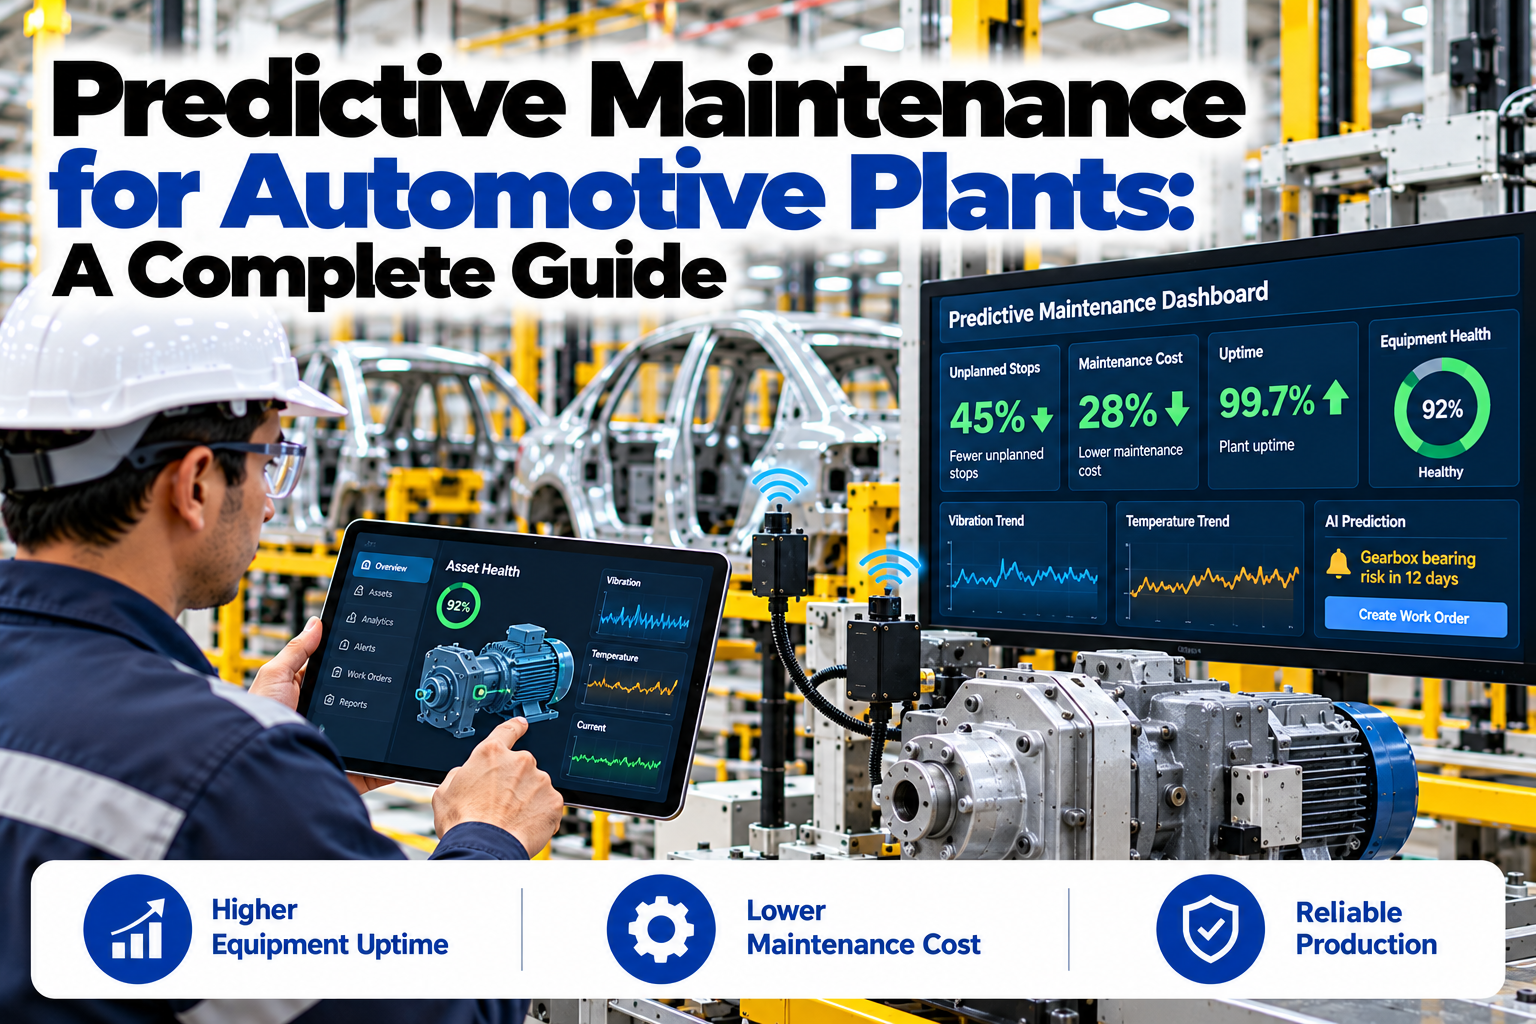
Predictive Maintenance for Automotive Plants: A Complete Guide
Asset selection, sensor strategy, data architecture, failure mode coverage, and implementation roadmap — everything needed to build an automotive PdM programme that actually delivers 45% fewer unplanned stops.
99.7%
uptime on monitored critical assets — top-quartile automotive plants
45%
fewer unplanned stoppages within 12 months of structured PdM
28%
lower total maintenance cost — planned replacement vs reactive repair
3–7 days
average early warning lead time across bearing, gear, and hydraulic faults
The PdM Maturity Model — Where Most Automotive Plants Actually Are
Most automotive maintenance teams believe they are further along the PdM maturity curve than their data supports. Understanding which stage the plant is genuinely at — not aspirationally, but operationally — is the precondition for building a programme that advances rather than stalls.
Stage 1
Reactive
Fix it when it breaks. Maintenance team optimised for fast breakdown response. PM schedules exist on paper but are routinely deferred by production pressure. No condition data collected between failures.
Recognition signal: "We're good at responding to breakdowns" — technician mean response time is measured and celebrated.
Maintenance cost: 3–4% of asset replacement value per year
Stage 2
Preventive
Calendar-based PM schedules running with reasonable compliance. Bearings replaced at intervals, oil sampled quarterly, lubrication routes completed. Asset health assumed rather than measured between service dates.
Recognition signal: "We replaced it last month" — a bearing that failed was serviced 6 weeks ago on schedule and still failed.
Maintenance cost: 2–3% of asset replacement value per year
Stage 3
Condition-based
Periodic condition monitoring on high-value assets — vibration routes run monthly, thermography quarterly, oil analysis on gearboxes. Intervention triggered by condition rather than calendar. Still a sampling strategy, not continuous.
Recognition signal: "We do monthly vibration rounds" — condition data exists but is weeks old when acted upon; fast-developing faults still cause unplanned failures.
Maintenance cost: 1.5–2.5% of asset replacement value per year
Stage 4
Predictive
Continuous sensor data on critical assets, AI fault detection running against machine-specific baselines, alerts with estimated failure windows and production consequence ranking. Unplanned failures become planned interventions. Condition data drives the maintenance schedule, not the calendar.
Recognition signal: "The system told us 5 days ago" — the technician was already booked, the part was already ordered, the repair ran in the planned 2-hour window.
Maintenance cost: 1–1.8% of asset replacement value per year
Asset Selection — The Most Important Decision in an Automotive PdM Programme
Deploying predictive maintenance on every asset simultaneously is the fastest route to a programme that generates alerts nobody acts on. The correct starting point is a ranked list of assets by failure consequence and failure frequency — the assets where a single prevented failure justifies the monitoring cost, and where the failure mode is detectable with available sensor technology. These are the selection criteria.
Three-factor asset prioritisation matrix
1
Failure consequence
What happens when this asset fails unplanned? Score 1–5 based on: production line stopped (5), production degraded (3), local workaround available (1). Weight this factor highest — it is the primary driver of ROI.
2
Failure frequency
How often has this asset failed unplanned in the last 24 months? High-frequency assets carry the highest recurring cost and show the fastest ROI from PdM. Assets that have never failed are poor candidates for the first deployment — there is no baseline failure cost to avoid.
3
Failure mode detectability
Is the dominant failure mode detectable with current sensor technology at sufficient lead time? Bearing degradation (vibration, temperature): 5–10 days' warning. Gear wear (vibration FFT): 3–7 days. Electrical faults (current signature): 2–5 days. Sudden catastrophic failure with no precursor: not PdM-suitable — address through redundancy or design change.
Typical priority ranking — automotive body, press, and paint shop
Asset
Consequence
Frequency
Detectability
Priority
Transfer line — index drive
5
4
5
P1 — Start here
Stamping press — main drive
5
3
5
P1 — Start here
Paint shop oven fan
5
3
4
P1 — Start here
Body shop welding robot cluster
4
4
4
P2 — Phase 2
Plant air compressor
4
3
4
P2 — Phase 2
CNC machining centre — spindle
3
4
4
P2 — Phase 2
Conveyor / overhead system
3
3
4
P3 — Phase 3
HVAC / facility services
2
2
3
P3 — Phase 3
The PdM Technology Stack — Four Layers, Each One Critical
Predictive maintenance is not a single technology — it is four distinct technology layers that must work together. Failure in any layer produces a system that generates data nobody uses, alerts nobody trusts, or analysis nobody can act on fast enough. These are the four layers and what the right choice at each one looks like in an automotive context.
Layer 1
Sensing & Data Acquisition
The physical layer — the sensors that generate the condition signals. Right sensor type per failure mode; right installation position per asset; right sampling rate to capture the fault frequency of interest.
Vibration (MEMS accelerometer)
Bearings, gearboxes, imbalance, misalignment — the workhorse of mechanical PdM
Temperature (thermistor / IR)
Bearing overheating, motor thermal runaway, electrical hotspots — fastest-to-install signal
Current signature (CT clamp)
Motor degradation, rotor bar faults, load variation — no mechanical access required
Acoustic emission (AE sensor)
Very early bearing and gear defects — detects crack propagation before vibration signal
Oil condition (in-line sensor)
Gearbox and hydraulic degradation — particle count, viscosity, water contamination
↓
Layer 2
Connectivity & Edge Processing
How raw sensor data reaches the analytics platform — and how much processing happens before transmission. In an automotive plant, connectivity choices are constrained by OT network security policy, cell architecture, and EMI environments.
OEM telematics (preferred where available)
Fanuc FOCAS/MT-LINKi, Kuka OPC-UA, ABB OmniCore — no retrofit sensor required for robot health data
Wired IoT gateway (industrial Ethernet)
Most reliable in high-EMI press and welding environments — preferred for critical P1 assets
Wireless IoT (ISA100 / WirelessHART)
Lower installation cost for rotating assets in accessible locations — check EMI interference in weld shop
Edge compute node (per cell)
Local FFT computation and anomaly pre-screening before transmission — reduces network load by 90%+
↓
Layer 3
AI Analytics & Fault Detection
Where raw condition signals become failure predictions. The quality of the analytics layer determines whether PdM generates trusted alerts or alert fatigue. Three non-negotiable requirements in an automotive context:
Machine-specific baseline, not fleet average
A press that runs hotter under load has a different baseline than one at half-load. Generic thresholds generate false alarms on normal variation — destroying trust within weeks of deployment
Fault mode classification, not just anomaly detection
Identifying "outer race defect frequency on J3 bearing" is actionable. "Anomaly detected on robot 14" generates a site visit, not a repair. The alert must name the failure mode to drive the correct intervention
Production-context normalisation
A press drawing higher current at maximum tonnage is not degrading — it is working. Without load normalisation, every high-production period generates spurious alerts on healthy assets
Failure window estimation with confidence
"3–5 day failure window" enables planning. "Degrading" does not. The output of the analytics layer must be a maintenance decision, not a data observation
↓
Layer 4
Maintenance Workflow Integration
Where PdM value is either realised or lost. An alert that generates an email to a shared inbox and requires someone to manually raise a work order in a separate CMMS is a broken loop. PdM ROI requires the alert to trigger a complete maintenance workflow.
CMMS work order auto-generation
Alert triggers work order in SAP PM, Maximo, or iFactory CMMS — with fault description, parts list, estimated duration, and recommended repair window pre-populated
Parts availability check at alert time
System checks stock of required parts at alert generation — flags if parts need ordering with lead time vs estimated failure window
Production schedule coordination
Repair window scheduled in coordination with production plan — 5-day failure window is enough time to plan a 2-hour slot in the next planned downtime period
Closure and ROI capture
Work order closed with confirmation of fault found, parts used, and repair duration — vs estimated unplanned failure cost avoided. ROI documented per event, accumulated over the year
Failure Mode Coverage Matrix — What PdM Detects, and How Early
Not every failure mode is equally detectable with current sensor technology, and not every failure mode has the same lead time. Understanding which failure modes are covered — and which require a different maintenance strategy — is essential for setting realistic expectations and avoiding the alert fatigue that kills PdM programmes in their first year.
Failure mode
Detection method
Lead time
Confidence
Affected asset classes
Rolling element bearing defect
Vibration FFT — BPFO/BPFI/BSF/FTF frequencies
5–12 days
High
All rotating machinery, robots, presses, fans
Gear mesh / gearbox wear
Vibration FFT — gear mesh frequency harmonics
4–9 days
High
Gearboxes, robot joints, press drives, transfer lines
Shaft imbalance / misalignment
Vibration — 1× and 2× running speed amplitude
7–21 days
High
Fans, pumps, motors, compressors
Motor rotor bar fault
Current signature analysis (MCSA) — sideband pattern
3–7 days
High
AC induction motors — conveyors, fans, pumps
Hydraulic pump / valve degradation
Pressure fluctuation analysis + oil particle count
2–6 days
Medium
Hydraulic presses, clamping systems, die cushions
Robot servo / harmonic drive wear
Torque current deviation + cycle time drift + position error
3–8 days
Medium
Welding robots, assembly robots, material handling
Thermal / electrical insulation fault
Infrared thermography (periodic) + motor current trending
2–5 days
Medium
Transformers, switchgear, motor windings, VFDs
Lubrication failure / oil degradation
Oil viscosity + particle count + temperature trending
1–3 days
Medium
Gearboxes, compressors, hydraulic systems
Sudden catastrophic fracture
No reliable precursor — AE may give minutes, not days
Not applicable
Not PdM-suitable
Address through redundancy, duty/standby design, or redesign
The Live PdM Dashboard — Across Every Asset Class
A predictive maintenance programme running correctly produces one operational view: every monitored asset reporting its health state, active fault detections with failure window estimates, and planned interventions in the work queue. This is what that dashboard looks like across a mixed automotive plant.
Transfer Line — TL2
6-station press — Body side outer
Healthy
Index drive bearingsNormalall stations clear
Main gearboxNormalmesh frequency clean
Health score93/100no active alerts
Next planned PM14 dayscondition-triggered
Robot Cluster — BS-7 to BS-12
Fanuc R-2000iB — Floor weld
1 watch
BS-09 J3 gearboxTrending+22% vibration vs baseline
Est. failure window8–12 dayswork order raised
BS-07,08,10–12Healthyall clear
Health score72/100BS-09 drives score
Paint Shop Fan — Zone 3
Recirculation fan — oven
Intervene — 3 days
Drive-end bearingBPFO signalouter race defect confirmed
Failure window3–5 daysimmediate action
Parts statusIn stockbearing confirmed available
Health score19/100repair window booked
Press Shop — P06
1,600t stamping press
Healthy
Main drive bearingNormalvibration baseline ±4%
Clutch temperature138°Cwithin range
Health score89/100no active alerts
Last prevented failure62 days agobearing — saved £94k
The PdM Implementation Roadmap — 90 Days to First ROI
The most common reason automotive PdM programmes fail is not the technology — it is the implementation sequence. Deploying too broadly too fast, skipping the baseline period, or failing to close the loop between alert and work order are the three failure modes of PdM programmes rather than PdM assets. This is the roadmap that works.
Phase 1
Foundation — Days 1–30
Week 1
Asset prioritisation & failure history review
Pull 24 months of maintenance records. Score all assets on consequence, frequency, detectability. Agree P1 asset list — typically 5–8 assets for the pilot. Document the known failure modes and historical failure costs per asset.
Week 2
Sensor specification & OEM telematics assessment
For each P1 asset: identify available OEM telematics data, specify additional sensors required, confirm installation positions and network connectivity options. Create sensor BOM and installation schedule aligned with planned downtime windows.
Week 3–4
Sensor installation & data ingest validation
Install sensors on P1 assets during planned downtime slots. Connect OEM telematics. Validate data quality — check sampling rates, unit conversion, timestamp alignment. Confirm all P1 assets streaming to iFactory platform before baseline phase starts.
Phase 2
Baseline — Days 31–60
Week 5–6
Operational baseline build per asset
AI models learn each asset's normal operating signature across load range, ambient temperature variation, and shift pattern. No alerts raised during baseline period — this is the most common impatience failure point. Skipping the baseline produces false alarms that destroy team trust within two weeks.
Week 7–8
Alert threshold validation & workflow integration
Set alert thresholds per failure mode per asset — calibrated against the established baseline, not generic values. Test the full alert-to-work-order workflow: alert fires → CMMS work order created → technician notified → parts availability checked → repair window booked. Close this loop before live operation begins.
Phase 3
Live Operation & First ROI — Days 61–90
Week 9–10
Live alerts — first interventions
System live. First alerts reviewed with maintenance manager — confirm fault mode identification is correct before scheduling repair. First prevented failure documented: fault confirmed at inspection, repair completed in planned window, unplanned failure cost avoided recorded in the system.
Week 11–12
Pilot review & P2 asset expansion plan
90-day pilot review: alerts fired, interventions completed, ROI documented, false alarm rate, alert-to-repair cycle time. Use pilot data to build the business case for P2 asset expansion. Identify any asset where additional sensors are needed based on 60 days of operating experience.
Signals Monitored Per Asset Class — Complete Coverage Map
Comprehensive PdM coverage in an automotive plant requires different signals for different asset classes. A robot needs torque current and position error. A press needs vibration and clutch temperature. A compressor needs pressure and bearing temperature. These are the monitored signals per asset class in a full automotive PdM deployment.
Robots & servo systems
J1–J6 axis current draw vs position demand
Joint gearbox vibration — FFT per axis
Cycle time per program vs baseline
Position repeatability error trending
Servo temperature per axis controller
Presses & stamping
Main drive bearing vibration (FFT)
Clutch/brake engagement signature
Slide parallelism — load cell per corner
Hydraulic pressure and flow decay
Die cushion pressure per stroke
Transfer & conveyor systems
Index drive bearing vibration per station
Main gearbox mesh frequency monitoring
Drive motor current signature (MCSA)
Gearbox oil temperature and particle count
Chain elongation and tension (encoder drift)
Critical utilities
Compressor bearing vibration and valve plate
Paint shop fan bearing — drive end and NDE
Chiller compressor current and pressure ratio
Transformer thermal profile and load trending
VFD output current signature per drive
Want to see the coverage map built for your specific asset list? Book a demo — bring your critical asset register and 12 months of maintenance records and we'll build the PdM programme design in the first session.
What a Structured Automotive PdM Programme Delivers
The outcomes below represent documented results from automotive plants running structured PdM programmes — not pilot demonstrations but full-programme results after 12 months of live operation across P1 and P2 asset sets.
99.7%
Availability
on monitored critical assets — top-quartile programme result
45%
Fewer unplanned stops
within 12 months across P1 and P2 monitored asset sets
28%
Lower maintenance cost
total spend including parts, labour, and emergency premium
90 days
To first ROI event
from sensor installation to first documented prevented failure
Frequently Asked Questions
How is AI-based PdM different from the condition monitoring we already do with periodic vibration routes?
Periodic vibration routes are a sampling strategy — they capture the asset's condition at the moment the analyst is present, typically monthly. Between rounds, the asset can develop a fault, progress to failure, and stop the line before the next measurement. AI-based PdM is continuous — sensors stream data to the analytics platform every second, and the AI model evaluates the condition after every data point. Fast-developing faults (a bearing that goes from early-stage defect to failure in 10 days) are caught by continuous monitoring and missed by monthly routes. The second difference is the analytical layer: periodic routes rely on an analyst reviewing trend plots and applying judgement. AI models run the same fault detection logic continuously, without fatigue, weekends, or analyst availability constraints.
How do we handle robot PdM when the OEM (Fanuc, Kuka, ABB) already has a health monitoring platform?
OEM robot health platforms (Fanuc MT-LINKi, Kuka.Connect, ABB Ability) provide valuable data but have two limitations in a mixed-fleet automotive plant. First, they only cover their own brand — a body shop with Fanuc, Kuka, and ABB robots requires three separate OEM platforms with no cross-fleet view. Second, OEM platforms are optimised for the OEM's service business, not for the plant's maintenance workflow — alerts generate OEM service recommendations, not CMMS work orders. iFactory ingests data from all OEM robot telematics via standard API connections and presents a single cross-fleet health view, with alerts that integrate with the plant's own CMMS and maintenance workflow rather than routing through the OEM service channel.
What is the typical false alarm rate — and how is it managed?
False alarm rate is the most important quality metric for a PdM programme and the primary reason programmes fail in their first year. A programme generating more than one false alarm per week per monitored asset loses maintenance team trust within two months — technicians stop responding to alerts, which eliminates the programme's value entirely. iFactory manages false alarm rate through three mechanisms: machine-specific baselines rather than generic thresholds (eliminates the majority of load-variation false alarms), a 72-hour confirmation window before a "Watch" alert escalates to "Intervene" (eliminates transient anomalies), and a systematic false alarm review process in the first 60 days that adjusts per-asset thresholds based on operating experience. Target false alarm rate after the baseline period: fewer than one false alarm per monitored asset per month.
How does the programme handle shift changes and multi-shift operation — does the alert find the right person?
Alert routing in iFactory is configured by shift pattern, severity level, and asset class. A "Watch" alert (failure window greater than seven days) routes to the maintenance planner at the start of the next day shift — it is a planning input, not an emergency. An "Intervene" alert (failure window three to five days) routes immediately to the maintenance manager and the on-shift maintenance supervisor — regardless of time of day or shift rotation. A "Critical" alert (failure window under 48 hours) routes to the maintenance manager, the on-shift supervisor, and the production manager simultaneously, with an escalation to the plant manager if no acknowledgement is received within 30 minutes. Alert routing is defined per asset during the implementation phase and can be adjusted through the administration interface without an engineering change.
Can we start the programme without capital investment in new sensors — using only existing OEM telematics and PLC data?
For a significant proportion of automotive assets — modern Fanuc, Kuka, ABB, and Yaskawa robots; Schuler and Komatsu presses with connected controllers; Siemens and Rockwell VFDs with diagnostic outputs — the OEM telematics data is sufficient to run meaningful PdM without additional sensors. iFactory's first step in every engagement is a telematics audit: connect to existing data sources, assess signal quality and coverage per asset, and identify which assets have sufficient OEM data for PdM and which require additional sensors. In most automotive plants, 40–60% of P1 assets can be put into live PdM monitoring from existing data before a single new sensor is installed. This is the recommended starting point — prove the programme delivers value on existing data, then extend with targeted sensor investment where the OEM data has gaps.
Build the programme. Don't just buy the platform.
See iFactory PdM Running Across Your Automotive Plant
Bring your critical asset register, 12 months of maintenance records, and a list of your five highest-consequence failure events in the last two years. We'll build the asset prioritisation, show you what existing OEM telematics already covers, and design the sensor strategy for the gaps — before any hardware is specified.
99.7%
availability target