A stamping press that fails unplanned during a model launch window costs between $180,000 and $420,000 in direct production loss — before the cost of the repair, the premium freight to recover the schedule, and the cost of the launch engineer who spent the next 48 hours on-site instead of at the next programme. A welding robot that seizes on the body shop line on a Thursday afternoon takes the entire line down for four to eight hours depending on parts availability, with a direct production loss that typically exceeds the annual subscription cost of the AI platform that would have flagged the bearing temperature deviation three days earlier. The ROI case for AI predictive maintenance in an automotive plant is not built on averages and assumptions — it is built on the specific failure events that have already happened on your lines, the frequency with which they recur, and the cost that appears in your maintenance and production loss records every time. iFactory Predictive Maintenance is built to prevent exactly those events — across robots, presses, transfer lines, and critical utilities, live.
iFactory Predictive Maintenance — Automotive Manufacturing
ROI of AI Predictive Maintenance in Automotive Plants
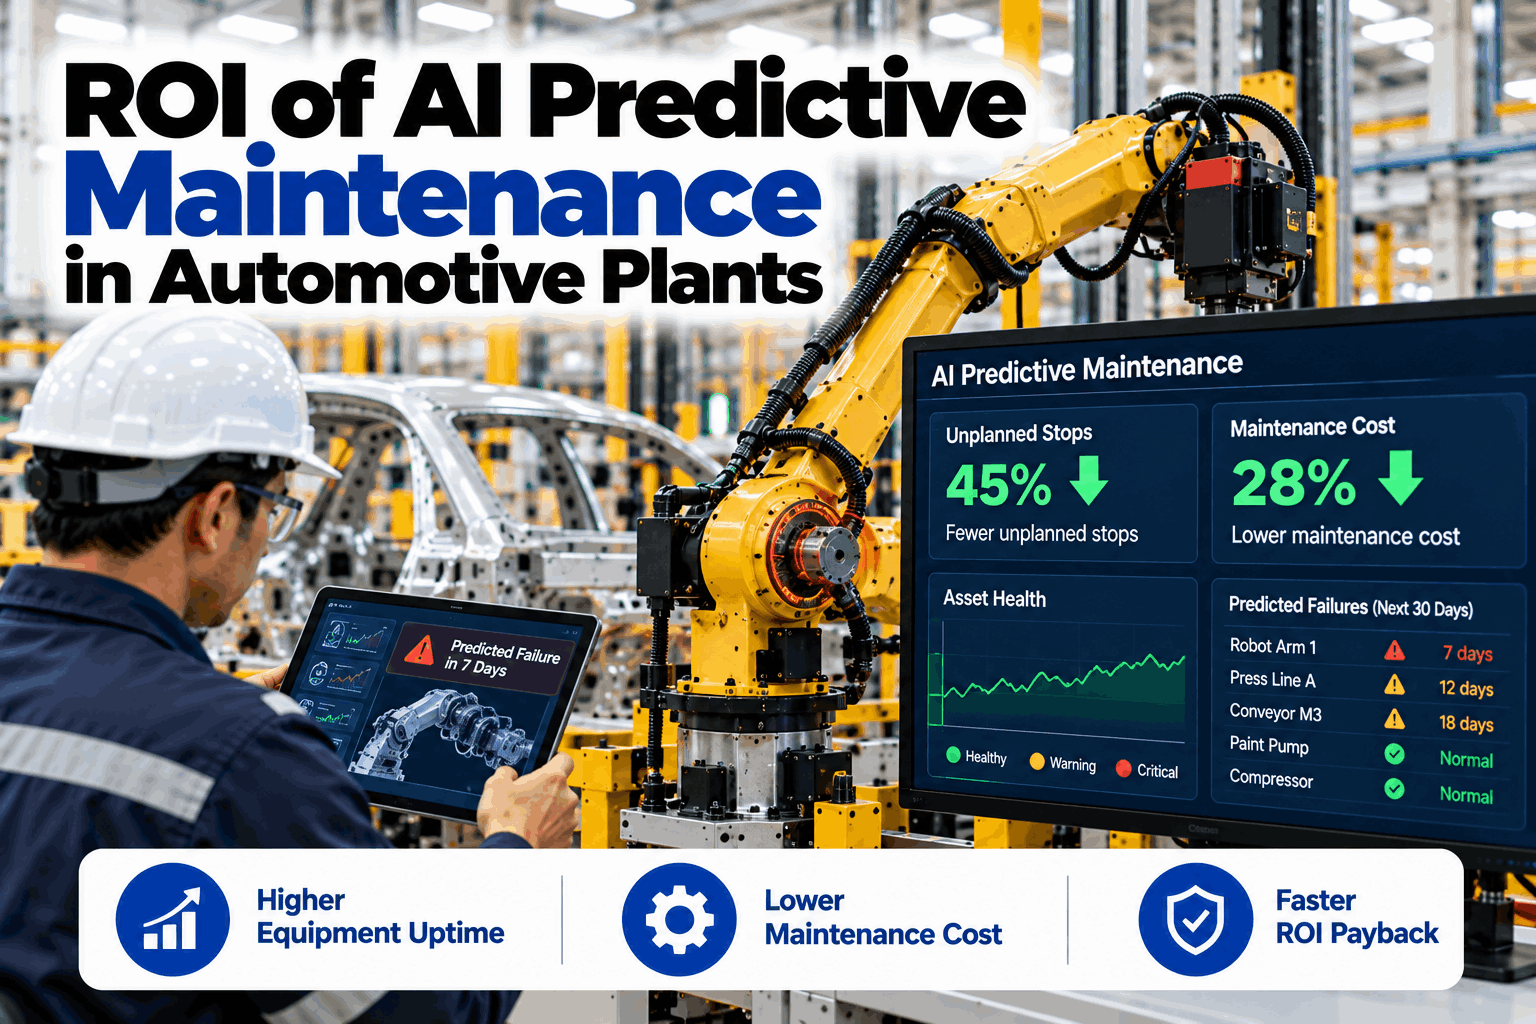
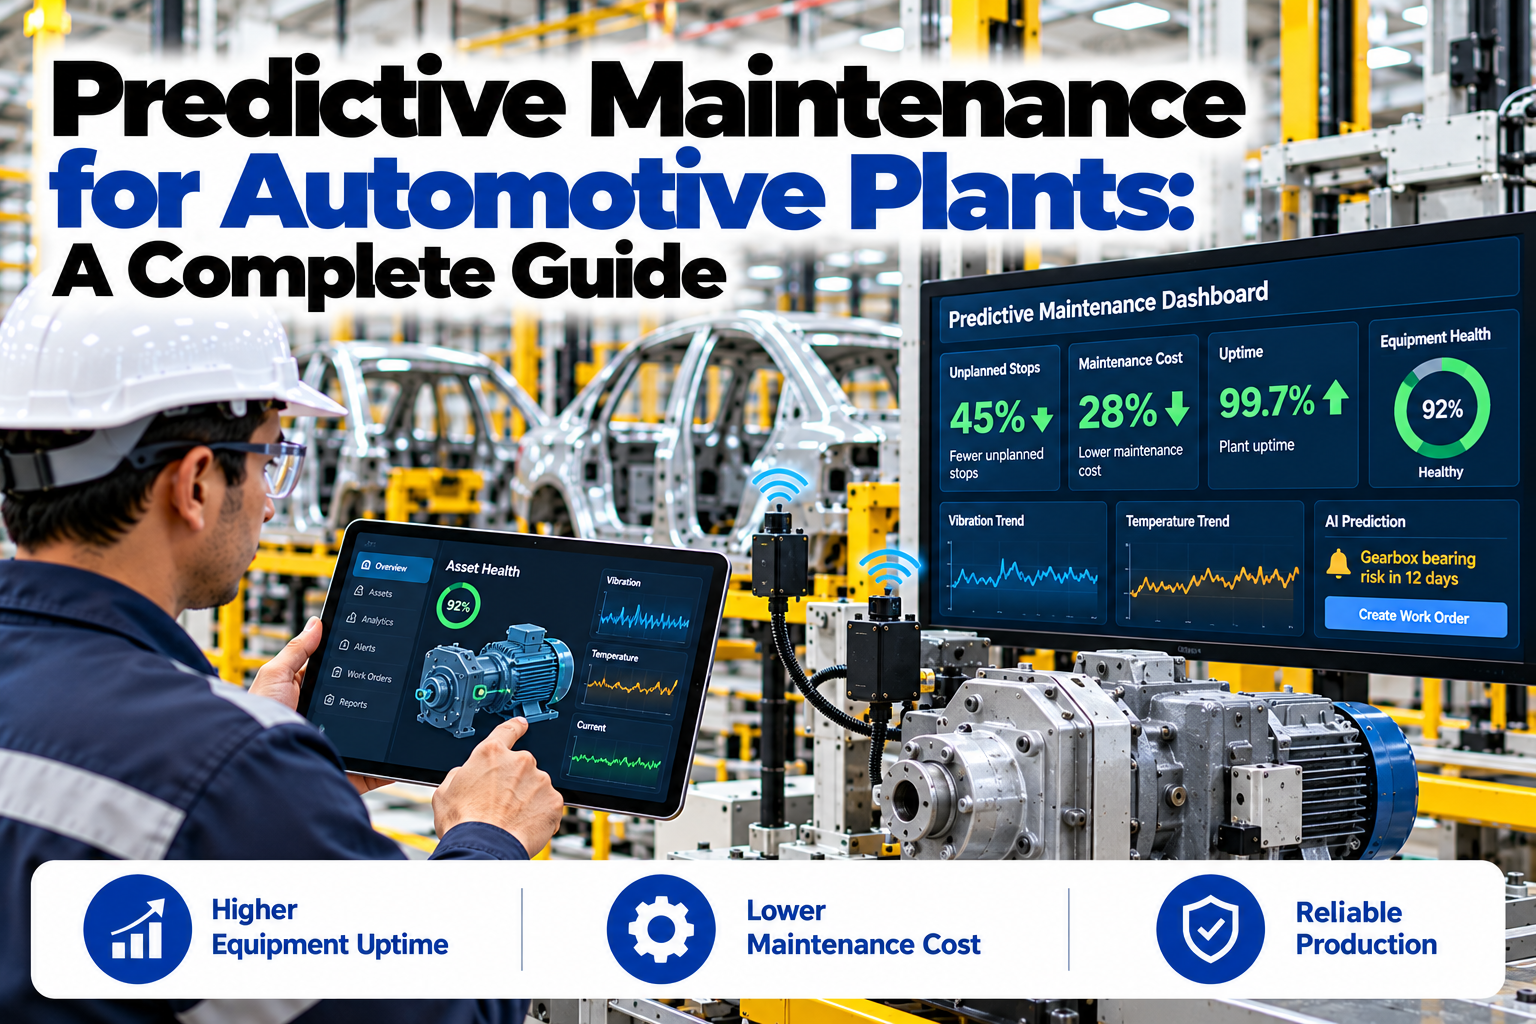
One prevented robot or press failure pays back the platform. See the real ROI math — 45% fewer unplanned stops, 28% lower maintenance cost, and a payback period measured in weeks on the assets that matter most.
45%
fewer unplanned stoppages within 12 months of full deployment
28%
lower total maintenance cost — planned vs emergency repair ratio
3–7 days
average early warning lead time — enough to plan the repair window
<6 weeks
typical payback on the first prevented press or robot failure
Why Automotive Plants Underestimate the ROI of PdM — Every Time
Most ROI calculations for predictive maintenance in automotive plants are built on the cost of the repair. The repair is the smallest number in the equation. These are the six cost categories that make a single unplanned failure in an automotive plant cost five to twenty times more than the parts and labour to fix it.
01
Direct production loss
Every hour an automotive line is down has a direct output cost — vehicles not built, revenue not realised, customer orders not shipped. At $8,000–$22,000 per hour depending on line rate and vehicle value, four hours of unplanned downtime on a press line is $32,000–$88,000 before a single tool is picked up.
02
Overtime and recovery cost
Production lost to an unplanned failure is typically recovered through weekend overtime, extended shifts, or expedited scheduling on adjacent lines. Recovery cost runs at 1.3–1.8× standard labour cost and is rarely captured in the maintenance event record — it appears in a different cost code and is never linked to the failure that caused it.
03
Premium freight and logistics
An automotive plant that misses a scheduled delivery to an OEM assembly plant triggers expedited freight on replacement stock, premium logistics charges, and in some cases airfreight of sub-assemblies from alternative suppliers. Premium freight on a single delivery miss can exceed the annual cost of the PdM platform that would have prevented it.
04
Secondary damage and repair escalation
A bearing that fails catastrophically takes the shaft, the housing, and sometimes the gearbox with it. A planned bearing replacement costs £400–£1,200. A catastrophic bearing failure on the same asset costs £8,000–£45,000 in secondary damage, extended downtime, and specialist repair labour — a 10–40× cost multiplier on the original failure.
05
Quality risk and scrap
Equipment degrading toward failure produces quality signals before the mechanical signal — dimensional variation, weld strength reduction, seal quality decline — that may not be caught until parts reach the next station, the end-of-line check, or the customer. Scrap and rework costs from a degrading asset in the period before failure are real costs that appear in the quality budget, not the maintenance budget.
06
Engineer time and opportunity cost
An unplanned failure on a critical asset pulls senior engineers — reliability engineers, process engineers, OEM technical support — away from improvement programmes, launch support, and planned maintenance. The opportunity cost of an experienced engineer spending 48 hours on a reactive breakdown is rarely quantified but consistently significant.
The Real Cost of Failure — Asset by Asset in an Automotive Plant
ROI calculations that use generic "cost per hour of downtime" figures understate the case because automotive assets have very different failure cost profiles. These are the realistic failure cost ranges for the most common high-consequence assets in automotive manufacturing — and what PdM-driven early intervention saves against each one.
Asset type
Planned replacement cost
Unplanned failure cost
Multiplier
PdM warning lead time
Stamping press — main drive bearing
£1,800 – £4,200
£95,000 – £280,000
40–65×
5–10 days
Welding robot — servo motor / gearbox
£2,400 – £6,000
£42,000 – £140,000
18–35×
3–7 days
Transfer line — indexing drive bearing
£3,200 – £7,500
£120,000 – £360,000
35–55×
4–9 days
Conveyor / overhead system — gearbox
£1,200 – £3,800
£28,000 – £95,000
15–25×
3–6 days
Paint shop oven fan — motor / bearing
£800 – £2,400
£55,000 – £180,000
45–70×
4–8 days
Compressor — plant air supply
£2,000 – £5,500
£35,000 – £110,000
15–20×
5–12 days
CNC machining centre — spindle bearing
£4,500 – £9,000
£38,000 – £120,000
8–15×
3–5 days
Hydraulic press — pump / valve pack
£1,600 – £4,800
£22,000 – £75,000
12–18×
2–5 days
The ROI Calculation — Built on Your Own Failure History
The most credible ROI case for AI predictive maintenance in an automotive plant is not built from industry averages — it is built from your own maintenance records. These are the four inputs that drive the business case, and the calculation that turns them into a payback period.
The Live Asset Health Dashboard — What the ROI Looks Like in Operation
ROI is not realised when the platform is installed — it is realised every time an alert fires and a planned repair replaces an unplanned failure. This is what the asset health dashboard looks like across a typical automotive body shop, press shop, and paint shop — with the financial impact of active alerts quantified in real time.
Press Shop — P04
2,500t Stamping Press
Healthy
Main drive bearingNormalvibration within baseline
Clutch/brake temp142°Cwithin range
Health score91/100no active alerts
Risk value protected£0no current alert
Body Shop — Robot R14
Fanuc R-2000 Weld Robot
Watch
J3 axis gearboxTrendingvibration +18% vs baseline
Est. failure window12–18 daysif trend continues
Health score64/100planned repair raised
Risk value protected£68,000est. unplanned cost avoided
Paint Shop — Oven Fan F2
Recirculation Fan — Zone 3
Intervene now
Drive-end bearingFault patternBPFO signal confirmed
Est. failure window3–5 daysimmediate action required
Health score22/100parts ordered
Risk value protected£142,000est. unplanned cost avoided
Press Shop — Transfer Line TL1
6-Station Transfer Press
Healthy
Index drive bearingsNormalall 6 stations clear
Main gearbox oil temp78°Cwithin baseline
Health score88/100no active alerts
Risk value protected£0no current alert
The Full Business Case — Five Value Streams, Not Just Repair Avoidance
Plants that build the PdM business case on repair avoidance alone capture less than half the available value. AI predictive maintenance in an automotive plant generates financial return across five distinct value streams — each with its own measurement method and its own stakeholder audience.
Unplanned downtime prevention
£45,000–£280,000 per event prevented
The primary and most quantifiable value stream. Every unplanned failure converted to a planned repair eliminates the production loss, overtime recovery, secondary damage, and premium freight that constitute the true cost of a failure event.
Measurement: unplanned downtime hours per asset class — before and after PdM deployment
🔧
Maintenance cost reduction
20–35% reduction in total maintenance spend
Condition-based repair eliminates both premature replacement (parts replaced on schedule when still serviceable) and late replacement (parts that fail before scheduled replacement). The optimal replacement point — found by PdM — is always cheaper than either alternative.
Measurement: maintenance cost per asset per operating hour — trending over 12 months
Spare parts inventory optimisation
15–25% reduction in spare parts holding cost
PdM with 5–10 day lead time enables just-in-time parts procurement for planned interventions — reducing the buffer stock held for emergency breakdowns. Plants typically reduce spare parts inventory value by 15–25% while improving availability of critical parts when needed.
Measurement: emergency purchase orders vs planned purchase orders — ratio and cost
Quality and scrap reduction
8–18% reduction in quality-related scrap on monitored lines
Equipment degrading toward failure produces quality deviation before the mechanical failure. PdM-triggered early intervention removes the degrading asset before it produces out-of-spec parts — reducing scrap and rework on lines where dimensional accuracy or weld strength is linked to equipment condition.
Measurement: scrap and rework cost per line — correlated with maintenance state of critical assets
Maintenance engineer productivity
30–40% of reactive maintenance time recovered
Reactive breakdown maintenance is the highest-cost, lowest-efficiency use of skilled maintenance engineers. Converting 45% of unplanned failures to planned repairs releases engineer time from emergency response to improvement programmes, technical training, and systematic reliability work that compounds returns over time.
Measurement: reactive vs planned maintenance hours ratio — tracked weekly
How iFactory PdM Delivers the ROI — From Sensor to Saved Cost
The ROI of AI predictive maintenance is only realised if the alert fires early enough to plan the intervention, the intervention happens before the failure, and the cost of the avoided failure is captured in the record. Each step in this loop is where iFactory converts a health signal into a documented financial return.
01
Sensor & Data Ingest
Vibration, temperature, current, oil condition, and acoustic emission sensors connected to every monitored asset — via OEM telematics, retrofit IoT sensors, or existing PLC/SCADA data streams. No data, no prediction.
02
AI Fault Detection
Machine learning models trained on each asset's own operating history — not a generic threshold. Fault signatures (bearing BPFO/BPFI, gear mesh frequency, thermal runaway precursors) detected 3–10 days before the failure threshold is crossed.
03
Ranked Alert & Cost Estimate
Alert ranked by estimated failure window and production consequence — "Paint shop fan F2, bearing fault, 3–5 day window, estimated unplanned cost if not actioned: £142,000." The maintenance manager gets a decision, not a raw alarm.
04
Planned Intervention
Parts ordered, repair window scheduled in the planned downtime slot, technician assigned, OEM technical support notified if required. The repair is executed in a 2-hour planned window instead of a 6–18 hour emergency breakdown.
05
ROI Capture & Report
Every prevented failure closed in the system with: estimated unplanned cost avoided, actual planned repair cost, net saving, and cumulative ROI to date. Business case evidence builds automatically — ready for the next budget review without a spreadsheet.
OEM vs Tier 1 — ROI Profiles Differ, Both Are Compelling
The ROI case for AI predictive maintenance differs between OEM assembly plants and Tier 1/2 suppliers — not in direction but in the dominant value driver. Both cases are strong. The calculation input that matters most is different for each.
OEM Assembly Plant
"Every hour of line downtime costs us the line rate across the entire plant."
Dominant cost driver: production loss — £12,000–£22,000/hr across the whole line
Critical assets: body shop robots, paint shop conveyors, final assembly tools
ROI case led by: availability improvement and MTTR reduction
Payback trigger: one prevented body shop line stop — typically 4–8 hours
Typical year-one ROI: 400–700% on monitored asset set
Tier 1 / Tier 2 Supplier
"A missed delivery to the OEM is a premium freight charge plus a PPAP conversation."
Dominant cost driver: customer penalty + expedited freight + premium recovery cost
Critical assets: presses, welding lines, CMMs, end-of-line test equipment
ROI case led by: delivery reliability and quality-linked failure prevention
Payback trigger: one prevented press failure that would have caused a delivery miss
Typical year-one ROI: 300–550% on monitored asset set
Assets and Failure Modes iFactory Monitors in Automotive
AI predictive maintenance ROI is only realised on the failure modes the system actually monitors. These are the asset classes and failure modes that drive the highest failure cost in automotive manufacturing — and that iFactory's models are trained to detect.
Rotating machinery
Rolling element bearing defects (BPFO, BPFI, BSF, FTF)
Gear mesh frequency anomalies — gearbox wear
Shaft imbalance and misalignment — vibration signature
Motor current signature analysis (MCSA)
Oil temperature divergence from load-normalised baseline
Robots & servo systems
Axis gearbox vibration — each axis monitored independently
Servo current draw vs position demand — deterioration signal
Cycle time drift — early indicator of mechanical resistance
Joint temperature profile — bearing and harmonic drive wear
Repeatability drift — path accuracy degradation early warning
Presses & stamping
Main drive and flywheel bearing vibration — FFT analysis
Clutch / brake engagement signature — wear pattern
Slide parallelism and guide wear — force monitoring
Hydraulic pressure and flow decay — pump and valve wear
Die cushion pressure consistency — per-stroke monitoring
Utilities & critical infrastructure
Compressor bearing and valve plate condition
Paint shop oven fan bearing and belt condition
Chiller compressor and cooling tower pump health
Transformer temperature and load — degradation signal
Conveyor and overhead system drive health
Want to see the ROI calculation built on your own failure history? Book a demo — bring 12 months of maintenance records and we'll build the business case from your actual failure events, not industry averages.
What AI Predictive Maintenance Delivers — Documented, Per Asset
The outcomes below are not projections built on assumptions. They are the ranges that automotive plants document after 12 months of AI predictive maintenance deployment on the asset classes that carry the highest failure cost.
45%
Fewer unplanned stops
on monitored assets within 12 months of deployment
28%
Lower maintenance cost
total spend — planned replacement vs reactive emergency repair
300–700%
Year-one ROI
OEM and Tier 1 plants — built from actual prevented failure events
<6 weeks
First payback event
time from deployment to first prevented failure that exceeds platform cost
Frequently Asked Questions
How do we capture and document the ROI of each prevented failure — not just estimate it upfront?
iFactory tracks every alert that results in a planned intervention and closes the event with a documented saving calculation: the estimated unplanned failure cost (based on the asset's historical failure cost profile and the estimated downtime duration for an unplanned event on that asset), minus the actual planned repair cost, equals the documented net saving for that event. These savings are accumulated in a running ROI dashboard — so at any point in the year, the maintenance manager and plant director can see cumulative documented savings against platform cost. This is the evidence base for the next year's budget submission, not a projection from the original business case.
What is the minimum asset set required to justify the investment?
For most automotive plants, monitoring five to eight high-consequence assets — the press main drives, the body shop robots on the most critical weld stations, and the paint shop oven fans — is sufficient to generate a positive ROI in year one. The calculation is straightforward: if any one of those assets fails unplanned, does the production loss exceed the annual platform cost? In the vast majority of automotive plants, the answer is yes for the press line alone. The business case does not require monitoring the entire plant — it requires identifying the six to eight assets where a single failure costs more than the annual subscription.
How does iFactory handle assets where OEM telematics data is already available — Fanuc, Kuka, ABB robots?
iFactory ingests OEM telematics data directly for Fanuc (MT-LINKi / FOCAS), Kuka (KRC4/5 OPC-UA), ABB (OmniCore / IRC5 data), Yaskawa, and Comau robots — as well as press controller data from Schuler, Komatsu, and Aida via OPC-UA or Ethernet/IP. Where OEM telematics covers the relevant health signals (current, torque, cycle time, alarm logs), retrofit sensors are not required. Where OEM data lacks the vibration or acoustic signal needed for bearing fault detection, iFactory adds a lightweight retrofit sensor that feeds the same platform as the telematics data. The starting point is always to assess what the existing OEM data covers before specifying additional hardware.
What does the implementation timeline look like — how long until we see the first ROI?
Week 1–2: sensor audit and OEM telematics connection. Week 3–4: data ingestion and baseline model build per asset. Week 5–8: models tuned against the first four weeks of live data, alert thresholds set. From week 8, the system is live with validated baselines. First ROI event (first prevented failure that generates a documented saving) typically occurs within 4–10 weeks of go-live, depending on asset condition at deployment and the historical failure frequency of the monitored assets. Plants that deploy on assets with a known degradation history — where maintenance teams already suspect a failure is approaching — sometimes see the first ROI event in the first two weeks.
Can we run a pilot on two or three assets before committing to the full business case?
Yes — and this is the most common deployment path in automotive. A pilot focuses on three to five assets selected by failure consequence and failure frequency: typically the press line main drive, the highest-utilisation body shop robot cluster, and one utility asset (oven fan or compressor). The pilot runs for 90 days: 30 days to build baselines, 60 days of live monitoring. At the end of 90 days, the pilot report shows every alert that fired, the health trajectories of every monitored asset, and the documented saving from any planned intervention triggered by an alert. This is the business case for full deployment — built from your data, your assets, and your failure costs. Book a demo with your maintenance records and we'll identify the right pilot assets together.
One prevented press failure pays back the platform. Build the case.
See the ROI of AI Predictive Maintenance on Your Automotive Plant
Bring 12 months of maintenance records and your five highest-consequence assets. We'll build the ROI calculation from your actual failure events, show you what the AI models would have detected on your historical data, and give you the documented business case — before a single sensor is installed.
45%
fewer unplanned stops
Documented
per event saved