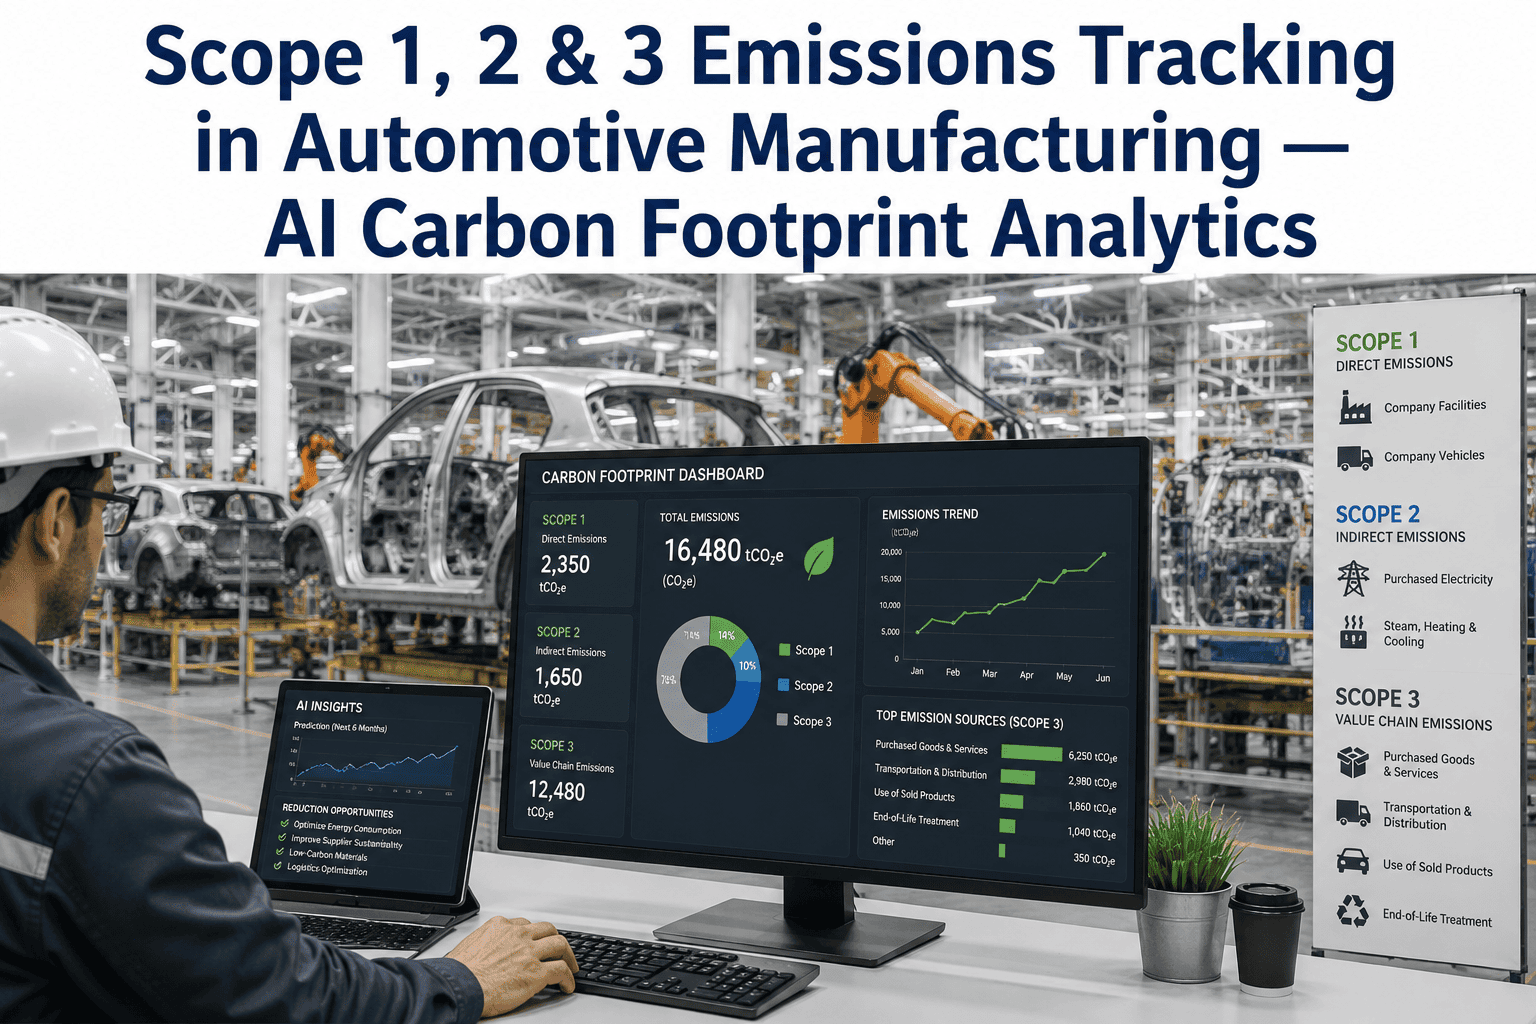
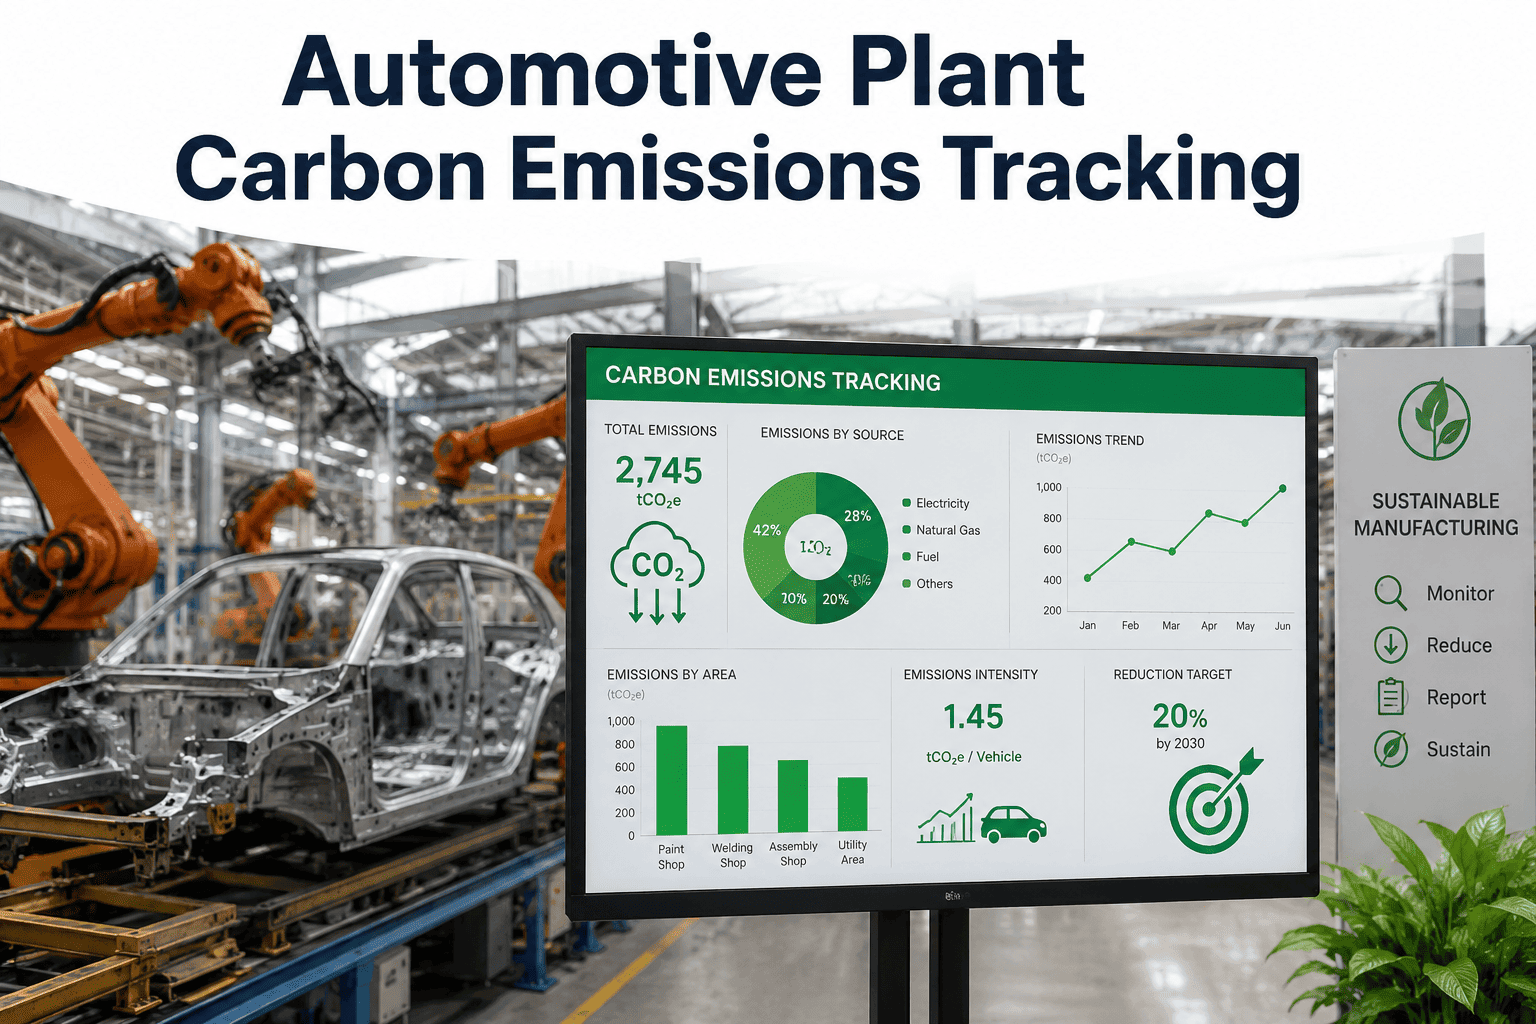
An automotive OEM sustainability scorecard rarely asks a Tier 1 supplier for a rough estimate anymore — it asks for verified Scope 1, Scope 2, and increasingly Scope 3 emissions data broken down by plant, by process, and often by part number. Most manufacturers are still assembling that picture from utility bills, fuel logs, and spreadsheet-based supplier surveys collected once a year, which means the numbers going into a customer's sustainability report are already stale before they are submitted. iFactory pulls emissions data continuously from metered energy consumption, fuel usage, and upstream supplier disclosures, and turns a once-a-year reporting scramble into a live carbon footprint dashboard — see how it fits your plant at iFactory support.
AI-Driven Carbon Analytics · Automotive Manufacturing
Scope 1, 2 and 3 Emissions Tracking: Replace the Annual Carbon Reporting Scramble With a Live Footprint Dashboard
iFactory automates emissions data collection across fuel combustion, purchased electricity, and upstream supply chain activity, then maps the results directly to the OEM sustainability scorecard categories your customers are actually asking about.
Scope 1
Direct emissions from natural gas boilers, fleet vehicles, and on-site fuel combustion
18% of typical footprint
Scope 2
Indirect emissions from purchased electricity powering plant equipment and facilities
27% of typical footprint
Scope 3
Upstream and downstream emissions across raw materials, logistics, and supplier activity
55% of typical footprint
The Reporting Gap
Why the Annual Sustainability Survey Approach Is Running Out of Road
Most Tier 1 and Tier 2 automotive suppliers still assemble their carbon footprint once a year, pulling utility invoices, fuel purchase records, and supplier questionnaire responses into a single spreadsheet ahead of an OEM's sustainability reporting deadline.
Data Already Stale on Submission
A footprint calculated from last year's utility bills reflects operating conditions that may no longer be true, especially after a line expansion or an equipment upgrade.
Scope 3 Is Mostly Guesswork
Upstream emissions from raw material suppliers and inbound logistics are frequently estimated using industry-average emission factors rather than actual supplier-reported data.
No Plant-Level Accountability
A single consolidated company-wide number gives no visibility into which specific plant, line, or process is driving the largest share of the footprint.
Scorecard Mismatch Risk
Each OEM structures its sustainability scorecard slightly differently, and manually remapping one internal number to five different customer formats invites transcription error.
How Continuous Tracking Works
From Metered Consumption to OEM-Ready Reporting, Without the Spreadsheet Handoffs
1
Metered Data Ingestion
Electricity meters, natural gas flow data, and fleet fuel logs feed emissions data continuously rather than being reconstructed from monthly billing statements.
2
Process-Level Allocation
Plant-wide energy consumption is allocated down to individual lines and major equipment based on metering granularity, showing which processes actually drive the footprint.
3
Supplier Data Integration
Scope 3 upstream figures are pulled from supplier-submitted disclosures where available and reconciled against recognized emission factor databases where actual data is not yet reported.
4
Scorecard-Ready Output
Results are formatted to match individual OEM sustainability scorecard structures, reducing the manual remapping work every reporting cycle currently requires.
Your Carbon Footprint Changes Every Shift. Your Reporting Shouldn't Only Update Once a Year.
iFactory keeps Scope 1, 2, and 3 data current continuously, so a sustainability report is a data pull, not a quarterly project.
Annual Survey vs. Continuous Tracking
Carbon Footprint Reporting — Manual Compilation vs. iFactory Live Analytics
Reporting Element
Annual Manual Compilation
iFactory Continuous Tracking
Scope 1 & 2 Data
Reconstructed from monthly utility bills and fuel purchase logs once a year
Pulled from metered consumption data continuously, current to the shift
Scope 3 Upstream Data
Estimated largely from industry-average emission factors due to limited supplier disclosure
Reconciled against actual supplier-submitted data wherever it is available
Plant-Level Visibility
Single consolidated figure with no line-level or process-level breakdown
Allocated down to individual lines and major equipment based on metering data
OEM Scorecard Mapping
Manually remapped to each customer's scorecard format every reporting cycle
Auto-formatted to individual OEM scorecard structures on demand
Reduction Target Tracking
Progress checked once a year against the same annual figure used for reporting
Tracked continuously against reduction targets, with drift flagged early
Measured Outcomes
What Sustainability and EHS Teams See After Deploying Continuous Emissions Tracking
80%
Less Time Spent on Annual Reporting
EHS teams report a major reduction in the hours spent compiling utility bills and supplier surveys into a single annual carbon report.
3x
More Scope 3 Data From Actual Suppliers
Suppliers using structured disclosure integration report a significant increase in Scope 3 figures based on actual data rather than industry averages.
Real-Time
Scope 1 & 2 Data Currency
Metered consumption data keeps direct and purchased-energy emissions current to the shift rather than the billing cycle.
5+
OEM Scorecard Formats Supported
Multi-customer suppliers report generating scorecard-ready output for multiple OEM formats from a single underlying data set.
Weekly
Reduction Target Progress Visibility
Teams tracking against a formal reduction target move from an annual check-in to reviewing progress on a recurring basis throughout the year.
10–14 days
Typical Deployment Timeline
Time from integration kickoff to a live emissions dashboard for a plant with existing sub-metering in place.
Field Case
Finding a Scope 2 Reduction Opportunity Buried in a Consolidated Utility Bill
A stamping and assembly supplier reporting a single consolidated Scope 2 figure to its OEM customers had no visibility into which of its three production lines was driving the largest share of purchased-electricity emissions. After connecting sub-metering data into a continuous emissions dashboard, the breakdown showed one line consuming disproportionately more electricity per unit produced than the other two, traced back to an aging compressed air system running well past its efficient operating range. Correcting the compressed air system reduced that line's Scope 2 contribution meaningfully and gave the sustainability team a specific, defensible reduction project to report against its OEM target rather than a vague company-wide efficiency initiative.
1 of 3Lines identified as primary driver
1Root cause: aging compressed air system
1Defensible reduction project reported
Frequently Asked Questions
Scope 1, 2 and 3 Emissions Tracking — What Sustainability Teams Ask First
What emissions accounting standard does iFactory follow?
iFactory structures emissions data according to the GHG Protocol Corporate Standard, the most widely used accounting framework for Scope 1, 2, and 3 reporting, which is also the basis most OEM sustainability scorecards are built on. Scope 1 covers direct emissions from owned or controlled sources such as natural gas combustion and fleet vehicles, Scope 2 covers purchased electricity, steam, heating, and cooling, and Scope 3 covers the full range of upstream and downstream value chain emissions categories that apply to a manufacturing operation.
Book a Demo to review which Scope 3 categories are most relevant to your operation.
How does iFactory get Scope 3 data when most suppliers don't report actual figures?
Scope 3 tracking uses a tiered approach: where a supplier submits actual activity data through a structured disclosure process, that data is used directly; where no supplier data is available, recognized industry emission factors are applied as a reasonable estimate, clearly flagged as estimated rather than measured. Over time, as more suppliers are onboarded into structured reporting, the proportion of Scope 3 figures based on actual data increases, and the dashboard tracks that improvement so a sustainability team can show measurable progress on data quality, not just on the footprint number itself.
Do we need new sub-metering to get plant-level and line-level breakdowns?
Plant-level breakdowns are typically available immediately using existing utility metering, and line-level or equipment-level breakdowns depend on how granular the existing sub-metering already is. Many automotive plants already have sub-metering on major equipment such as paint booths, ovens, and compressed air systems, and iFactory connects to that instrumentation directly. Where deeper granularity is needed for a specific reduction initiative, iFactory can recommend targeted sub-metering additions rather than requiring a full facility re-instrumentation.
Contact support to review your current metering coverage.
Can this handle reporting to multiple OEM customers with different scorecard formats?
Yes — this is one of the most common reasons suppliers move away from a manual annual compilation process, since maintaining separate spreadsheets for each OEM's specific scorecard format is time-consuming and error-prone. iFactory maintains a single underlying emissions data set and generates formatted output matching each individual OEM's sustainability scorecard structure on demand, so the same verified data set supports every customer relationship without duplicate data entry.
How long does it take to get a live emissions dashboard running?
For a plant with existing utility and sub-metering data already accessible, a live dashboard typically goes live in 10 to 14 days, covering data connection, emission factor configuration, and validation against the prior year's manually compiled figures to confirm accuracy. Multi-plant deployments, or plants requiring new sub-metering for line-level detail, generally take three to six weeks depending on the scope of instrumentation involved.
Book a Demo to get a configuration timeline for your facility.
Stop Rebuilding Your Carbon Footprint From Scratch Every Reporting Season. Track It Continuously Instead.
Automated Scope 1, 2, and 3 emissions tracking mapped directly to OEM sustainability scorecards — live in as little as 10 days.