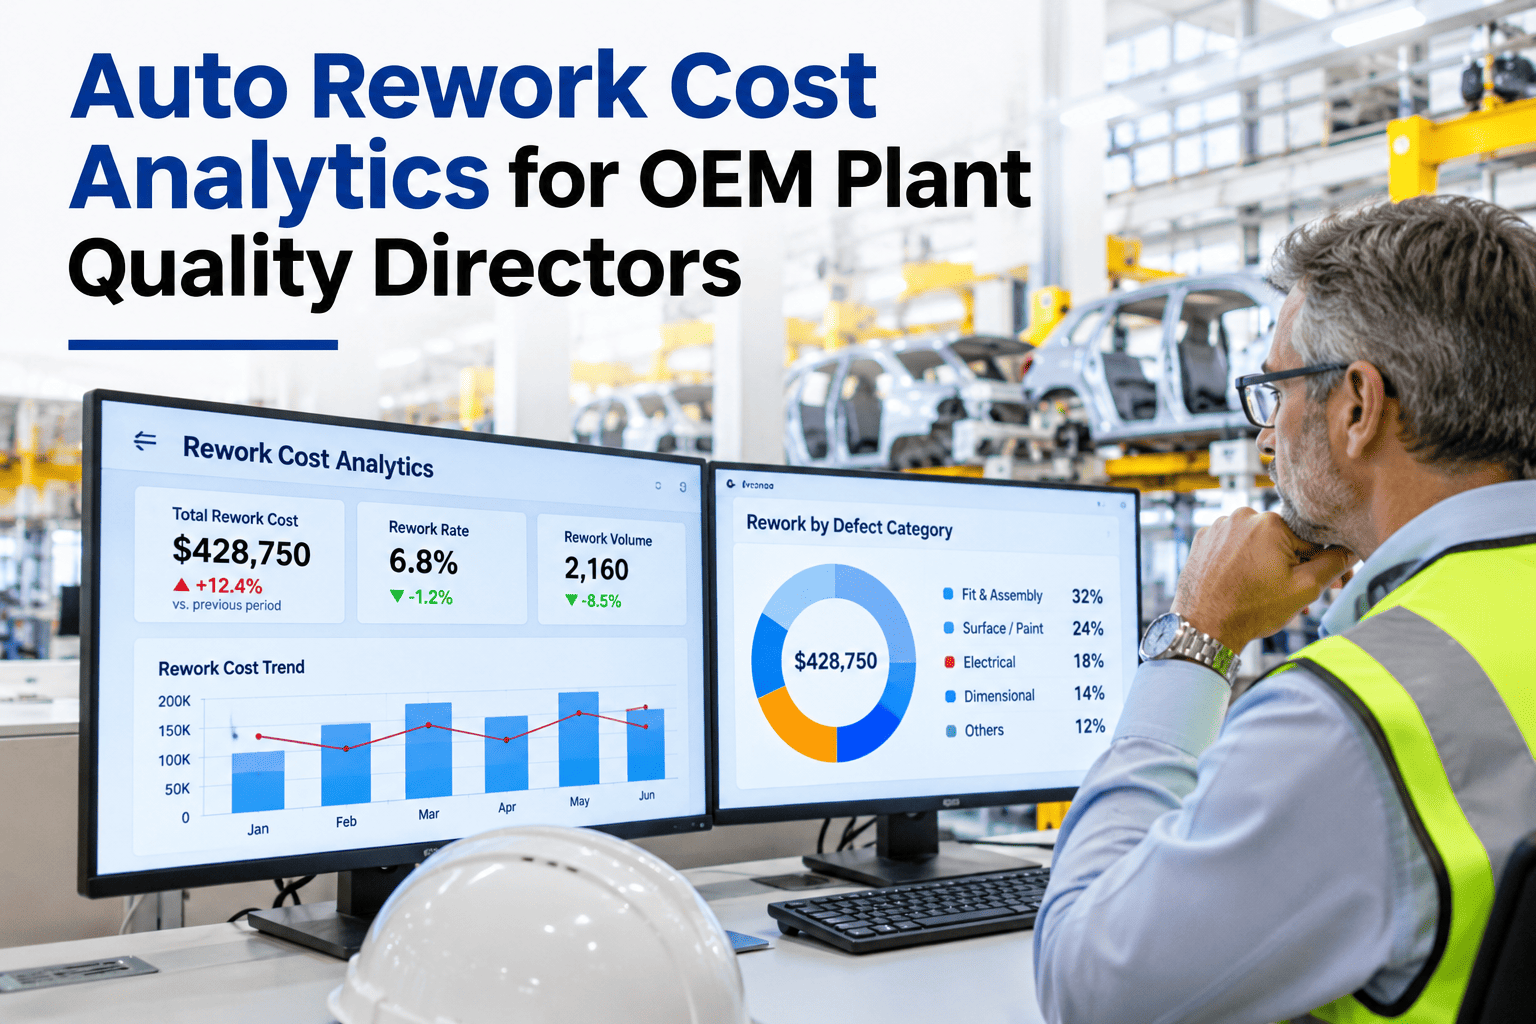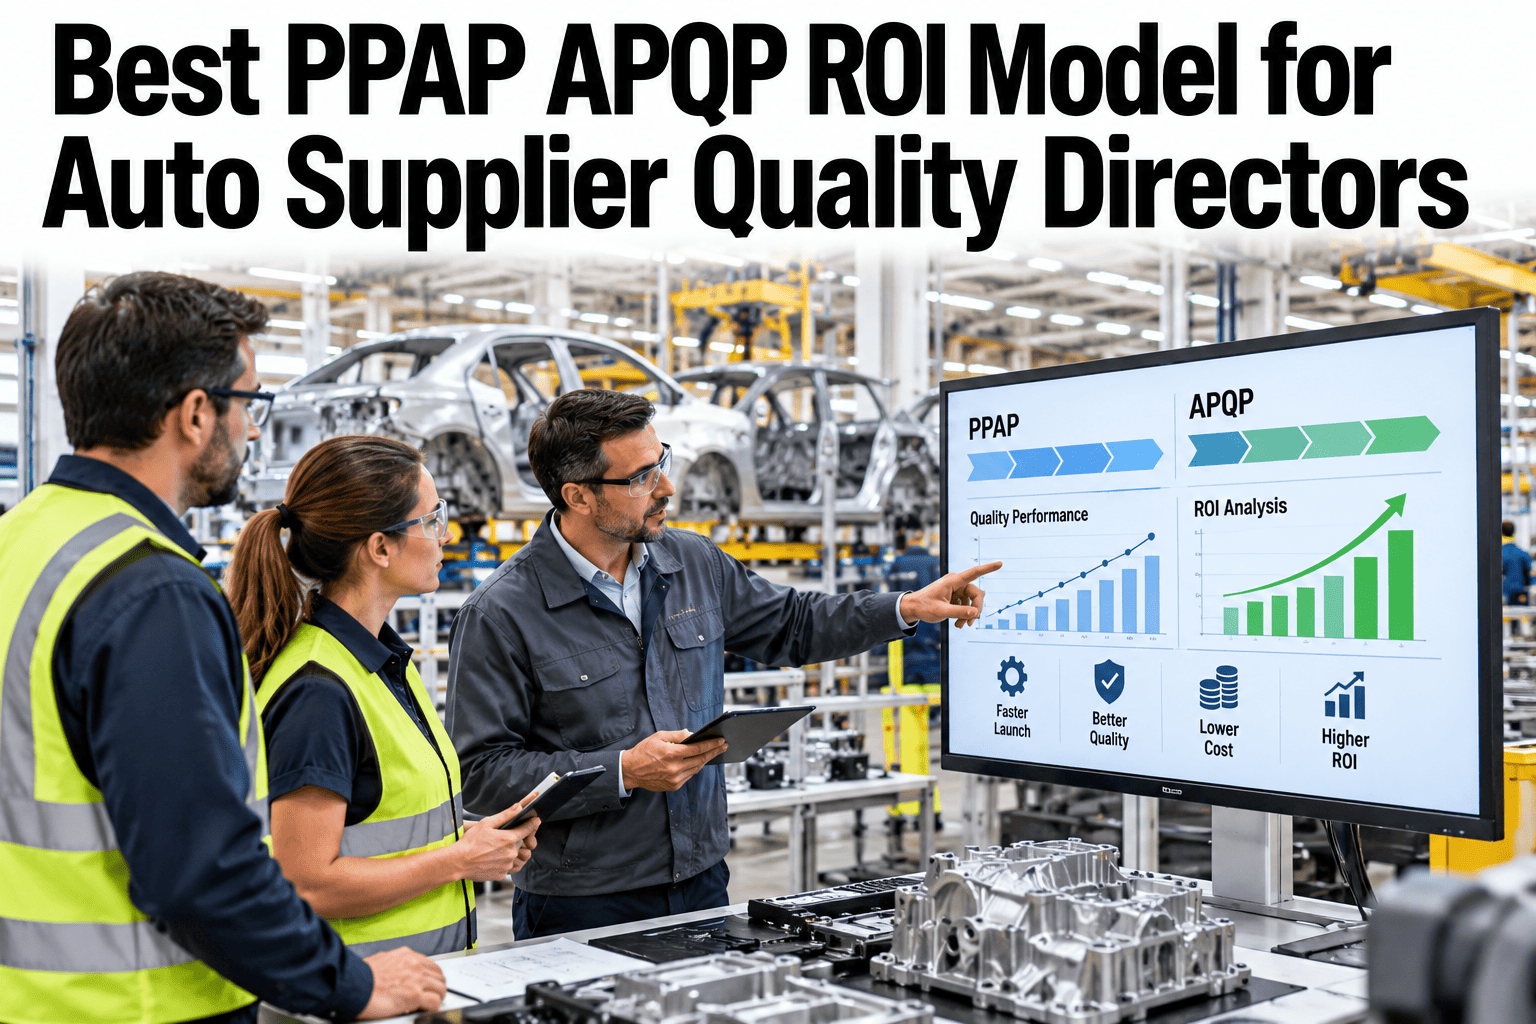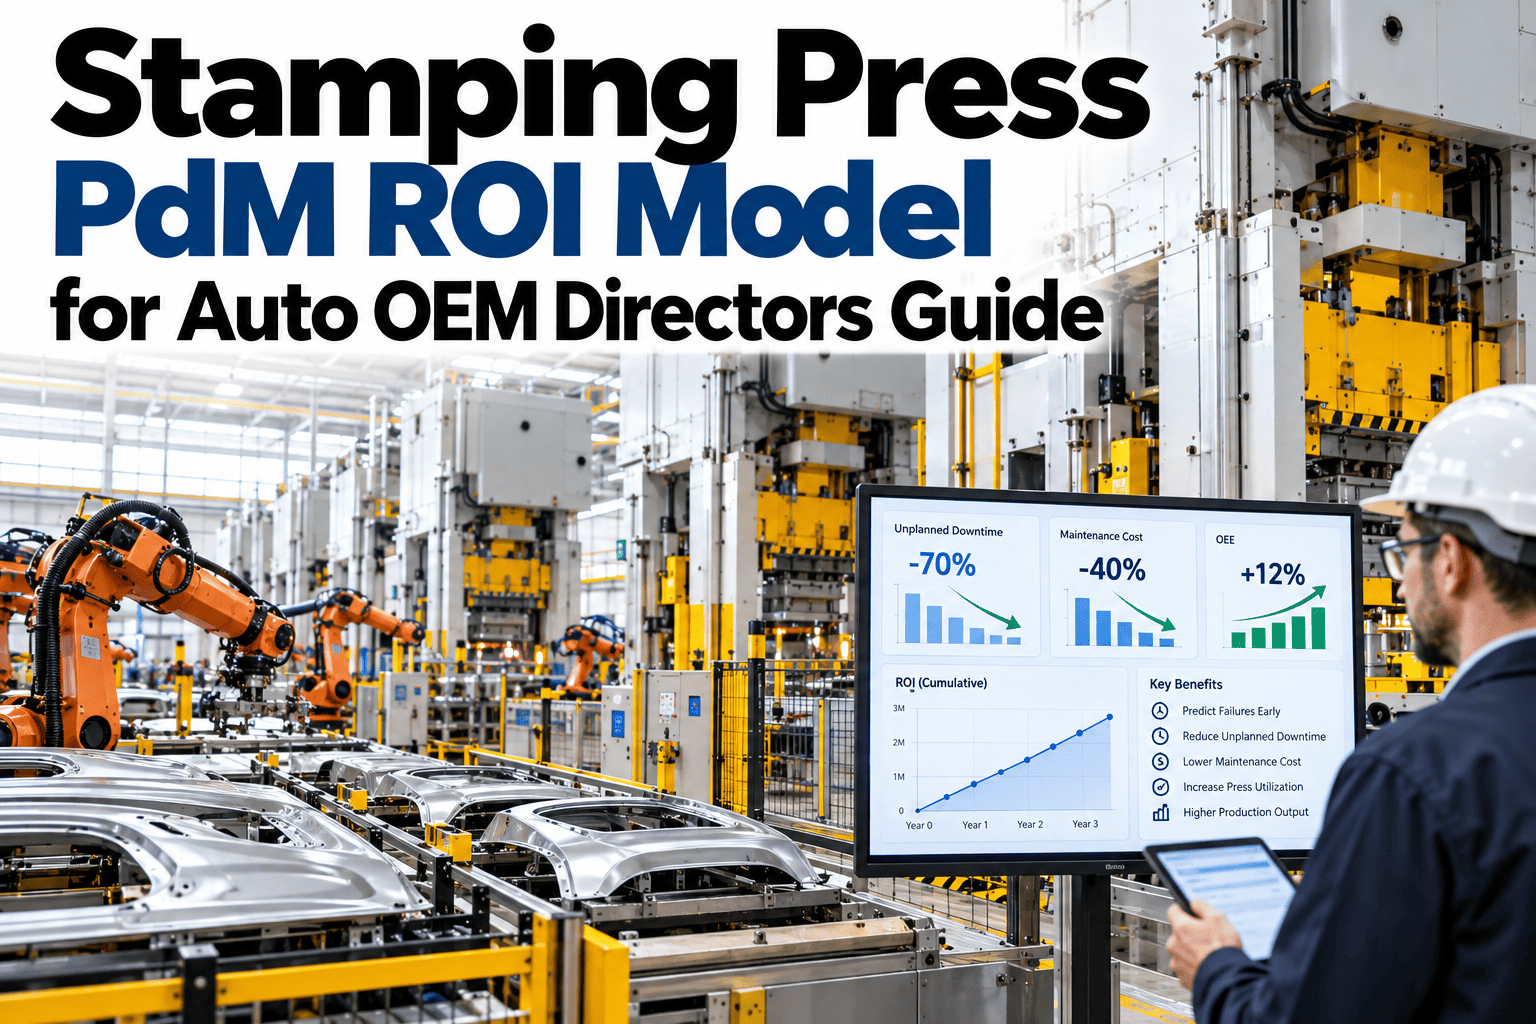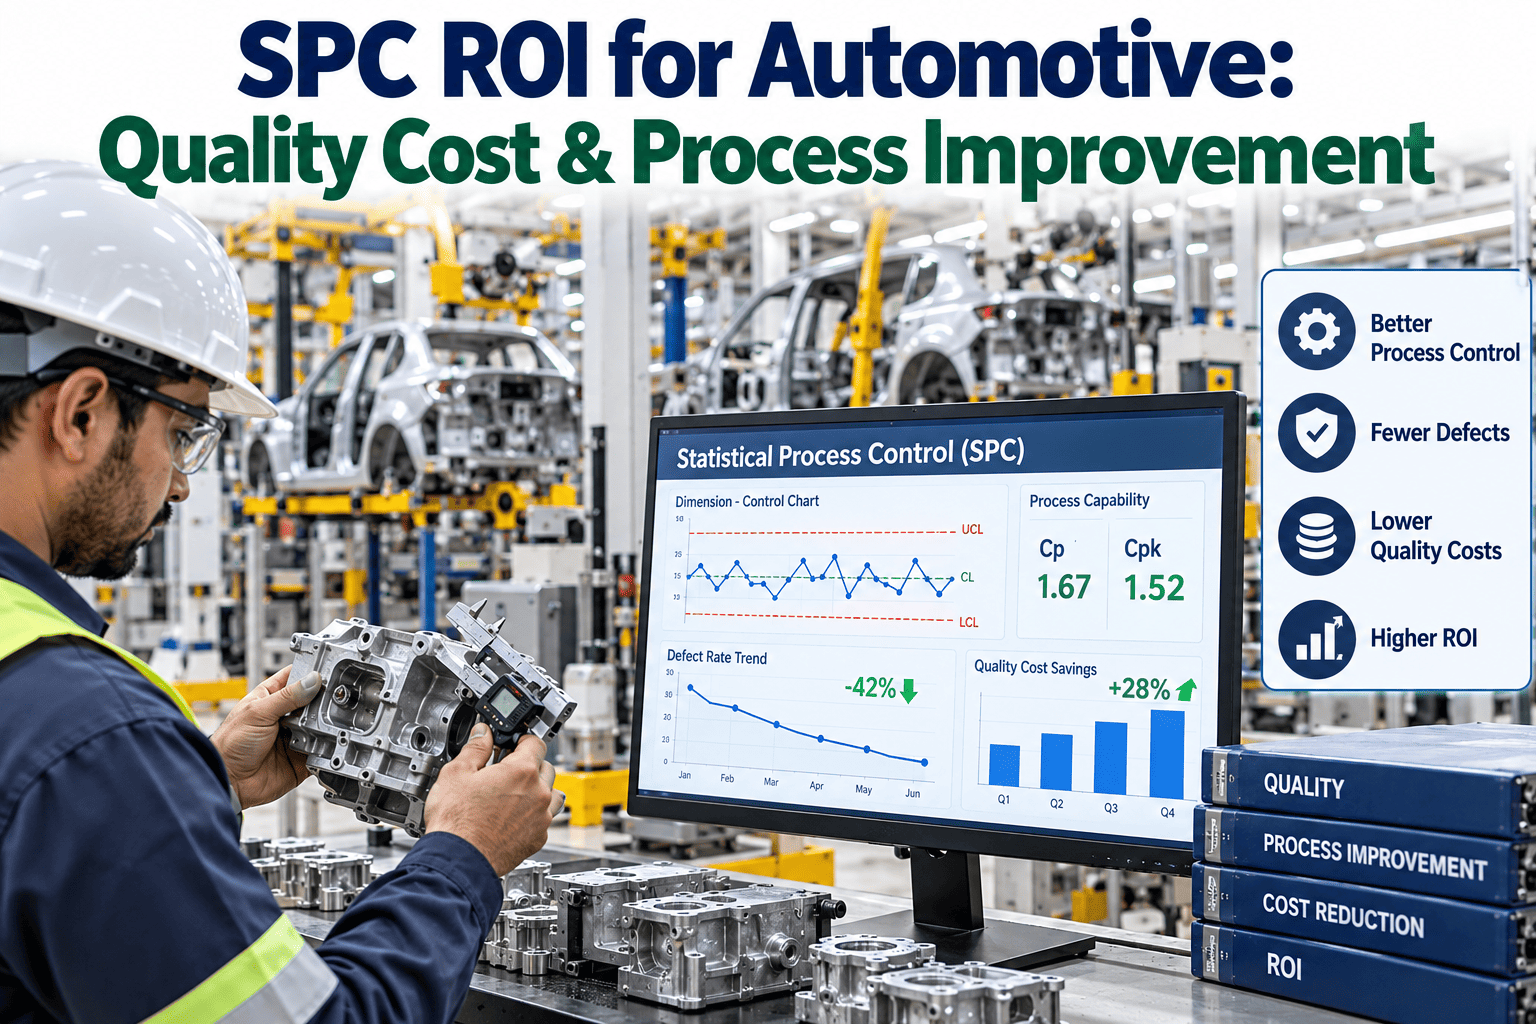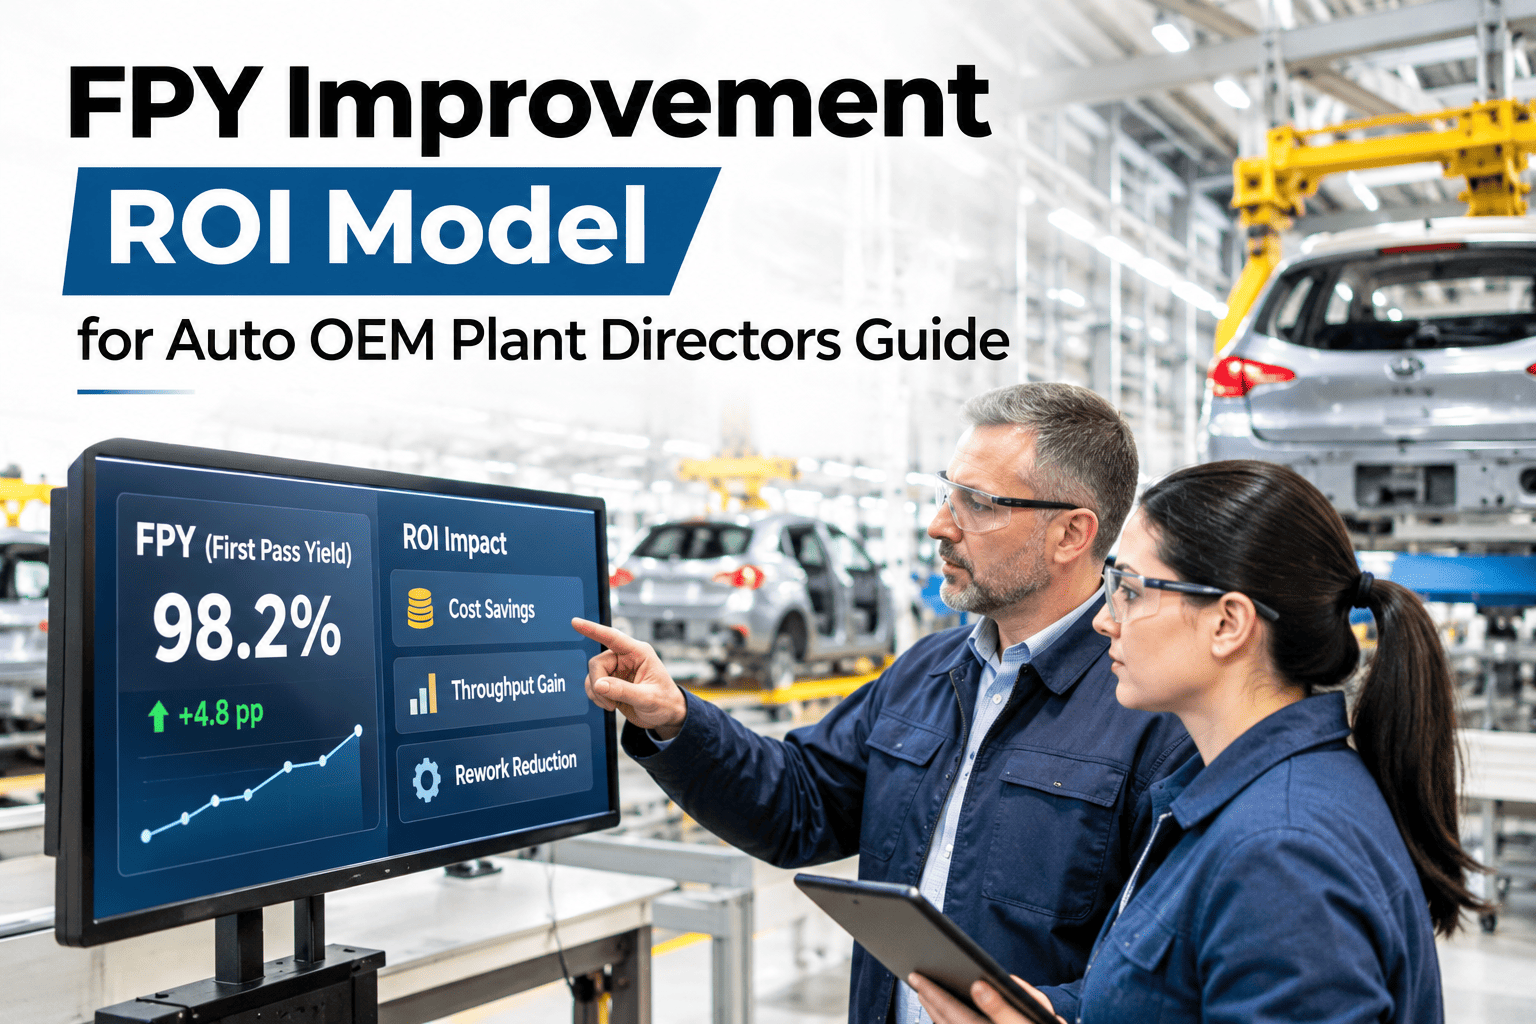
A plant director proposing a first-pass-yield improvement program needs to answer one question before anything else gets discussed: what is a single point of FPY actually worth in dollars at this specific plant? Without that number, "we want to improve FPY by two points" is a goal with no way to judge whether the program cost justifies it. Auto OEM plant directors building their own FPY case can calculate their plant's per-point FPY value with iFactory AI.
Before You Pitch an FPY Program, Know What One Point Is Actually Worth
iFactory AI quantifies your plant's per-point FPY value, stacks it against realistic program costs, and frames a payback timeline finance can evaluate.
Quantifying What One Point of FPY Is Worth
A one-point FPY improvement means fewer units requiring rework or scrap across your total production volume. Translating that into dollars requires your plant's actual volume, average rework cost per unit, and scrap rate, not an industry rule of thumb.
Stacking Program Cost Against the Value
| Cost category | What it typically includes |
|---|---|
| Data and integration | Connecting station-level quality data into one view |
| Process changes | Fixture, tooling or procedure updates at targeted stations |
| Training | Operator and technician time to adopt new standards |
| Ongoing monitoring | Continued tracking to confirm the gain holds over time |
Build a Payback Timeline Using Your Own Plant's Numbers
Bring your current FPY, volume and cost data to a short session and see a defensible payback timeline for your own program.
Why a Two-Year Payback Framing Tends to Land Better Than a Projected Point Gain
Promising a specific FPY point gain by a specific date invites questions about how confident that number really is. Framing the case instead as "this program pays for itself within roughly two years at a conservative improvement estimate" gives finance a decision they can evaluate without betting the whole case on hitting an exact target.
That framing also holds up better if the actual gain comes in lower than hoped, since the case was never built entirely on the optimistic number in the first place — a structure iFactory AI's team can help build around your own plant's realistic range.
A Composite Scenario: The Program That Got Approved on the Conservative Case
A plant director's first FPY proposal projected an optimistic three-point gain and was questioned heavily on how that number was derived. Rebuilding the case around a conservative one-point gain, stacked against the full program cost including training and ongoing monitoring, produced a payback period finance could verify independently rather than take on faith. The program was approved on the strength of the conservative case, and the actual gain achieved exceeded it within the first year.
Frequently Asked Questions
Build an FPY Case Finance Can Approve With Confidence
iFactory AI quantifies your per-point FPY value and frames a conservative, defensible payback timeline. Book a working session with your own data.