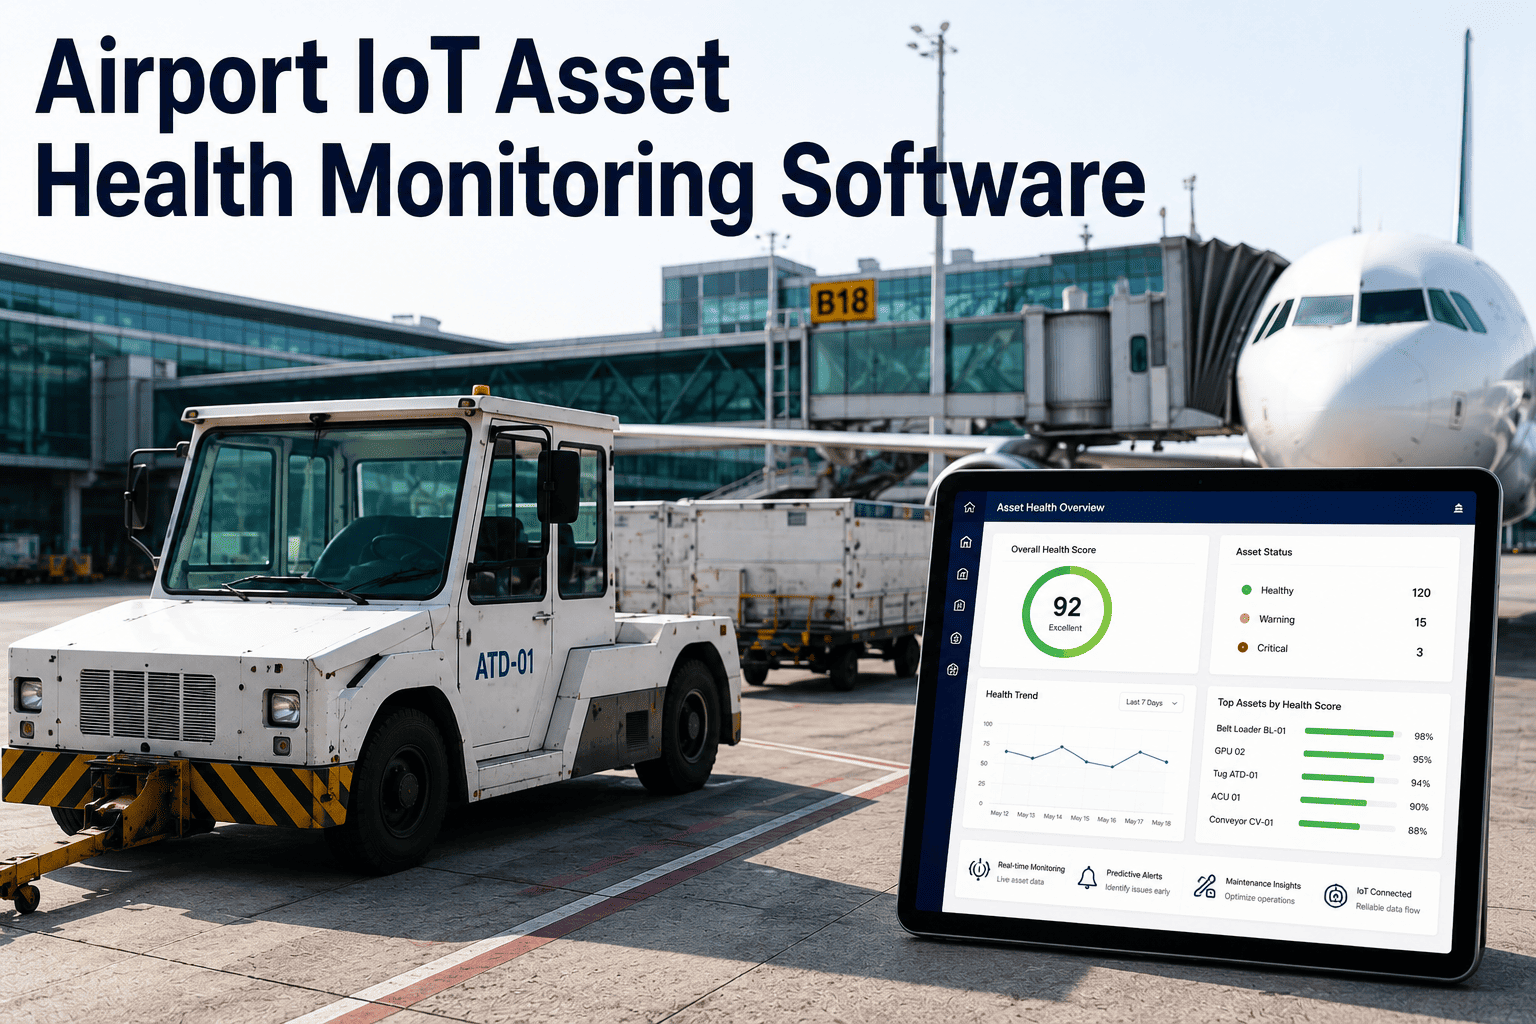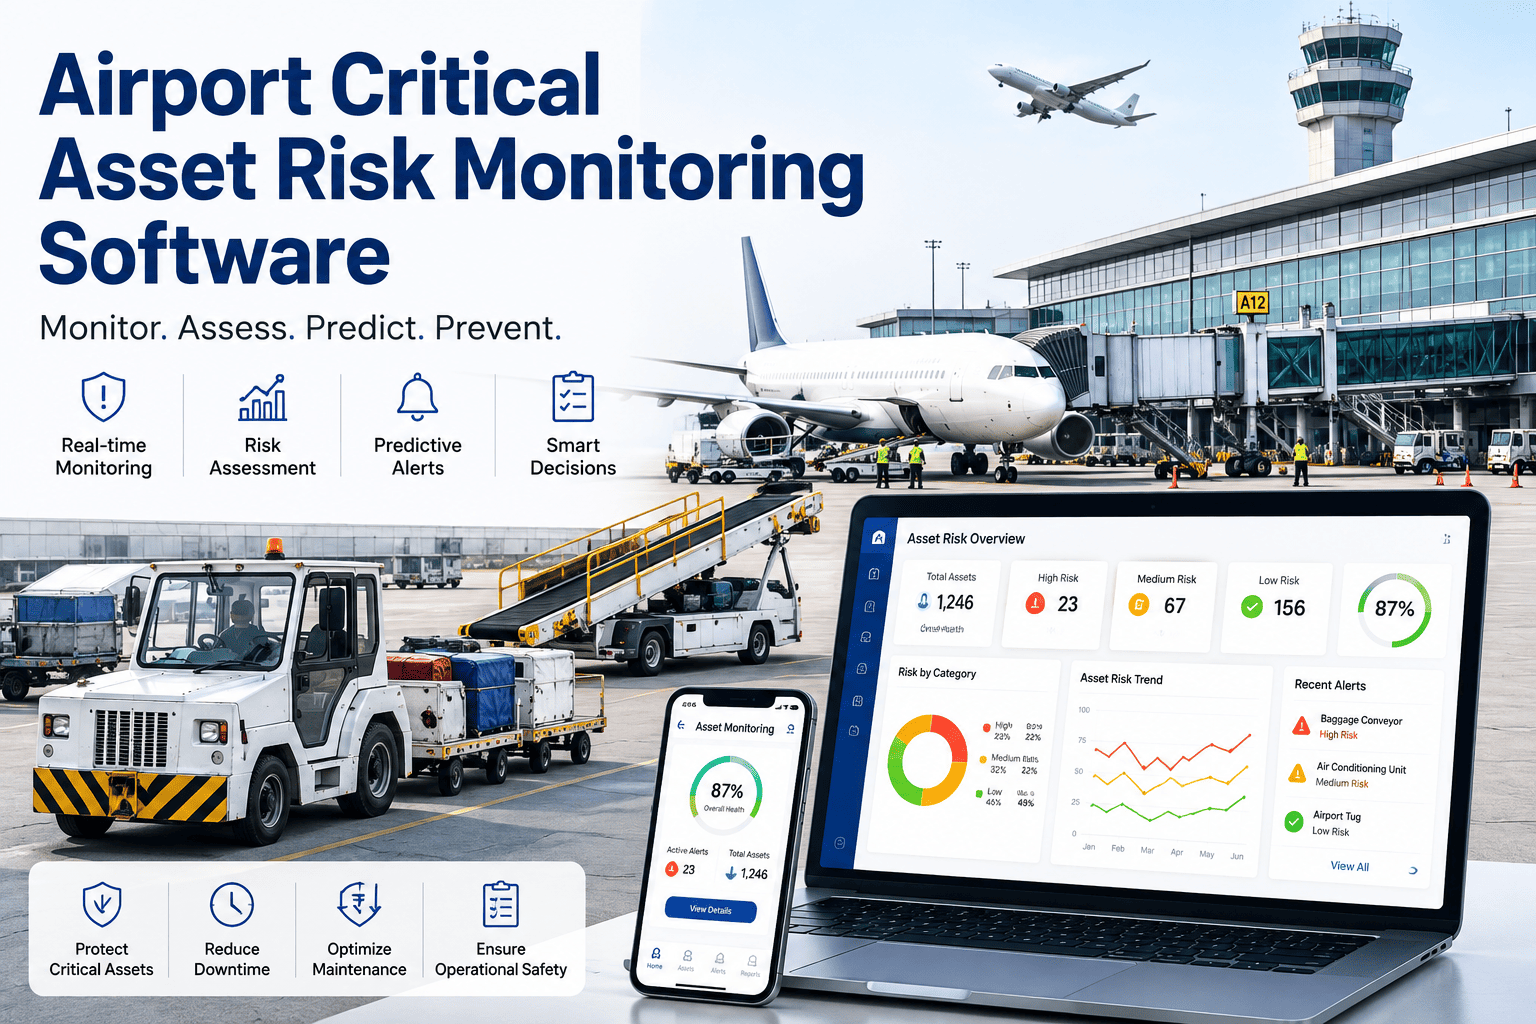
An airport doesn't fail all at once — a jet bridge starts drawing more hydraulic pressure than it should, a baggage conveyor motor runs a few degrees warmer each shift, an HVAC compressor draws current in a pattern nobody happens to be watching. Every one of those changes is a warning sign, but only if something is scoring it against what "normal" actually looks like for that specific asset. AI airport asset health scoring turns thousands of scattered readings into one number per asset that tells maintenance teams exactly what needs attention today, this week, and this quarter, and iFactory's support team can walk through how that scoring model applies to your terminal's own equipment mix.
Every Piece of Airport Equipment Has a Health Score. Most Airports Just Aren't Reading It Yet.
AI airport asset health scoring converts live condition data, maintenance history, and risk models into a single, continuously updated score for every airside, terminal, and ground support asset — so maintenance teams know exactly which equipment needs attention before it causes an operational disruption.
What Actually Feeds an Airport Asset Health Score
A health score is only as trustworthy as the data underneath it, and airports have more of that data available than most maintenance teams currently put to work. The strongest scoring models blend five distinct data sources, and an airport doesn't need all five in place on day one to start seeing value — but the more sources feeding the model, the sharper the score becomes over time.
Live IoT Sensor Streams
Vibration, temperature, current draw, and pressure readings from jet bridges, conveyors, HVAC units, and ground support equipment, captured continuously rather than during periodic rounds.
Maintenance History
Every past repair, part replacement, and inspection finding for that specific asset, giving the model a baseline of how this unit has actually degraded before, not a generic equipment profile.
Inspection and Walkthrough Logs
Technician notes and manual findings that don't show up in sensor data — corrosion, loose fittings, unusual noise — folded into the score alongside the automated readings.
OEM Specifications and Failure Libraries
Manufacturer tolerance ranges and known failure signatures for the equipment category, giving the model a starting point before enough plant-specific history has accumulated.
Usage and Environmental Data
Cycle counts, load patterns, ambient temperature, and seasonal demand swings, since the same asset wears differently during peak summer travel than during a quiet weekday in March.
From Raw Signal to a Score Maintenance Can Act On
The path from a sensor reading to a usable score has to happen fast enough to matter, and it has to end somewhere a technician actually looks. This is the sequence that turns condition data into a scheduled action rather than a number that sits unused in a report.
Ingest
Sensor, CMMS, and inspection data streams into one platform in real time, with noise and calibration drift filtered out automatically.
Normalize
Readings are converted into a consistent baseline for that specific asset, so a slightly warmer bearing on an old unit isn't scored the same as one on a new unit.
Score
Machine learning models trained on aviation failure libraries assign a 0-100 health score and classify which failure mode is developing.
Classify Risk
The score is placed into a risk band with a predicted failure window, so severity and urgency are both visible at a glance.
Act
A work order, parts reservation, or technician assignment is generated automatically once a score crosses a configured threshold.
Reading the Score: What the Numbers Actually Mean
A single number is only useful if everyone on the maintenance team interprets it the same way. iFactory's scoring model maps every asset onto a consistent 0-100 band, so a director reviewing the whole terminal and a technician looking at one jet bridge are always speaking the same language.
Healthy: routine monitoring, no action needed beyond standard checks
Watch: early degradation detected, worth flagging for the next planning cycle
At risk: schedule service within the predicted failure window
Critical: intervention needed immediately to avoid operational impact
Health Scoring Across Every Category of Airport Equipment
| Asset Category | Typical Score Focus | Downtime Reduction | Key Parameters Tracked |
|---|---|---|---|
| Airside Equipment | Jet bridges, baggage loaders, de-icing rigs | Reduced up to 40% | Hydraulic pressure, motor current, leveling drift |
| Terminal Systems | HVAC, elevators, escalators, electrical panels | Reduced 25-45% | Thermal drift, vibration, power quality |
| Baggage Handling | Conveyors, sortation systems, scanners | Reduced 30-50% | Belt tension, motor temperature, misalignment |
| Ground Support Equipment | Tugs, GPUs, pushback tractors, ground power | Reduced up to 60% | Battery health, engine fault codes, brake wear |
See Your Own Equipment Mapped to a Live Health Score
iFactory connects to the sensors and CMMS you already have and scores every critical asset within weeks — no airside shutdowns, no rip-and-replace of existing systems.
A Composite Scenario: Catching a Jet Bridge Failure Three Weeks Out
A mid-size international terminal had a recurring problem with one jet bridge's hydraulic leveling system, averaging one unplanned service call every four to five months, each one holding up gate turnaround by 30 to 45 minutes during the fix. The airport connected pressure and current sensors to the bridge's hydraulic pump and folded the readings into an asset health score built on the unit's own maintenance history and manufacturer tolerance ranges.
The score began drifting from 91 to the low 60s over an eleven-day stretch, crossing into the "at risk" band and triggering a predicted failure window of 14 to 22 days. Maintenance ordered the replacement seal kit that same day and scheduled the swap for an overnight maintenance window before the next peak travel period. The repair took under two hours, with zero gate delays and zero passenger impact.
The same scoring approach was then extended to the terminal's remaining eleven jet bridges over the following quarter, using the original model as a template rather than building each asset's scoring logic from scratch.
Manual Walkthroughs Versus Continuous AI Scoring
Is Your Airport Ready to Start Scoring Asset Health
You can name the equipment causing the most delays or callouts
If operations and maintenance already agree on the repeat offenders — a specific jet bridge, a baggage line, an HVAC unit — that list is the ideal starting scope for a first scoring rollout.
Some sensor or CMMS data already exists for those assets
Existing vibration, current, or maintenance-log data speeds deployment considerably, though a score can still be built starting from new instrumentation alone.
Your team is willing to act on a score before a failure happens
A health score only creates value if maintenance schedules work off a declining number instead of waiting to confirm the equipment actually breaks.
You want one view across airside, terminal, and ground equipment
Airports that manage jet bridges, HVAC, and GSE through separate systems benefit most from a single scoring layer that ranks risk across all of them together.
Frequently Asked Questions
How is an asset health score different from a maintenance dashboard?
A dashboard shows raw sensor readings and expects a person to notice when something looks off, while a health score runs a model against that same data continuously and outputs one number representing overall condition. It removes the guesswork of interpreting dozens of separate readings and gives every asset a directly comparable value. Visit support to see how the scoring logic applies to your specific equipment mix.
Does the score work without years of historical failure data?
Yes — the model starts from manufacturer specifications and live sensor trends to produce a useful score from the first weeks of connection, then sharpens its accuracy as plant-specific history builds up over time. Most airports see their scoring accuracy noticeably improve within the first full quarter of use, without needing to wait for a slow historical data build-up first.
Which airport assets benefit most from health scoring first?
Jet bridges, baggage conveyors, terminal HVAC, and ground support equipment typically deliver the fastest return, since these categories combine high failure frequency with high passenger and operational impact when they go down unexpectedly. Most deployments start with the equipment already causing repeat callouts, then expand from there. Book a demo to review which assets make sense for your first phase.
How does a declining score turn into an actual work order?
Once a score crosses a configured risk threshold, the platform can automatically generate a work order, reserve the required parts, and flag the recommended service window directly inside your existing CMMS. This closes the gap between a prediction sitting in a report and a technician actually being dispatched, which is where most manual scoring approaches break down.
How long does it take to get scores running across a full terminal?
A focused first phase covering an airport's highest-impact assets typically goes live within weeks once sensors are connected, with a full-terminal rollout following in phases as the model proves out on the initial equipment. Contact support for help scoping a realistic timeline for your facility.
Stop Waiting for Equipment to Tell You It Failed
iFactory scores every critical airport asset in real time, turning condition data, maintenance history, and risk models into a single number your team can act on before a failure ever reaches the gate.