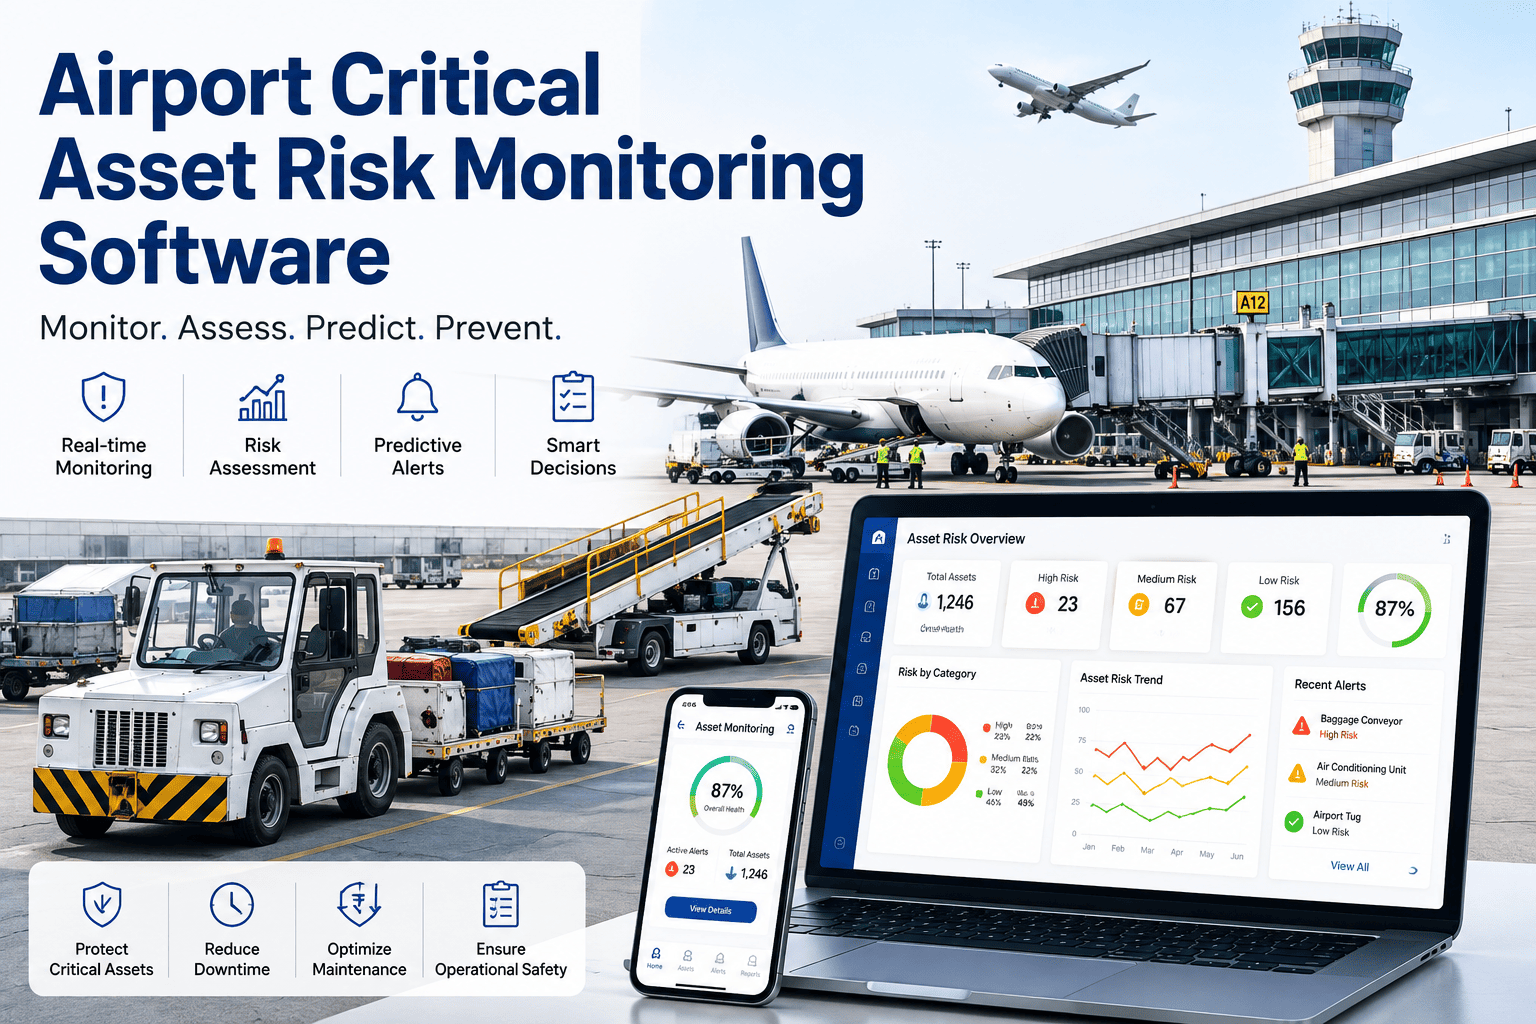
Every airport runs on a list of assets that simply cannot fail without consequence: jet bridges, baggage handling lines, backup generators, fuel farm pumps, HVAC chiller plants, and runway lighting circuits all sit on that list, yet most facilities teams still track their condition across a mix of spreadsheets, individual work orders, and whatever a technician happened to notice on their last walk-through. That patchwork approach works fine until two or three assets start degrading at once during a peak travel period, and suddenly nobody can say with confidence which one poses the biggest risk right now. A critical asset risk monitoring platform replaces that guesswork with a single, continuously updated risk score for every asset on the list, built from live condition data, failure probability, and maintenance history rather than whoever remembers to flag a problem first. Airport operations and facilities teams evaluating what that looks like across their own critical asset list can start by reaching out to iFactory support.
You Manage Dozens of Assets That Can't Fail. Do You Actually Know Which One Is Closest To Failing Right Now?
iFactory scores every critical airport asset continuously against live condition data, failure probability, and maintenance history, then automatically escalates the ones drifting toward failure so your team always knows exactly where to look first.
That patchwork approach works fine while the list of assets is short and the people watching it stay in their roles year after year, but it works against the airport the moment the list grows, the team turns over, or two assets start slipping toward failure in the same week during a peak travel period.
Why Spreadsheets and Tribal Knowledge Stop Working at Airport Scale
Most facilities teams didn't choose a spreadsheet-based risk register on purpose. It's usually the tool that was available when the list of critical assets was still short enough to track by memory, and it never quite got replaced as the terminal expanded, more equipment came online, and more people rotated through the maintenance team.
Risk Lives in People's Heads
The technician who knows Generator 1 has been running rough for months might be the only record of that risk, and that knowledge leaves the moment they change shifts, take vacation, or move to a different role entirely.
No Way to Compare Risk Across Categories
A spreadsheet can track a jet bridge's inspection dates and a chiller's alarm history separately, but it can't tell you which of the two actually poses more risk to operations this week.
Updates Happen on Someone's Schedule
A manually maintained risk register is only as current as the last person who remembered to update it, which means the picture is usually days or weeks out of date.
Escalation Depends on Someone Noticing
Without an automated trigger, a rising risk score sits unnoticed in a spreadsheet cell until someone happens to open the file and scroll to the right row.
What Actually Feeds a Critical Asset Risk Score
A risk score is only as good as what goes into it, and a credible model draws from more than a single alarm feed. Four categories of input combine to produce a score that reflects both how an asset is behaving right now and how much that behavior actually matters to airport operations, rather than treating every reading as equally urgent regardless of what's actually at stake.
Live Sensor and Alarm Readings
Vibration, temperature, pressure, current draw, and existing BMS or CMMS alarm history feed the model with a real-time picture of how each asset is currently performing.
Degradation and Failure Modeling
Physics-based degradation curves combined with the asset's own failure history estimate how likely a failure is within a given window, not just whether a reading looks abnormal today.
Work Order and Service Record Trends
Repeat repairs, deferred work orders, and time since last major service all raise or lower an asset's baseline risk independent of what the sensors show today.
Redundancy and Impact Weighting
An asset with no backup and direct passenger impact is weighted differently than one with full redundancy, so the score reflects consequence, not just condition.
What Changes Once Every Asset Has a Shared Risk Score
A single, continuously updated score does more than just flag the next work order. It changes how facilities, operations, and finance teams talk about risk in the first place, replacing separate department-level impressions with one shared reference point everyone can work from.
One Picture Across Departments
Facilities, operations, and safety teams stop working from separate impressions of which assets are risky and start referencing the same live score.
Capital Planning Backed by Data
Replacement and major overhaul budgets can be prioritized against actual risk trends instead of whichever asset generated the loudest recent complaint.
A Documented Record for Regulators
A continuous risk history gives airport safety and compliance teams a documented trail showing how a critical asset was monitored and managed over time.
Less Dependence on Any One Person
Risk knowledge lives in the platform instead of in one technician's memory, so a shift change or a retirement no longer means losing institutional knowledge about an asset's history.
How a Risk Score Escalates Into Action
A number on a dashboard doesn't protect an airport by itself. What matters is what happens automatically once that number crosses a threshold, and a well-built escalation ladder removes the need for someone to be watching the dashboard at the exact moment a risk score climbs, so nothing depends on a specific person catching it at the right time.
Stop Finding Out Which Asset Was Highest Risk After It Already Failed
iFactory scores every critical asset on your airport continuously and escalates the ones that need attention automatically, before a failure forces the priority call for you instead of the other way around.
Critical Asset Categories a Risk Monitoring Program Should Cover
| Asset Category | Primary Risk Signals | Example Escalation Trigger |
|---|---|---|
| Jet Bridges | Drive motor current, wheel alignment sensors, hydraulic pressure | Repeated stalls during extension cycle |
| Baggage Handling Systems | Belt tension, motor temperature, jam frequency | Rising jam rate on a single conveyor segment |
| HVAC Chiller Plants | Condenser approach temperature, refrigerant pressure, compressor amps | Approach temperature drifting upward over several days |
| Backup Generators | Battery health, fuel system pressure, load test results | Failed or delayed automatic start during a test cycle |
| Fuel Farm and Hydrant Systems | Pump vibration, flow rate, filtration differential pressure | Flow rate falling below the pump's rated curve |
| Runway and Taxiway Lighting Circuits | Circuit resistance, transformer load, fixture failure rate | Resistance trend approaching the circuit's rated limit |
Risk Register, Alarm-Based Monitoring, or Automated Risk Scoring
Most airports already have some version of asset tracking in place, whether that's a spreadsheet register, alarms built into the BMS or CMMS, or nothing formal at all beyond technician memory. Seeing the three approaches side by side makes it clear where each one runs out of runway once the number of tracked assets and the pace of change outgrow what a manual process can realistically keep up with.
Manual Risk Register
Relies on someone remembering to update a spreadsheet, offers no automatic escalation, and can't meaningfully compare risk across different asset categories.
Alarm-Based Monitoring
Catches problems only after a fixed threshold is crossed on an individual asset, with no way to weigh operational criticality or combine it with maintenance history.
Automated Risk Scoring
Continuously combines condition data, failure probability, maintenance history, and criticality into one score per asset, with automatic escalation built into the workflow.
From Raw Data to an Escalated Work Order
Continuous Data Ingestion
Sensor readings, BMS and CMMS alarm history, and existing work order records stream in from every critical asset on the tracked list.
Composite Risk Scoring
The model combines condition, failure probability, maintenance history, and operational criticality into a single 0-100 score updated continuously for every asset.
Trend Tracking Over Time
The system tracks each asset's score trajectory, distinguishing a slow, manageable drift from a sharp spike that needs faster attention.
Tiered Escalation
As a score crosses a threshold, the asset moves through the escalation ladder automatically, from a quiet watch flag up to a priority notification.
Automated Work Order Creation
Once an asset reaches the critical band, a prioritized work order is created directly in the CMMS with the relevant history and recommended action attached.
A Composite Scenario: The Fuel Pump That Almost Slipped Through
A regional airport's fuel farm ran four hydrant pumps feeding the apron, with no formal risk tracking beyond each pump's individual maintenance log. One pump had been the subject of three separate repair visits over eight months, but because each repair was logged and closed individually, nothing connected the pattern into a single picture of rising risk.
After the airport connected pump vibration, flow rate, and the full repair history into a critical asset risk monitoring platform, the pump's composite score climbed into the elevated band within days of deployment, driven by the combination of a worsening flow trend and its repeat-repair history. The maintenance team pulled the pump for a planned rebuild during a low-traffic window, avoiding what the vibration trend suggested was an approaching seal failure that would have taken the pump offline during aircraft turnaround operations. The other three hydrant pumps on the same apron were brought into the same monitoring scope immediately afterward, so a similar pattern on any of them would surface with the same speed going forward.
Common Mistakes Airports Make With Critical Asset Risk Tracking
Tracking Assets in Isolation
Logging each repair or alarm separately hides the pattern that a combined view would catch immediately, the way the fuel pump's three individual repairs did.
Treating Every Asset the Same Weight
A redundant, low-impact asset and a single point of failure shouldn't score the same way for the same condition reading, but many manual systems don't account for that difference and end up treating a minor issue on a critical asset the same as a major one on a backup unit.
Relying on Periodic Manual Review
A monthly or quarterly risk review misses anything that develops faster than the review cycle, which describes most mechanical and electrical failure modes.
No Automatic Path to a Work Order
A risk score that doesn't translate into a scheduled action still leaves the team relying on someone to manually notice and act on it.
Is Your Airport Ready for Automated Risk Monitoring
You can name your critical asset categories
If facilities and operations already agree on which asset types cannot fail without major consequence, that list is the right starting scope.
Some condition and maintenance data already exists
Existing BMS alarms, CMMS work orders, and sensor feeds accelerate deployment significantly, even if that data currently lives in separate systems.
Your CMMS can accept automated triggers
The escalation ladder only closes the loop if a critical score can create or flag a work order directly instead of requiring manual translation.
Leadership wants one shared view of risk
A risk monitoring program pays off fastest when facilities, operations, and safety teams are working from the same live picture instead of separate spreadsheets.
Frequently Asked Questions
How is a risk score different from just watching individual alarms?
An individual alarm tells you one reading crossed a threshold on one asset, while a risk score combines condition data, failure probability, maintenance history, and operational criticality into a single number that reflects the full picture. That composite view is what lets a team compare a jet bridge against a fuel pump against a generator and know which one actually deserves attention first, something a list of disconnected alarms simply can't do on its own. Teams can see this comparison applied to their own asset list by contacting iFactory support.
Do we need to replace our existing BMS, CMMS, or sensors to start?
No, the risk model is built to pull from the systems you already have, including existing BMS alarms, CMMS work order history, and any sensor feeds already in place across your terminal and airside infrastructure. Most deployments start by connecting existing data sources for the highest-priority asset categories, then add targeted instrumentation only where a specific asset lacks the data needed for an accurate score.
How many asset categories should a first deployment cover?
Most airports start with three to six of the categories that carry the highest operational consequence, such as jet bridges, baggage systems, and backup power, rather than attempting to score every asset on the property at once. A focused starting scope proves the model's accuracy and the escalation workflow before expanding to additional categories.
Can the escalation workflow route different risk tiers to different people?
Yes, escalation rules can route a watch-level flag to a general maintenance queue while sending elevated and critical scores directly to the responsible lead or creating a prioritized CMMS work order automatically. Book a demo to see how escalation routing is typically configured for a specific airport's team structure.
How quickly does a risk score reflect a genuinely worsening asset?
Because the score updates continuously against live data rather than on a periodic review cycle, a genuinely worsening trend typically moves an asset into a higher risk band within days, as it did with the fuel pump in the composite scenario above, rather than sitting unnoticed until the next scheduled inspection or review meeting weeks or months later.
Know Which Critical Asset Needs Attention Before It Fails
iFactory turns condition data, failure probability, and maintenance history into one continuously updated risk score per asset, with automated escalation built directly into your CMMS workflow so nothing critical waits on a spreadsheet update or a lucky walk-through.