A jet bridge motor and a runway edge light circuit can both sit on the same weekly preventive maintenance schedule, yet a failure in one delays a single gate while a failure in the other can ground operations across an entire runway. Treating every asset on a fixed calendar — service it every thirty days regardless of what's actually happening inside it — spends the same attention on a low-consequence conveyor roller as it does on a fire suppression valve. Airports that move to risk-based planning stop asking "when was this last serviced" and start asking "how likely is this to fail, and how bad would it be if it did," which reshapes the entire maintenance queue around what actually matters most to safety and operations. Getting that scoring right is where most teams get stuck, and it's exactly what a properly configured risk model is built to solve.
Airport Maintenance · Risk-Based Prioritization
Stop Servicing Every Asset on the Same Fixed Calendar
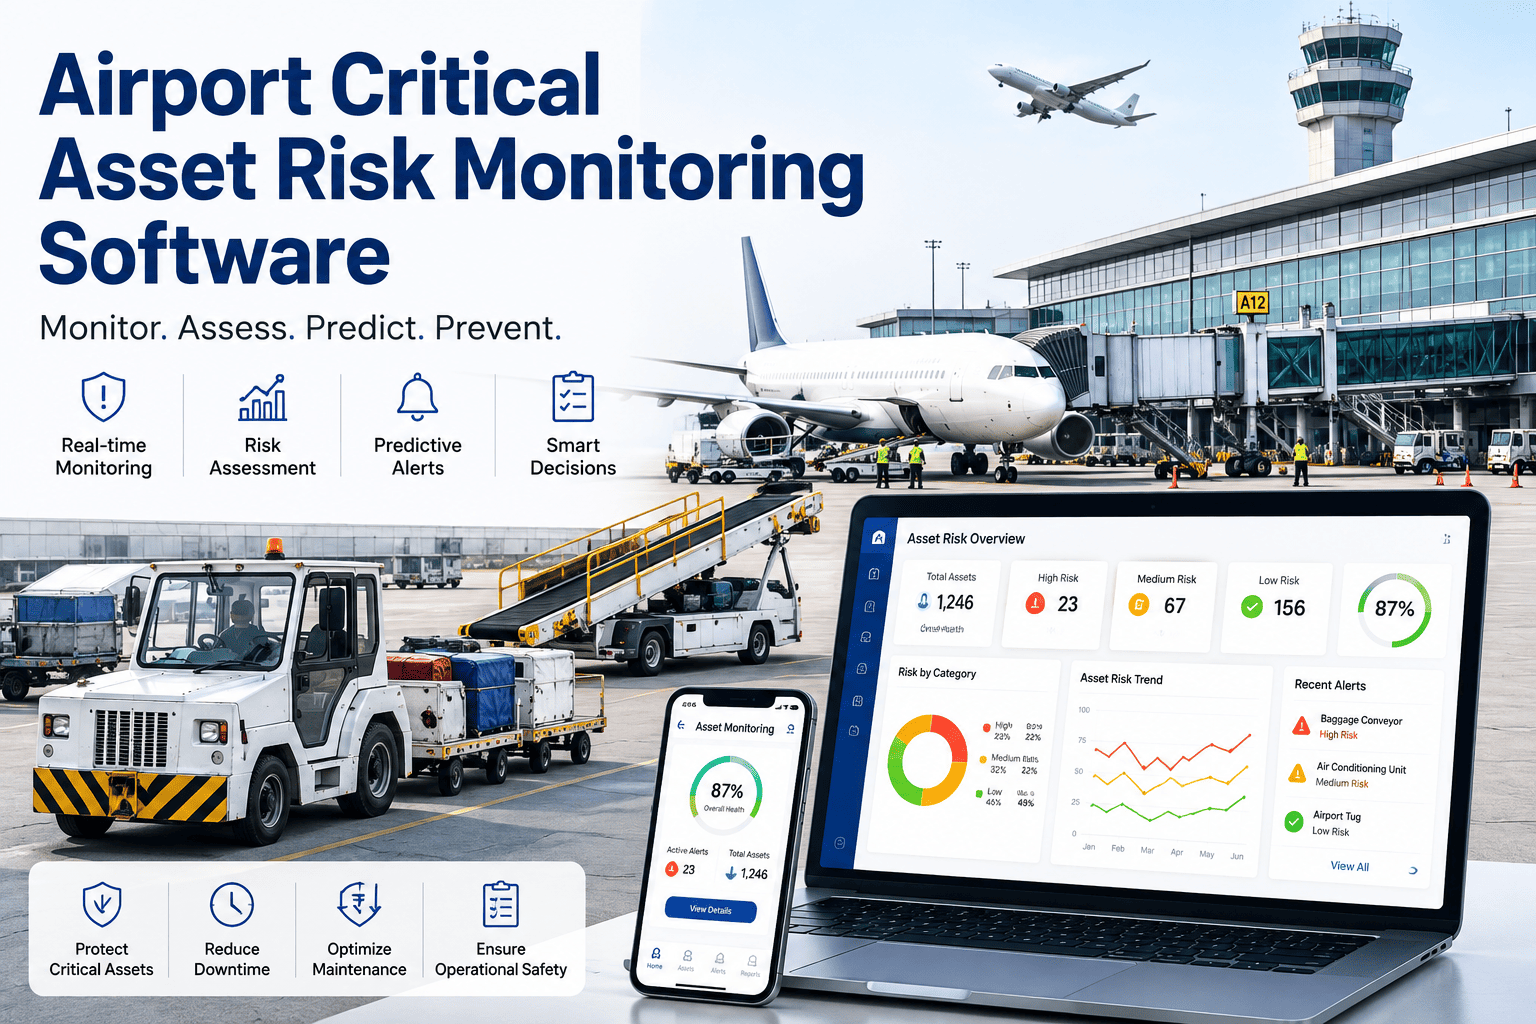
iFactory ranks every airport asset by real failure risk — probability, safety impact, operational criticality, and current condition — so the maintenance queue puts a fire suppression valve ahead of a low-risk conveyor roller, instead of treating both the same because they're both due this month.
Where the Old Models Break Down
Three Ways Airports Currently Prioritize Maintenance, and Why Each One Falls Short
Fixed Preventive Schedules
Servicing every asset on a set interval regardless of actual condition wastes technician hours on equipment that's running fine while a genuinely degrading unit waits for its turn on the calendar, sometimes failing before that date ever arrives.
Condition Monitoring Alone
Watching sensor data tells you an asset is degrading, but without weighing what that asset actually controls, a minor drift on a low-consequence unit can pull attention away from a smaller but far more dangerous issue on a safety-critical system.
Criticality Rankings That Never Update
A static list ranking assets as high, medium, or low criticality gets built once during commissioning and rarely revisited, so it stops reflecting how an asset's actual condition or failure history has changed years later.
How the Priority Is Actually Set
Plotting Every Asset by Probability and Consequence
Every asset lands on a grid the same way — how likely it is to fail against how much it would matter if it did. An asset with a low chance of failure but a severe consequence, like a fire suppression valve, still outranks a frequently failing but low-impact component like a baggage cart wheel.
Consequence of Failure
Medium Priority
High Priority
Critical — Act First
Low Priority
Medium Priority
High Priority
Low Priority
Low Priority
Medium Priority
Probability of Failure — Low to High
What Feeds the Score
Four Inputs Behind Every Risk Ranking
Safety Impact
Whether a failure could put passengers, staff, or aircraft at direct risk, which weighs heaviest in the score regardless of how rarely the asset actually fails.
Failure Probability
Drawn from asset age, condition trend data, and how often this specific unit or model has failed before across the fleet.
Operational Criticality
How much a failure would disrupt gate turnarounds, baggage flow, or terminal operations, and whether a backup system exists to absorb the impact.
Current Asset Condition
The latest inspection findings, vibration or thermal readings, and any open condition flags that indicate the asset is trending toward failure right now.
Choosing an Approach
Fixed PM vs. Condition-Based vs. Risk-Based Planning
| Aspect | Fixed PM | Condition-Based | Risk-Based |
| What triggers the work |
A calendar date |
A sensor reading crossing a threshold |
A calculated risk score |
| Accounts for consequence |
No |
Not directly |
Yes, built into the score |
| Reacts to changing condition |
No |
Yes |
Yes |
| Prevents over-servicing healthy assets |
No |
Partially |
Yes |
| Prioritizes safety-critical assets first |
Only if scheduled tightly |
No |
Yes, by design |
See Your Fleet Ranked by Risk
Run Your Asset List Through a Real Risk Score
Bring a cross-section of your assets — a few safety systems, a few high-traffic mechanical assets, a few low-consequence ones — and we'll walk through exactly how each one gets scored and where it lands in the queue.
How It Runs Day to Day
From Raw Data to a Reordered Maintenance Queue
1
Condition and History Data Feed In Continuously
Inspection findings, sensor trends, and failure history update each asset's inputs automatically instead of waiting for an annual review to refresh the record.
2
Each Asset's Risk Score Recalculates
Safety impact, probability, criticality, and current condition combine into a single score that moves as the underlying inputs change, not a number that's set once and left alone.
3
The Maintenance Queue Reorders Around the Score
Work orders for the highest-risk assets surface at the top of the planner's queue automatically, ahead of lower-risk work that happens to be due on the same date.
4
Rising-Risk Assets Get Flagged Before They're Due
An asset whose condition is trending downward can be pulled forward on the schedule even if its next fixed service date is still weeks away.
Where This Matters Most
Airport Assets Where Fixed Schedules Get the Priority Wrong
Fire Suppression and Life Safety Systems
Rarely fail, but a missed issue carries a consequence severe enough that these systems should always rank near the top of the queue regardless of how infrequently they act up.
Jet Bridges and Passenger Boarding Equipment
High operational criticality tied directly to gate turnaround times, where a failure cascades into delays that ripple across the day's schedule.
Runway and Taxiway Lighting Circuits
A single circuit fault can affect a run of lights at once, making both the probability of a cascading fault and the safety consequence worth weighing heavily.
Terminal HVAC and Chiller Plant
Lower safety impact than life safety systems, but high operational criticality during extreme weather, when a fixed schedule may not reflect the load the system is actually under.
Getting Started
Before You Move From Fixed PM to Risk-Based Planning
Group assets by consequence category first — life safety, operational, low impact — before worrying about probability scoring at all
Pull together whatever failure history and condition data already exists, even if it's incomplete, as a starting baseline for probability scoring
Agree with safety and operations stakeholders on how heavily each factor should be weighted before the first score is calculated
Pilot the model against one asset category, such as life safety systems, before rolling it out across the entire asset register
Set a review cadence for revisiting the weighting itself, since what counts as critical can shift as operations change
A Composite Scenario
A Terminal Where Every Asset Competed for the Same Monday
Before Risk-Based Planning
A terminal's maintenance team worked from a fixed monthly schedule where roughly forty assets came due in the same week, spanning everything from baggage cart wheels to fire suppression valves. With no way to distinguish urgency beyond the date on the calendar, technicians worked through the list roughly in the order it was printed, and a fire suppression inspection once slipped two days behind a batch of low-priority conveyor checks simply because it appeared further down the sheet.
After Risk-Based Planning
Each of those forty assets was scored on safety impact, probability, criticality, and current condition, and the queue reordered itself around the result. Life safety systems and jet bridges consistently surfaced first regardless of what date they happened to fall on, while lower-consequence assets like cart wheels shifted to whenever capacity allowed, without anyone having to manually decide the order by hand each week.
Common Questions
Airport Risk-Based Maintenance Planning — FAQ
Does risk-based planning replace preventive maintenance entirely?
No, it changes the order and timing of preventive work rather than eliminating it. Fixed intervals still apply where a manufacturer requires them for warranty or regulatory reasons, but everything else gets reordered around actual risk instead of a flat calendar. The result is fewer wasted visits to healthy assets and faster attention to the ones actually trending toward failure.
Our team can walk through how this applies to your specific asset mix.
How is the risk score actually calculated?
Each asset is scored on failure probability, using condition data and history, and on consequence, using safety impact and operational criticality, and the two are combined into a single ranking. The relative weight given to each factor is configurable, since a safety-driven airport may want consequence weighted more heavily than an operations team focused primarily on gate turnaround time.
What happens when an asset's condition changes suddenly?
The risk score recalculates as new condition data comes in, which means an asset that was ranked low risk last week can move up the queue immediately if an inspection or sensor reading flags a new issue. This is the main advantage over a fixed schedule, where an asset waits for its next scheduled date regardless of what's actually happening to it in the meantime.
Can we start with a partial or incomplete data set?
Yes, most airports start risk-based planning with whatever condition and failure history already exists, even if some assets only have basic age and criticality data available. The scoring improves in accuracy as more inspection and sensor data accumulates over time, but an incomplete data set is still a meaningful improvement over a purely fixed calendar.
Book a demo to see how scoring adapts as your data matures.
Who should be involved in setting the risk weighting?
Safety, maintenance planning, and operations leadership typically all have a stake in how heavily each factor is weighted, since a purely maintenance-driven weighting can undervalue passenger safety impact and a purely safety-driven weighting can undervalue operational disruption. Getting these groups to agree on the weighting up front avoids disputes later over why one asset outranked another.
Stop Treating Every Asset the Same
Rank Your Airport's Maintenance Queue by Actual Risk
iFactory scores every asset on failure probability, safety impact, operational criticality, and current condition, so the highest-risk work always surfaces first — not just whatever happens to be due on the calendar this week.