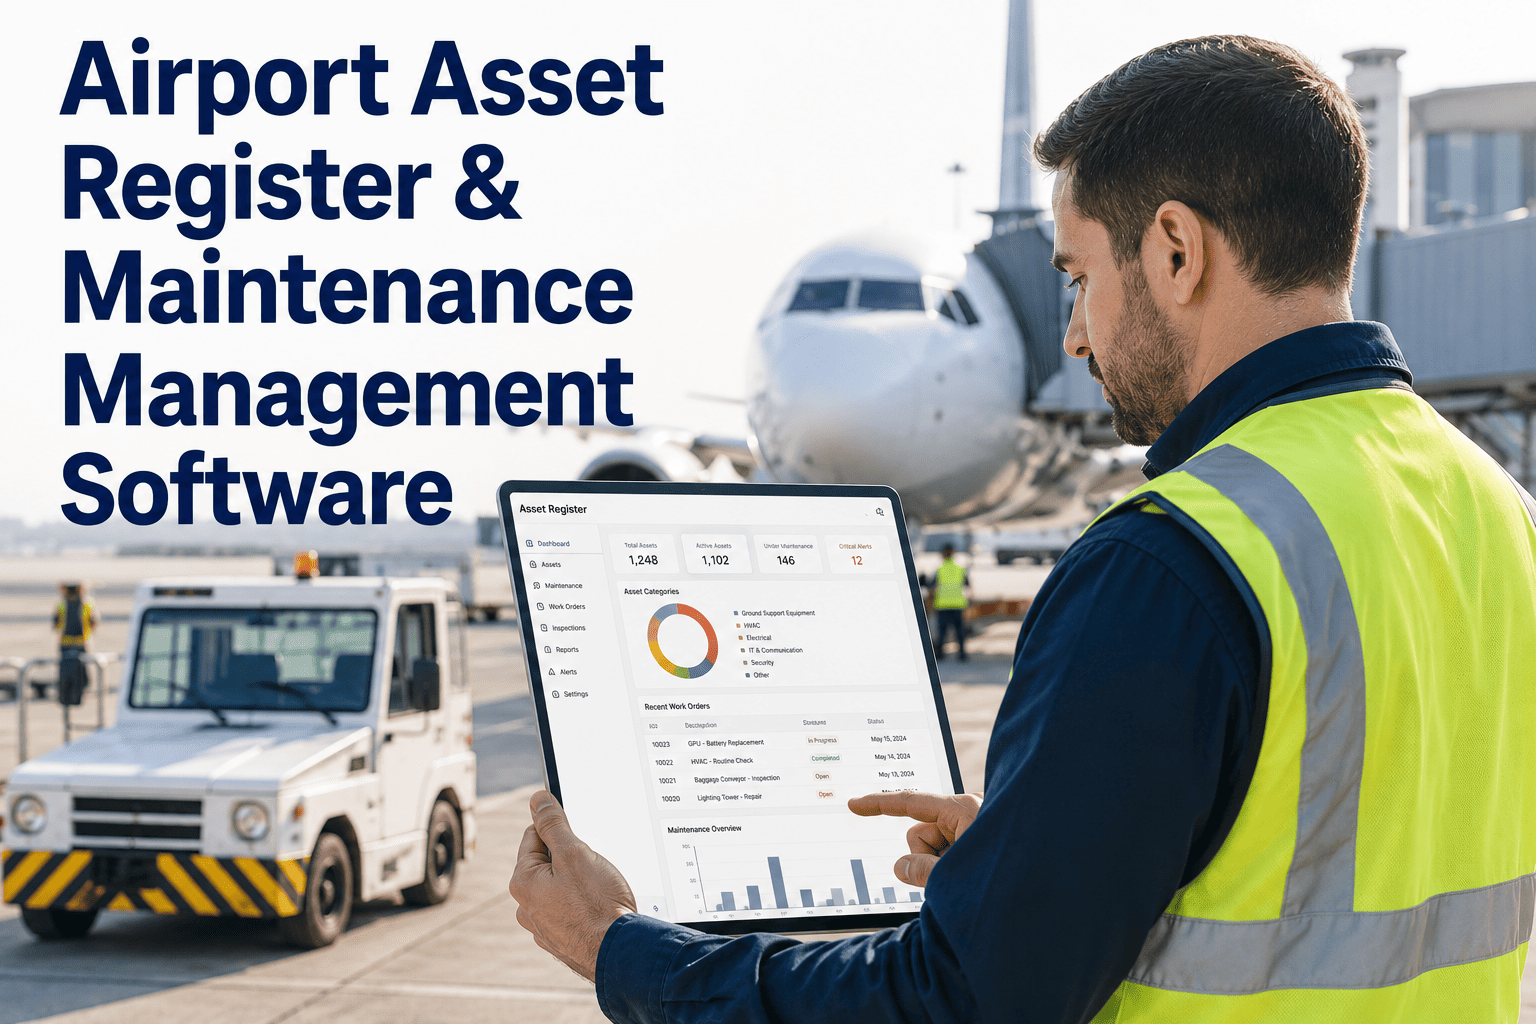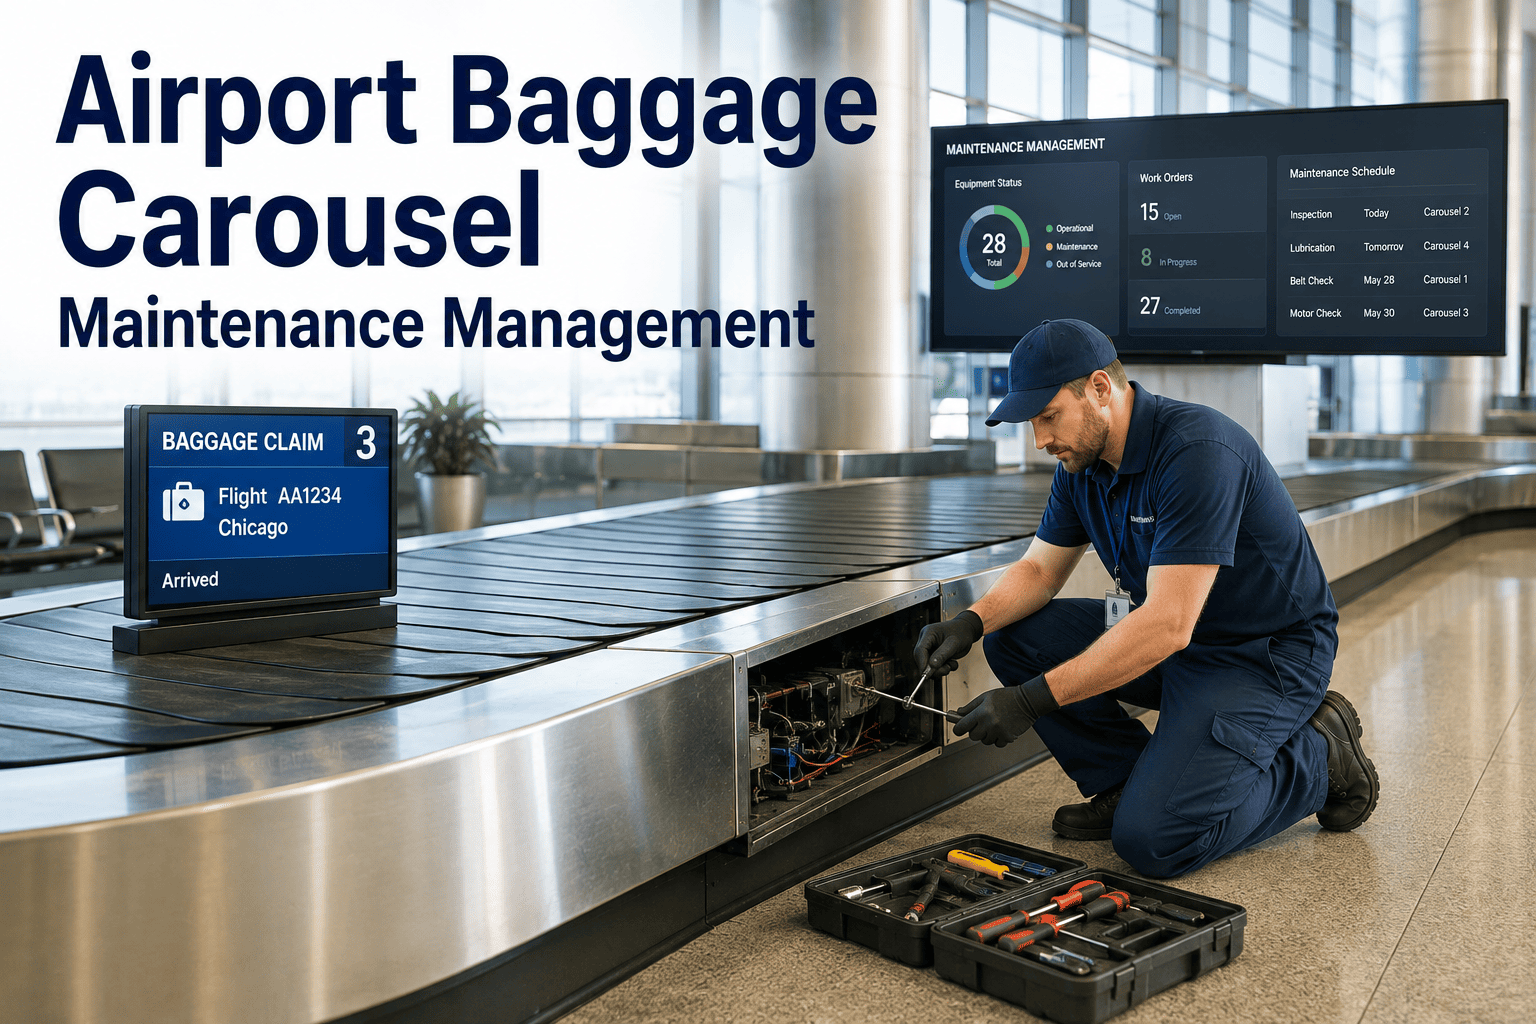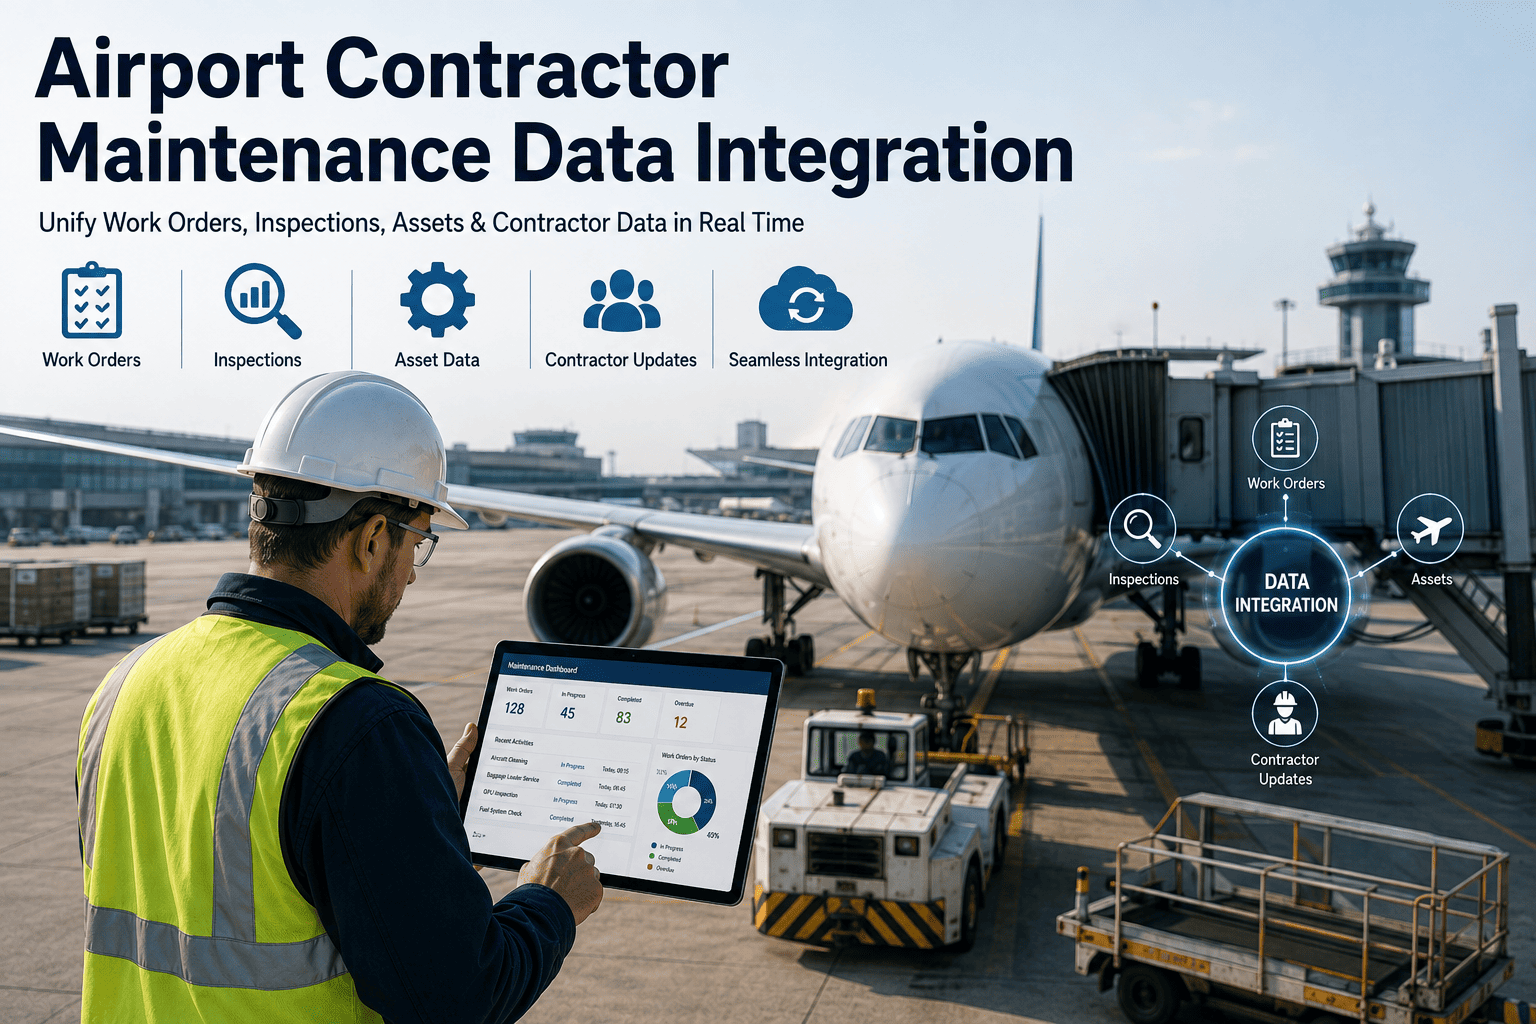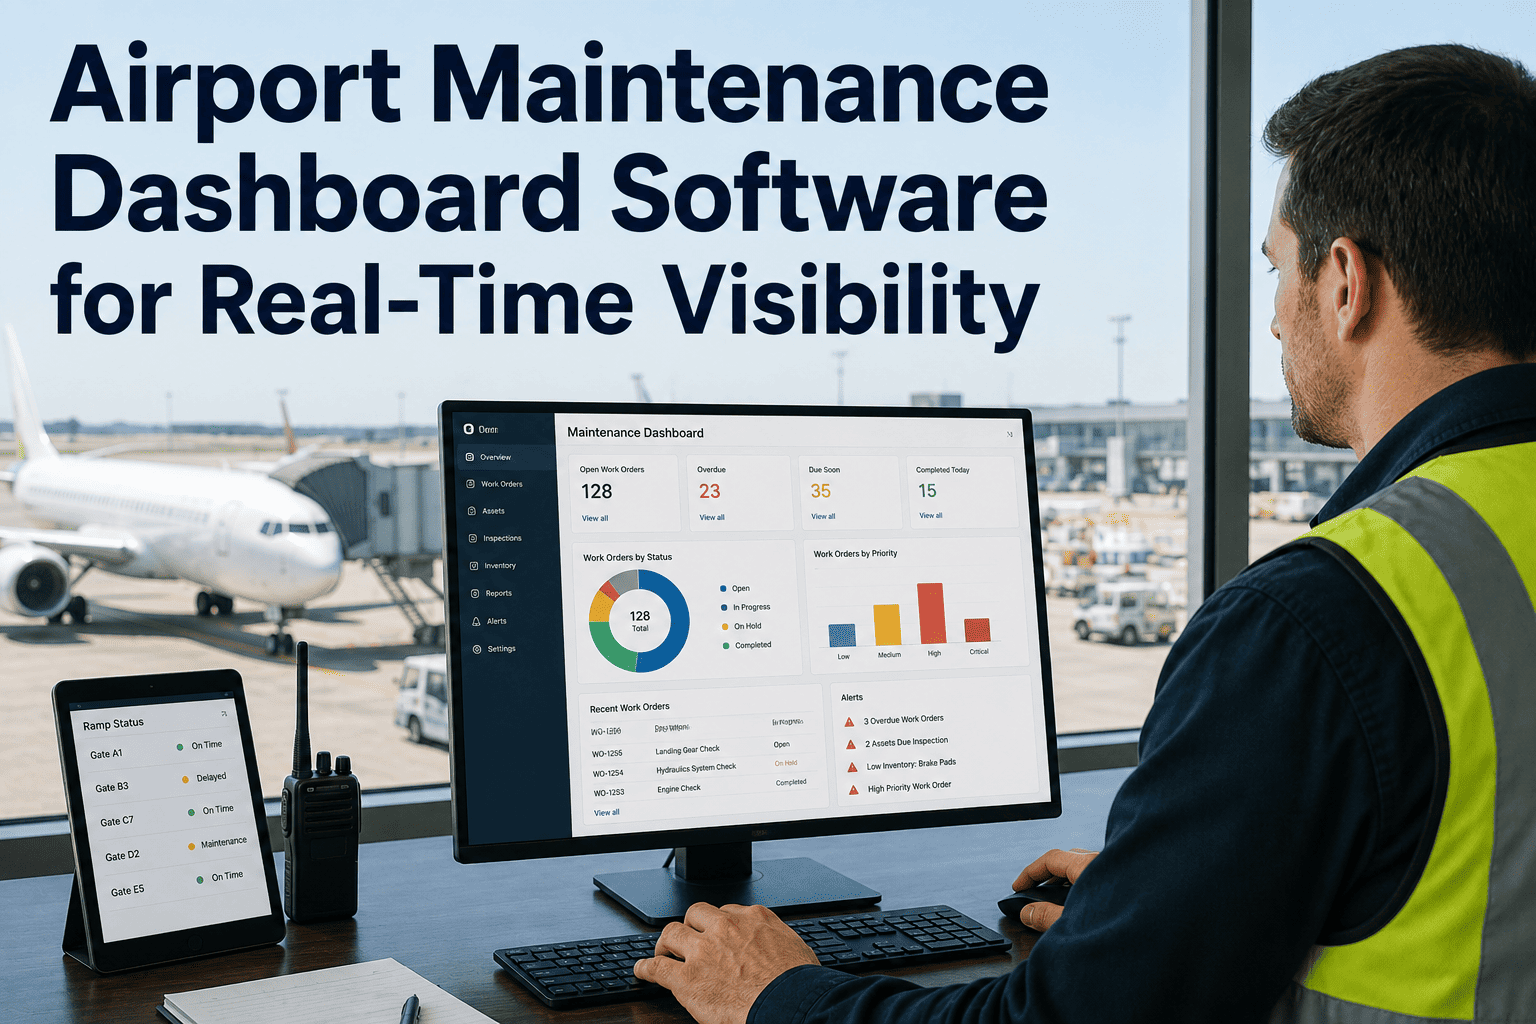
At most airports, the maintenance team logs a GSE fault in one system, the ramp coordinator tracks turnaround status in another, and the asset register lives in a spreadsheet nobody outside facilities ever opens. Flight ops data, ground handling schedules, and equipment health signals all move in parallel streams that rarely intersect, so a tug that failed inspection an hour ago can still get dispatched to a gate because nobody downstream ever saw the flag. Airlines and airport operators have invested heavily in individual systems for maintenance, assets, GSE, and turnaround coordination, and a 2023 Air Transport IT Insights survey found airport and airline IT spend reached an estimated $10.8 billion and $34.5 billion respectively that year, much of it going into systems that still don't talk to each other. The result is a floor full of good data trapped in separate rooms, and the only way to see the full operational picture is connecting those systems into one shared layer.
Your Maintenance, Asset, GSE, And Turnaround Systems Are Recording The Same Airport, In Different Languages
Unify airport and airline operational data across maintenance, asset, GSE, and turnaround workflows so every team is coordinating from the same live picture instead of four disconnected ones.
Five Systems, One Airport, Almost No Shared Picture
Every one of these systems is doing its individual job correctly. The problem shows up in the gaps between them, where a status change in one system has no way of reaching the teams working from the other four, so decisions get made on partial information even when the full picture technically exists somewhere on the network. Most airports and airlines didn't design it this way on purpose; each system was purchased separately, by a different department, at a different point in the operation's growth, and integration between them was treated as a nice-to-have rather than a requirement written into the procurement process. Years later, the organization is left running five sources of truth that each believe they're authoritative, with no shared layer above them reconciling the differences before those differences turn into a delay on the ramp.
Maintenance / CMMS
Tracks work orders, inspection history, and repair status for aircraft support equipment, but rarely exposes that status to the teams deciding which equipment gets dispatched next.
Asset Registry And Documentation
Holds equipment specifications, warranty terms, and lifecycle records, often in spreadsheets or a document store disconnected from the systems tracking day-to-day equipment condition.
GSE Telemetry And Fleet Status
Streams live location, fuel, and fault-code data from tugs, belt loaders, and ground power units, but that stream typically terminates at the fleet dashboard instead of reaching turnaround planning.
Turnaround / A-CDM Coordination
Manages milestone timing across catering, cleaning, fueling, and baggage teams, usually assuming that every resource assigned to the aircraft is actually available and airworthy.
Flight Ops And Schedule Data
Carries gate assignments, aircraft rotation, and schedule changes that ripple straight into equipment and staffing needs, often with no automated link back to maintenance or asset systems.
One Unified Operational View
A shared data layer that surfaces maintenance status, asset criticality, GSE readiness, and turnaround milestones to every stakeholder at the same time, from the same source of truth.
Every Minute Lost To A Data Gap Is A Minute Priced Like Any Other Delay
None of this shows up on a report labeled "data silo cost." It shows up as turnaround delay, ATC holding, and reactive maintenance spend, categories that already carry a well-documented price tag across the industry, which is exactly why closing the visibility gap between systems has a measurable financial floor under it. A five-minute delay during a morning peak bank already crosses several hundred dollars before anyone has made a single operational decision about how to recover it, and that cost rarely stays contained to the one flight it started on. It travels through crew connections, gate availability, and the next aircraft's rotation, which is exactly why airlines and airports that have invested in connecting their operational data consistently point to turnaround reliability, not just IT efficiency, as the primary return.
Three Ways Disconnected Data Quietly Compounds Every Delay
Data silos rarely cause a single dramatic failure. They cause a steady accumulation of small, avoidable delays that each look explainable in isolation, but trace back to the same root cause when you look across enough of them: a status change that existed somewhere on the network but never reached the person who needed it.
A GSE Fault Doesn't Reach The Gate Assignment
A pushback tractor flagged for a hydraulic fault in the maintenance system can still get assigned to a departure if the turnaround coordinator is working from a fleet list that was last refreshed at shift start, turning a known issue into a surprise delay at the gate.
Maintenance Backlogs Hide Behind Uptime Numbers
An asset registry showing an item as active tells you nothing about how many open work orders are stacked against it, so equipment can look healthy on a dashboard while quietly running on borrowed time toward its next failure.
Turnaround Delays Get Logged, Not Diagnosed
A-CDM systems record that a turnaround ran long and which milestone slipped, but without a link back to equipment and maintenance data, the same root cause can repeat for months before anyone connects the pattern.
| Data Source | What It Tracks | Where The Blind Spot Is | What A Unified Layer Adds |
|---|---|---|---|
| Maintenance / CMMS | Work orders, inspections, repair status | Status stays inside maintenance, not visible at dispatch | Live equipment status shown wherever assignment decisions happen |
| GSE Telemetry | Location, fuel, fault codes | Terminates at a fleet dashboard, not turnaround planning | Fault codes automatically cross-checked against dispatch requests |
| Asset Registry | Specs, warranty, lifecycle records | Disconnected from day-to-day condition data | Criticality scoring that blends age, history, and current condition |
| Turnaround / A-CDM | Milestone timing across ground teams | Assumes assigned resources are actually available | Milestone risk flagged the moment a required asset is unavailable |
| Flight Ops | Gate assignment, rotation, schedule changes | No automated link to maintenance or asset systems | Schedule changes automatically re-check equipment and staffing needs |
Stop Reconciling Five Systems By Hand Before Every Shift
iFactory connects maintenance, asset, GSE, and turnaround data into one operational layer, so equipment status, work orders, and turnaround milestones are visible to every stakeholder from the same live source instead of five separate logins.
What Integration Actually Looks Like In Practice
Integration doesn't mean replacing the CMMS, the asset registry, or the turnaround platform your teams already rely on. It means building a layer above them that ingests what each system already knows and makes it usable by everyone else, following a sequence that holds up under real airport operating conditions rather than a one-time data export.
Ingest From Existing Systems
Connect to the CMMS, asset registry, GSE telemetry, and turnaround platform through existing APIs and data feeds, without requiring teams to change the tools they already use daily.
Normalize The Data Model
Map equipment IDs, work order codes, and status definitions from every source system into one consistent schema, so a fault logged one way in maintenance matches the same asset referenced differently in dispatch.
Correlate Across Workflows
Cross-reference maintenance status, asset criticality, and GSE condition against live turnaround and flight ops data to surface conflicts before they reach the gate, not after.
Surface One Shared View
Give maintenance, ramp coordination, and airline operations teams a single operational picture built from the same underlying data, instead of five dashboards that each tell a partial story.
Trigger Coordinated Action
Route a flagged conflict, whether it's a failed GSE inspection or a delayed part, straight to the team that needs to act on it, closing the loop that used to depend on someone happening to notice.
None of these five steps require ripping out equipment or retraining ground crews on a new system. The technicians still log work orders in the CMMS they already know, and the turnaround team still works inside their existing coordination platform. What changes is what happens behind those familiar screens, where the data those systems generate finally gets reconciled into one model instead of sitting untouched until someone manually cross-checks it during an incident review.
A Backup Tug Reassigned Before The Delay Ever Started
A pushback tractor working the early bank fails a hydraulic pressure check at 5:40 a.m. and gets logged into the maintenance system with a hold flag while a technician orders the part. In a facility running five disconnected systems, that flag stays inside maintenance. At 6:15, the turnaround coordinator, working from a fleet list refreshed at shift start, assigns that same tractor to a 6:30 departure. The equipment shows up, the fault is discovered on the ramp, and the crew scrambles to locate a backup tug while the aircraft sits at the gate, the delay now compounding across every downstream connection tied to that flight.
With a unified operational layer in place, the hold flag logged in maintenance at 5:40 immediately updates the equipment's status everywhere it's referenced, including the dispatch view the turnaround coordinator is working from. The 6:30 assignment is automatically routed to a different tractor before the schedule is even finalized, and the technician's part order is visible to operations planning so they know exactly when the flagged unit returns to service. The delay that would have rippled through the morning bank never happens, not because anyone worked faster, but because the data that already existed reached the person who needed it in time to act on it.
| What Changes | Fragmented Systems | Unified Data Layer |
|---|---|---|
| Visibility | Each team sees only its own system | Every team works from the same live status |
| Root-cause diagnosis | Recurring failures go unnoticed across systems | Patterns surface once maintenance and turnaround data are linked |
| Turnaround coordination | Assumes assigned resources are available | Flags equipment conflicts before assignment is finalized |
| Reporting | Manually reconciled across departments | Generated automatically from one consistent data model |
| Response time | Depends on someone noticing the gap | Conflicts route automatically to the right team |
Five Questions That Reveal How Siloed Your Data Really Is
Most operations teams already sense where the gaps are, even without a formal audit. These five questions are a fast way to confirm it and identify which connection would deliver the most immediate value once addressed.
Does Maintenance Status Reach Dispatch?
Can the person assigning equipment to a turnaround see a live maintenance hold, or only what was true at the start of the shift?
Is Asset Criticality Actually Scored?
Does your asset registry rank equipment by how much a failure would cost operationally, or only by purchase date and warranty status?
Does GSE Telemetry Reach Turnaround Planning?
Do fault codes streaming from tugs and loaders ever reach the system deciding which unit gets dispatched next?
Can You Trace A Delay To Its Root Cause?
When a turnaround runs long, can your team trace it back to a specific asset and failure pattern, or only to a milestone timestamp?
Common Questions About Integrating Airport And Airline Operational Data
See Your Maintenance, Asset, GSE, And Turnaround Data In One View
iFactory unifies the systems your teams already rely on into a single operational layer, so equipment status and turnaround risk are visible before they become a delay, not after. Book a demo and see what a shared view looks like across your own fleet.