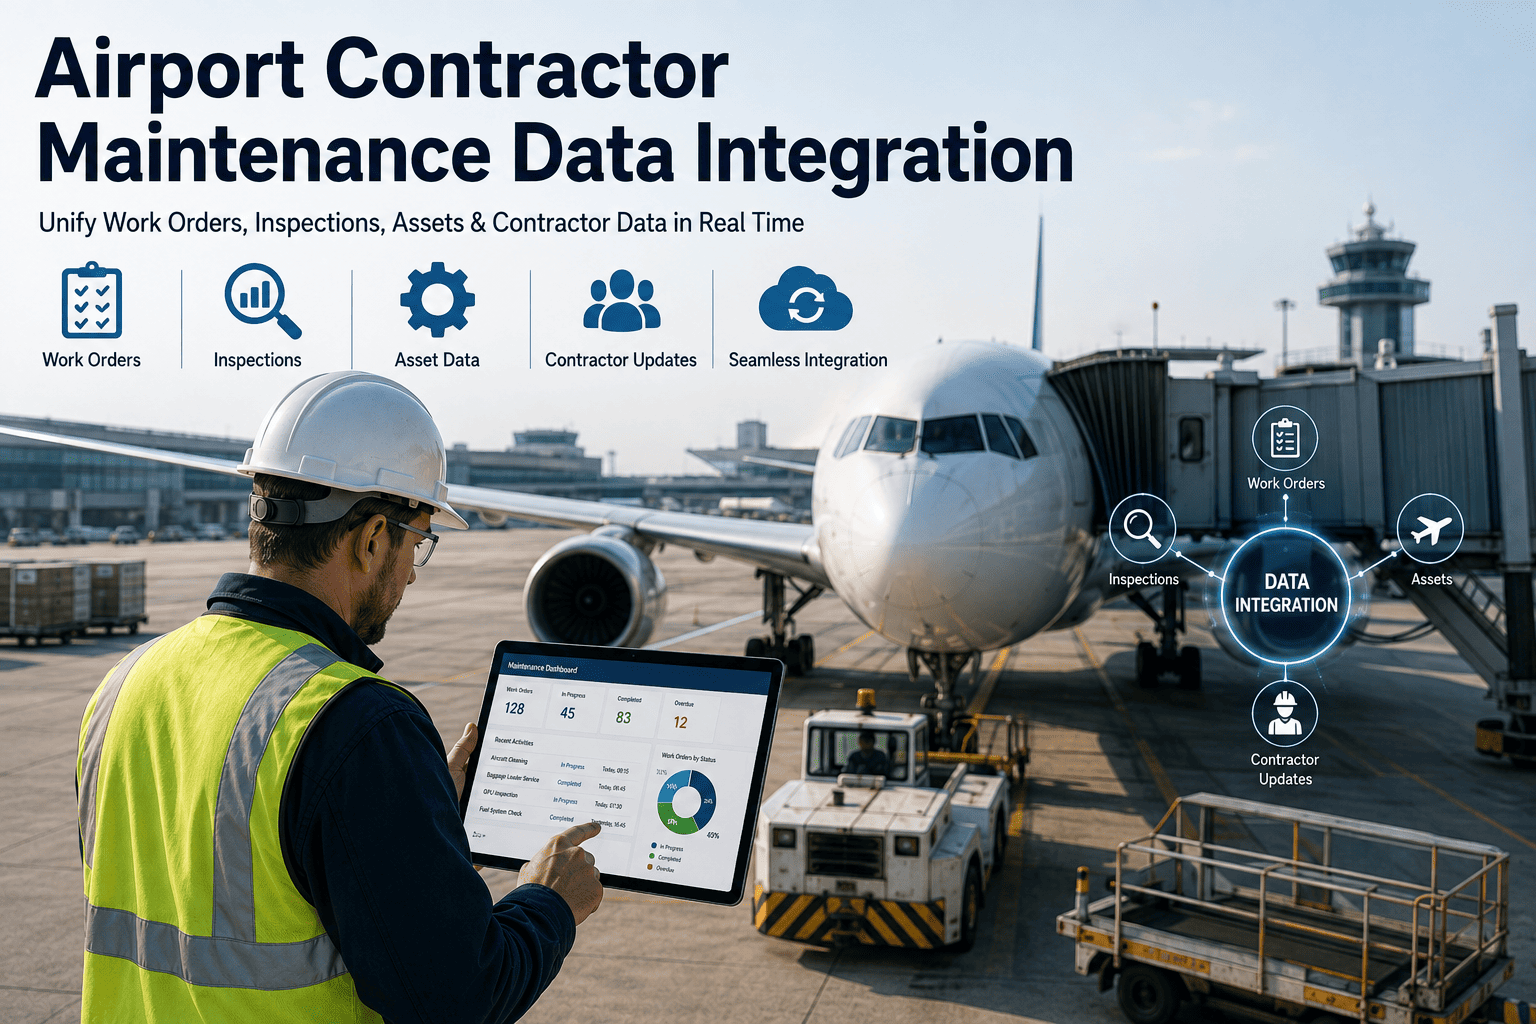
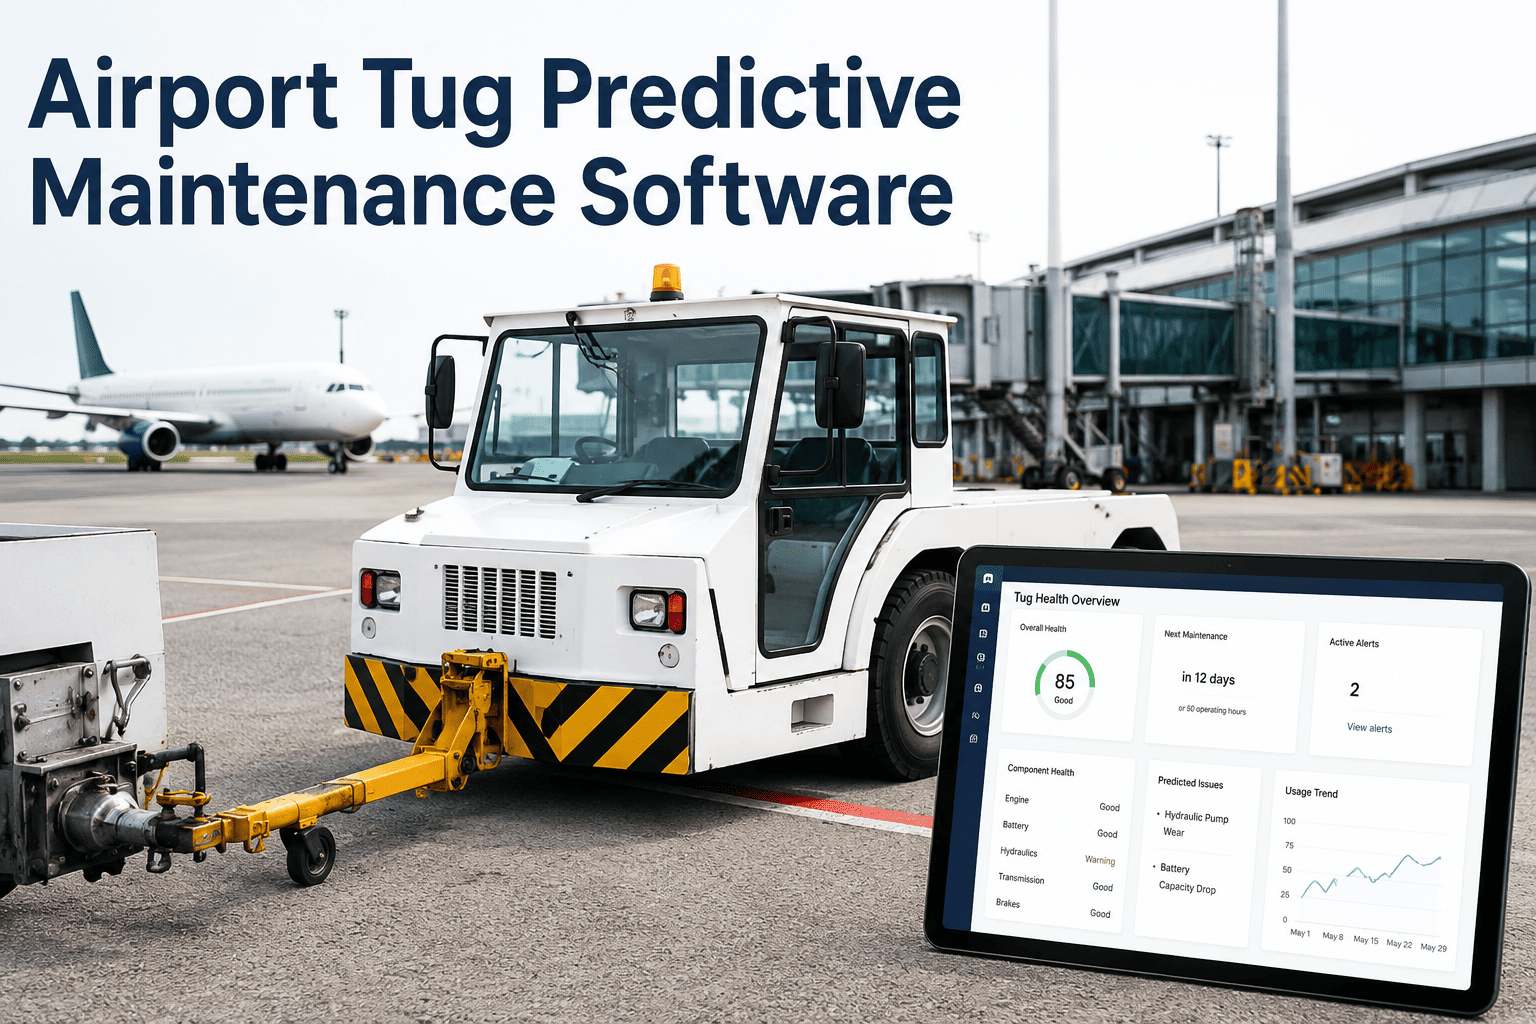
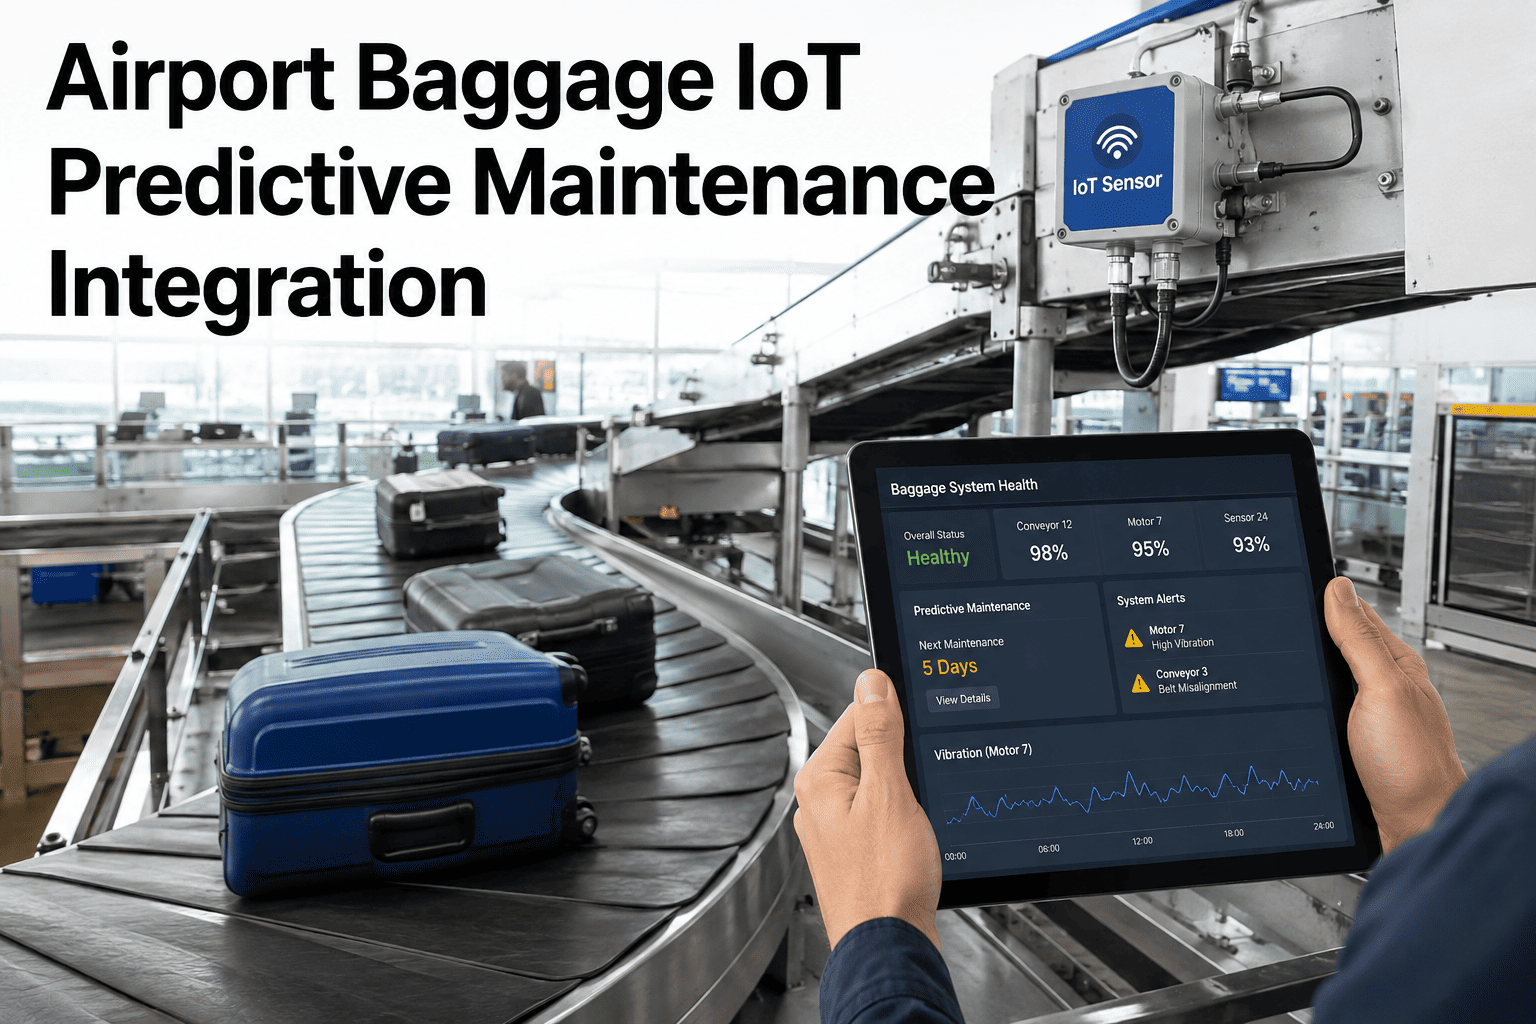
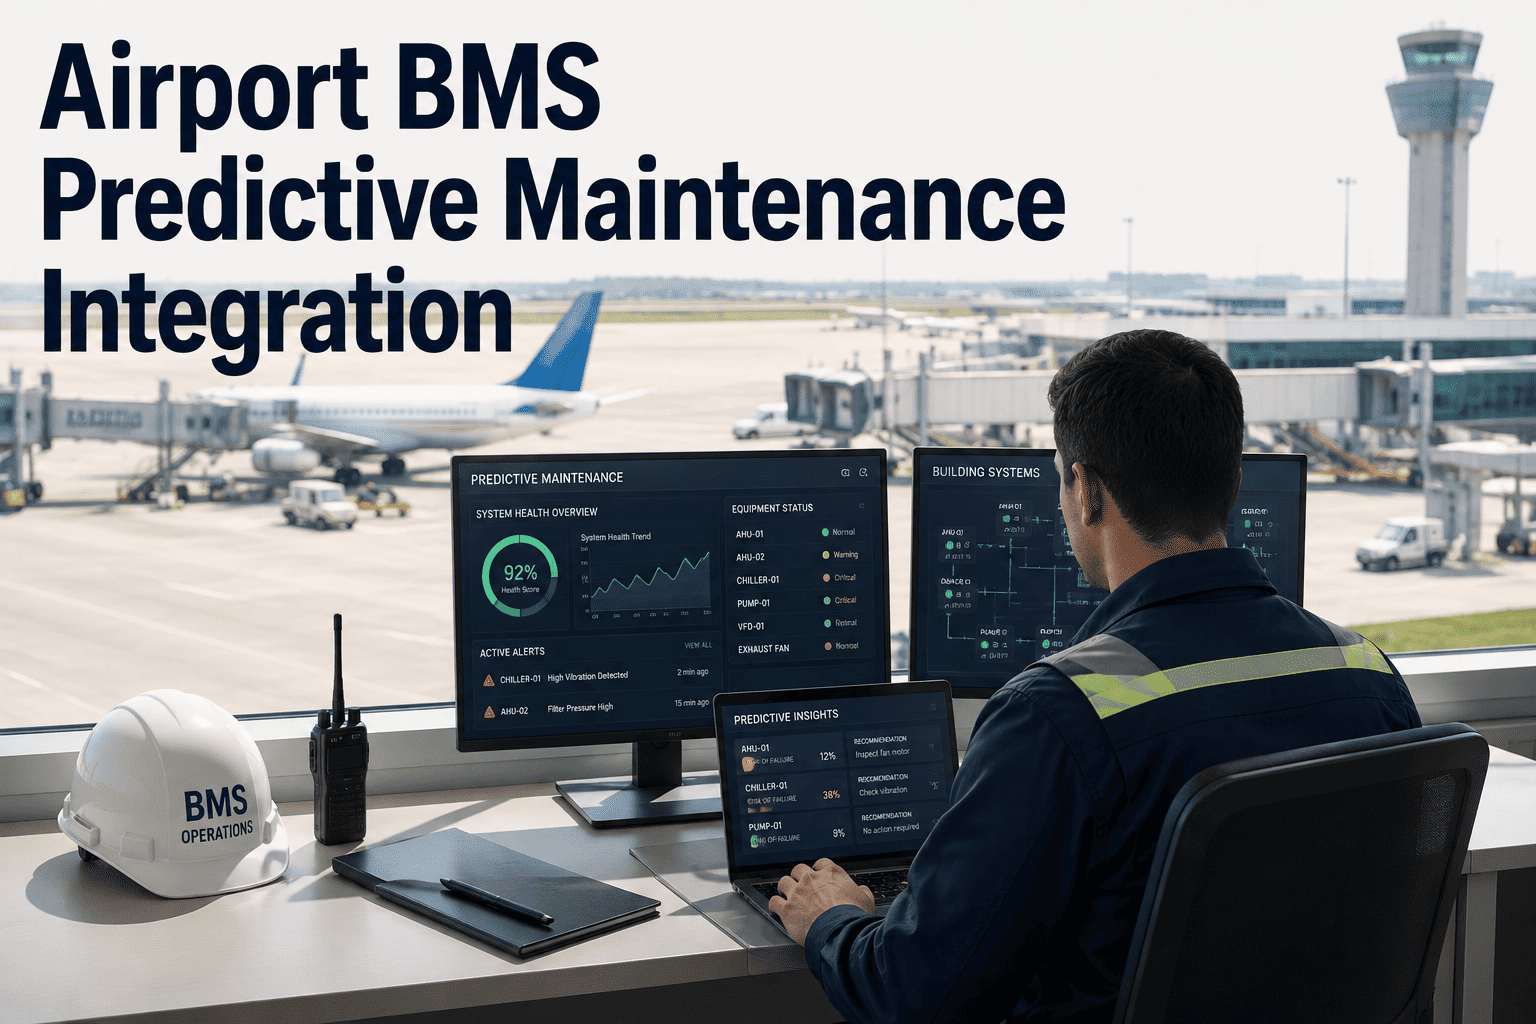
Airport terminal HVAC systems generate thousands of data points every hour from temperature sensors, vibration monitors, pressure transducers, and energy meters embedded across chillers, air handling units, and distribution networks. The problem is not a lack of data but a complete disconnection between the IoT sensors collecting this information and the maintenance systems that need to act on it. When a chiller vibration signature begins shifting outside its normal operating band, that anomaly sits in a building management dashboard while a maintenance engineer continues running time-based schedules that miss the developing fault. An airport HVAC IoT maintenance integration closes this gap by connecting sensor data streams directly to maintenance workflows so anomalies trigger work orders and failures are addressed before passengers notice a temperature change. You can book a demo to see how iFactory bridges the gap between your HVAC sensor data and actionable maintenance.
GUIDE · HVAC IoT · PREDICTIVE MAINTENANCE · AIRPORT OPERATIONS
Your HVAC Sensors Are Collecting Data — Your Maintenance Team Is Still Guessing
This guide walks through how airport HVAC IoT sensor data gets disconnected from maintenance action, the cost of that disconnection, and the integration architecture that turns raw sensor readings into predictive work orders that reduce terminal downtime.
THE DISCONNECTION
Where Your HVAC Sensor Data Flow Breaks Down
Most airports installed building management systems years ago that successfully collect data from hundreds of HVAC sensors across terminal buildings. The data arrives, gets stored, and appears on dashboards. But the flow stops there. The maintenance team that needs to act on this data operates in a completely separate system with no automated connection to the sensor outputs. The visual below shows exactly where the pipeline breaks at most airports today.
Temperature Sensors
Vibration Sensors
Pressure Sensors
Energy Meters
Building Management System — Data Collected and Stored
No Automated Connection to Maintenance Workflows
Sensors collect continuous data, BMS stores it, and maintenance engineers discover equipment problems from passenger complaints or scheduled inspections rather than from the data itself
THE RIPPLE EFFECT
What Happens When a Terminal HVAC System Fails Without IoT-Triggered Intervention
A single HVAC failure in an airport terminal does not stay contained. The impact cascades through passenger experience, flight operations, retail revenue, and maintenance budgets in a predictable sequence that gets more expensive at every stage. The cascade below shows the typical progression when sensor-detected anomalies are not converted into early maintenance action.
HVAC FAILURE AT TERMINAL 2 — CHILLER PLANT
Detected by sensors 72 hours earlier but no automated trigger reached maintenance
Passenger Comfort Complaints
Temperature deviations beyond three degrees from setpoint trigger immediate complaints through airport apps and customer service desks within the first thirty minutes of detectable failure impact.
Flight Schedule Disruption
Gate areas outside temperature limits may trigger ground stop procedures or boarding delays as airlines assess passenger comfort compliance for aircraft at affected gates.
Retail Revenue Loss
Temperature-sensitive retail tenants including food service and duty-free experience reduced foot traffic and shorter dwell times during HVAC disruptions in concession areas.
Emergency Maintenance Overtime
Unscheduled repairs require specialist technicians at premium overtime rates with parts not stocked on-site, increasing repair cost by three to five times compared to planned intervention.
Gate Reassignment Cascade
Moving flights from affected gates creates a chain reaction of reassignments disrupting ground handling schedules, passenger wayfinding, and connecting flight timing across the terminal complex.
Tenant Lease Disputes
Repeated HVAC failures in concession areas trigger lease compliance reviews and potential rent adjustment claims from retail tenants whose revenue is directly impacted by environmental conditions.
THE INTEGRATION PIPELINE
The IoT-to-Action Pipeline: How Sensor Data Becomes a Maintenance Work Order
Closing the disconnection shown earlier requires a structured pipeline that moves data from physical sensors through analysis and decision layers to a concrete maintenance action. Each stage in this pipeline has a specific function, and skipping any stage produces either false alarms or missed failures. The pipeline below represents the architecture that iFactory implements for airport HVAC IoT maintenance integration.
1
CAPTURE
Temperature, vibration, pressure, humidity, and energy sensors collect readings at defined intervals from chillers, air handling units, pumps, and terminal distribution networks across all zones.
2
INGEST
Data streams are received through BACnet, MQTT, or OPC-UA protocols, time-stamped, normalized to standard units, and stored in a structured time-series database with equipment and location metadata.
3
ANALYZE
Algorithms compare current readings against learned baselines for each equipment unit, detect statistical anomalies, identify degradation trends, and flag readings that deviate from expected operating envelopes.
4
DECIDE
Rule engines evaluate anomaly severity against predefined thresholds while predictive models assess degradation trajectory to determine whether a reading warrants immediate action, scheduled intervention, or continued monitoring.
5
ACT
Work orders are automatically created with relevant sensor data, equipment context, and severity classification, then assigned to qualified technicians with priority ranking based on operational impact assessment.
Your HVAC Sensors Already Detect Failures Days Before They Happen — The Pipeline Just Needs to Be Connected
iFactory integrates with your existing BMS and sensor infrastructure to build the complete IoT-to-action pipeline, turning raw sensor data into predictive maintenance work orders without replacing any hardware.
SENSOR INTELLIGENCE
Airport HVAC Sensor Types, What They Detect, and How They Trigger Maintenance
Not all HVAC sensors provide the same maintenance value. Understanding what each sensor type actually reveals about equipment health is essential for designing trigger rules that catch real problems without generating false alarms. The intelligence map below covers the six sensor categories most relevant to airport terminal HVAC systems and explains the specific failure patterns each one exposes.
Temperature Sensors
Measures supply air, return air, coil surface, and zone temperatures across terminal areas
Detects coil fouling through increasing approach temperature, valve sticking through delayed response to setpoint changes, and distribution imbalances through differential zone readings
Triggers work orders when supply air temperature deviates from baseline by more than two standard deviations or when coil approach temperature trend exceeds learned degradation rate
Vibration Sensors
Monitors bearing vibration on compressors, fans, pumps, and motor assemblies in chiller plants and AHUs
Identifies bearing wear through increasing vibration amplitude at characteristic frequencies, misalignment through axial vibration patterns, and lubrication degradation through high-frequency broadband energy increase
Triggers work orders when overall vibration velocity exceeds ISO 10816 thresholds for the equipment class or when trend rate indicates remaining useful life below planned service interval
Pressure Transducers
Tracks duct static pressure, refrigerant suction and discharge pressures, and differential pressure across filters and coils
Reveals refrigerant charge loss through shifting suction and discharge pressure ratios, filter loading through increasing differential pressure, and duct leaks through static pressure anomalies at measurement points
Triggers work orders when differential pressure across filters exceeds replacement threshold or when refrigerant pressure ratios deviate from compressor map expected values for current load conditions
Energy Meters
Monitors chiller COP, AHU power draw, pump motor current, and zone-level energy consumption in real time
Exposes efficiency degradation through declining COP at constant load conditions, fouling through increasing power draw for same cooling output, and control faults through erratic power patterns during part-load operation
Triggers work orders when equipment efficiency drops below configurable percentage of baseline or when power consumption trend deviates from expected seasonal operating curve by more than defined margin
Humidity Sensors
Measures supply air humidity, zone relative humidity, and outdoor air mixing ratio at air handling units
Detects coil freeze risk through supply air humidity dropping below dewpoint correlation, reheat malfunction through humidity rising above setpoint despite cooling active, and outdoor air damper failures through unexpected humidity ratio shifts
Triggers work orders when zone humidity exceeds comfort band for sustained period, when supply air humidity indicates coil freeze risk conditions, or when outdoor air mixing ratio deviates from economizer setpoint
Air Quality Sensors
Monitors CO2 concentration, volatile organic compounds, and particulate levels in terminal occupied spaces and return air paths
Indicates filter degradation through rising particulate levels downstream, fresh air damper failures through CO2 exceeding outdoor air ventilation standards, and contamination events through sudden VOC spikes in return air measurements
Triggers work orders when CO2 exceeds ASHRAE 62.1 ventilation standards for the zone type, when particulate levels indicate filter replacement is due, or when VOC readings suggest contamination requiring investigation
APPROACH COMPARISON
Predictive vs Reactive vs Time-Based: HVAC Maintenance Approach Comparison
Airport HVAC systems can be maintained using three fundamentally different approaches, and the choice between them determines both the frequency of terminal disruptions and the total cost of maintenance operations over time. This comparison covers the operational dimensions that matter when evaluating whether IoT-integrated predictive maintenance delivers measurable improvement over the approach your airport uses today.
ZONE IMPACT ANALYSIS
HVAC Failure Cost by Terminal Zone: Where IoT Integration Delivers the Most Value
Not all terminal zones carry the same financial risk when HVAC systems fail. The cost impact varies dramatically based on passenger density, operational criticality, and revenue sensitivity of each zone. Understanding these zone-specific costs helps prioritize which sensor integrations and trigger rules to implement first for maximum return on the IoT integration investment.
Gate Areas
$18,000/hr
Each gate area serves 150 to 300 passengers per flight cycle, and temperature deviations trigger airline complaints and potential fines within thirty minutes as boarding and deplaning comfort standards are assessed against carrier requirements.
Terminal Concourses
$12,000/hr
High-foot-traffic concourse areas experience rapid comfort degradation affecting thousands of passengers in transit between gates, security checkpoints, and retail zones with complaint volume scaling with dwell time in affected areas.
Baggage Handling
$8,500/hr
Equipment rooms and sorting areas require temperature control to prevent conveyor system overheating and electronic component degradation in baggage sorting systems where failure causes cascading baggage delays.
Retail and Dining
$15,000/hr
Concession revenue drops twenty-five to forty percent during HVAC disruptions as passengers avoid temperature-uncomfortable zones, creating immediate tenant revenue impact and potential lease compliance disputes.
Control Tower
$45,000/hr
Air traffic control facility environmental systems are safety-critical with strict temperature and humidity requirements, and failures require immediate backup activation with potential traffic flow restrictions affecting all airport operations.
Ground Support Buildings
$5,000/hr
Maintenance workshops and ground support equipment storage buildings require environmental control for equipment servicing, parts storage conditions, and technician working conditions that affect repair quality and turnaround times.
INTEGRATION BLUEPRINT
Five-Layer Architecture: From Physical Sensors to Maintenance Actions
Implementing HVAC IoT maintenance integration requires connecting five distinct technology layers, each with a specific role in the data-to-action pipeline. Skipping a layer or connecting them incorrectly produces either an overload of false alarms or a system that misses real failures. The architecture below shows how iFactory connects these layers for airport HVAC systems.
ACTION LAYER
Automated work order creation, priority assignment based on zone impact, technician dispatch with sensor data context, parts requisition from integrated inventory, and compliance documentation generation
INTELLIGENCE LAYER
Anomaly detection algorithms comparing readings to learned equipment baselines, degradation trend analysis, threshold rule engines, and predictive failure models estimating remaining useful life
DATA LAYER
Time-series data ingestion from multiple protocols, unit normalization, structured storage with equipment and location metadata tagging, and historical data archiving for model training
CONNECTIVITY LAYER
BACnet, MQTT, OPC-UA, and Modbus protocol adapters, edge gateway management, BMS API integration, and secure data transport with encryption and authentication
PHYSICAL LAYER
Temperature, vibration, pressure, humidity, energy, and air quality sensors installed on chillers, air handling units, fan coil units, pumps, and terminal duct distribution networks
FREQUENTLY ASKED QUESTIONS
Questions From Airport Facilities and Maintenance Engineering Leaders
Do we need to replace our existing building management system to integrate HVAC sensor data with maintenance workflows?
No. iFactory connects to your existing BMS through standard protocols including BACnet, OPC-UA, and MQTT, extracting sensor data without modifying or replacing the BMS itself. Your BMS continues handling its current building control functions while iFactory adds the analysis and maintenance trigger layer that the BMS was not designed to provide. The integration reads data from the BMS and writes work orders to your maintenance system, leaving both existing platforms fully operational.
Contact our support team to discuss compatibility with your specific BMS platform and sensor infrastructure.
How does the system distinguish between a real equipment anomaly and a temporary sensor fluctuation that does not require maintenance action?
The intelligence layer applies multiple validation steps before triggering a work order. Raw readings are first filtered for sensor quality flags and measurement validity, then compared against short-term statistical baselines to eliminate transient fluctuations. Persistent anomalies are evaluated against longer-term equipment operating envelopes, and only readings that exceed both instantaneous thresholds and trend-based degradation criteria generate maintenance triggers. This multi-stage validation reduces false alarm rates to below five percent of total triggers in production environments.
Book a demo to see how anomaly validation works with your sensor data.
What happens if a sensor fails or goes offline — does the system generate incorrect work orders based on bad data?
The platform monitors sensor health indicators including communication status, reading reasonableness checks, and correlation with neighboring sensors measuring related parameters. When a sensor is detected as offline or producing readings outside physically plausible ranges, it is automatically flagged as unhealthy and excluded from anomaly detection and maintenance trigger calculations. Maintenance teams receive a sensor health alert separately from equipment maintenance work orders, ensuring that bad sensor data never drives incorrect maintenance actions on healthy equipment.
Contact our support team to learn about sensor health monitoring capabilities.
Can the IoT integration prioritize maintenance actions based on which terminal zone is affected and what flights are currently scheduled?
The decision layer incorporates both static zone priority configurations and dynamic operational context when ranking generated work orders. Zone priority is set during implementation based on the cost impact analysis for each terminal area, while dynamic context pulls real-time flight schedule data to elevate work orders for equipment serving gates with imminent departures or high passenger volumes. This means a vibration anomaly on a chiller serving an active gate area with boarding in progress receives higher priority than the same anomaly on a chiller serving a vacant concourse section.
Book a demo to see dynamic priority assignment in action.
How long does it take to deploy HVAC IoT maintenance integration across a typical terminal building?
A typical terminal building integration takes six to ten weeks from initial BMS connectivity assessment through full production deployment with calibrated trigger thresholds. The timeline breaks down into two to three weeks for protocol integration and data validation, two to three weeks for baseline learning where the system establishes normal operating envelopes for each equipment unit, and two to four weeks for trigger threshold calibration and parallel operation with existing maintenance processes. High-criticality zones like control towers and gate areas can be prioritized for faster initial deployment while remaining zones follow in subsequent phases.
Book a demo to receive a deployment timeline estimate for your terminal configuration.
Every Hour Your HVAC Sensors Spend Disconnected From Maintenance Is an Hour of Preventable Terminal Risk
iFactory connects your existing BMS sensor infrastructure to automated maintenance workflows, turning the data your sensors already collect into predictive work orders that stop failures before passengers notice them.