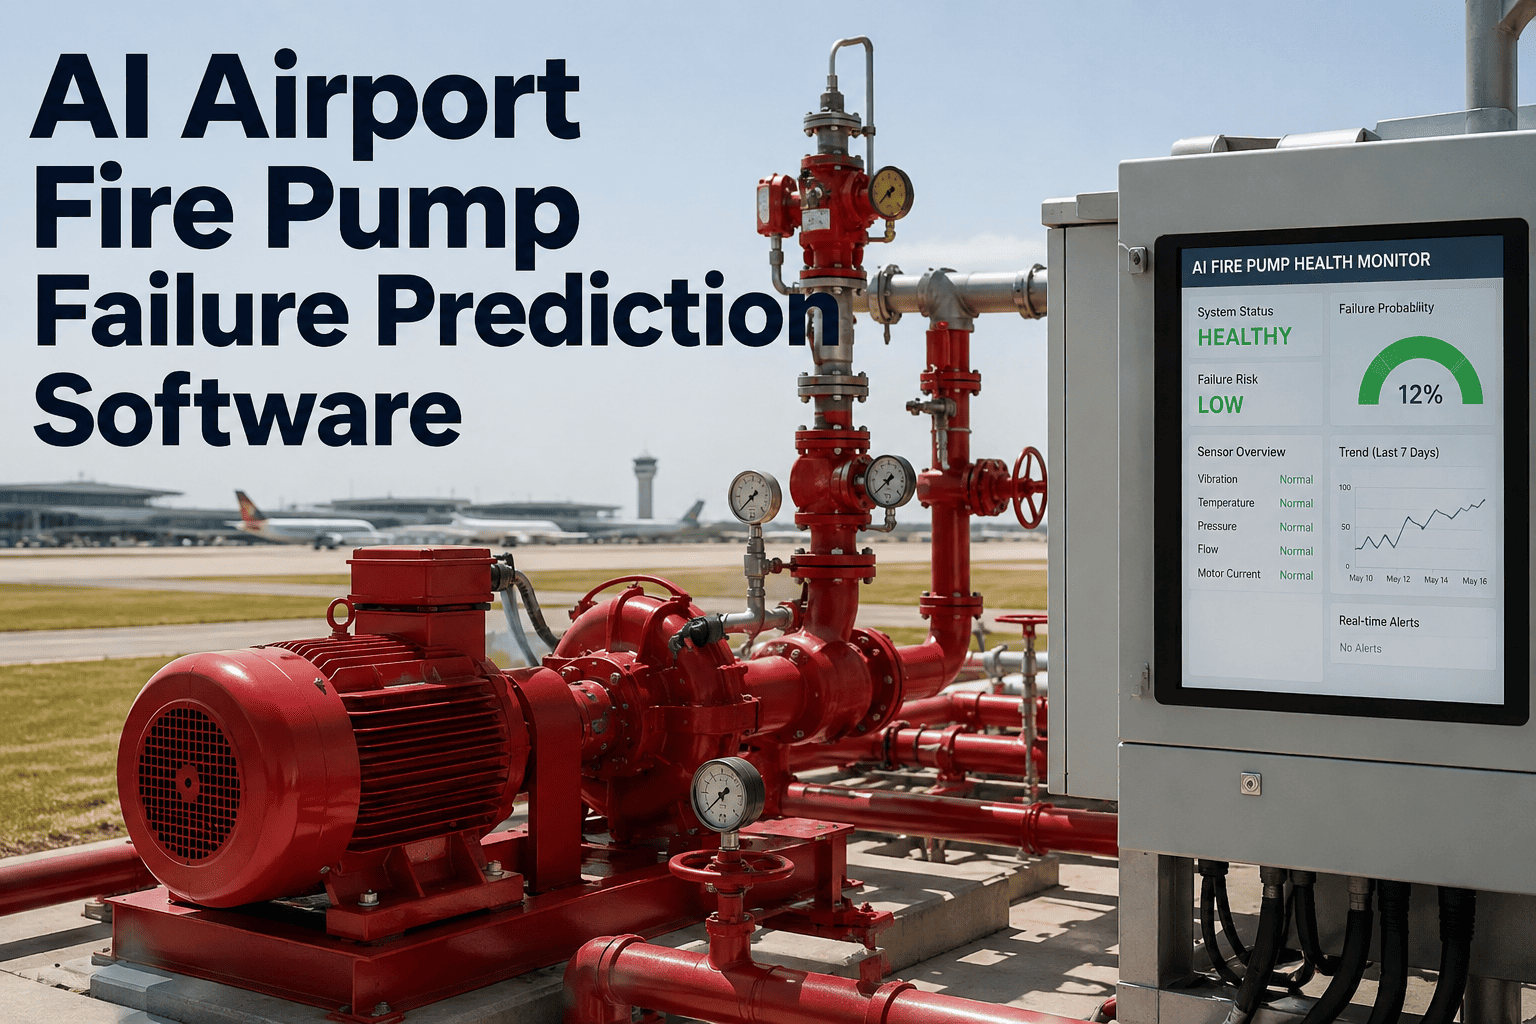
Airport fire pump systems sit at the exact intersection of life-safety code and mechanical reality — NFPA 20 and NFPA 25 require them to start instantly and deliver rated flow the moment sprinkler or hydrant demand drops, yet most airports still confirm that readiness with a weekly no-flow churn test and an annual full-flow test, leaving long stretches between real performance checks. A jockey pump that cycles too often, a diesel engine that cranks a few seconds slower than last quarter, or a battery bank quietly losing charge rarely shows up on a paper test log until the pump is asked to perform under actual fire conditions. AI-guided condition monitoring closes that gap by tracking churn pressure, start time, engine parameters, and controller health continuously between code-mandated tests, flagging degradation while there is still time to correct it. For terminals, concourses, and cargo facilities where a failed fire pump start is not an operational inconvenience but a life-safety event, that continuous visibility is what separates a system that passes its test from a system that actually works — walkthrough available at iFactory support.
AI Fire Pump Reliability · Airports
Airport Fire Pump Failure Prediction Software
Continuous condition monitoring on jockey, electric, and diesel fire pumps — catching churn pressure drift, engine start degradation, and controller faults between NFPA-mandated tests, before they show up as a failed start during a real event.
Electric Fire Pump
Normal
Diesel Fire Pump Engine
Watch
Controller & Battery Bank
Normal
11 Months
Typical gap between a full-flow annual test and the next one, with only weekly churn checks in between
Seconds
NFPA 20 automatic start window a diesel engine must consistently hit under demand
Continuous
Coverage between code-mandated tests when condition data is streamed instead of logged on paper
Why Fire Pump Failures Slip Through
A Passed Weekly Test Does Not Mean a Reliable Pump
Churn Test Blind Spot
A weekly no-flow churn test confirms the pump starts and runs, but it says almost nothing about whether the pump will actually deliver rated flow and pressure when hydrants or sprinklers open under real demand.
Diesel Engine Start Drift
Cranking time, oil pressure buildup, and coolant temperature at start all drift gradually as a diesel engine ages — changes an inspector glancing at a gauge during a routine test rarely catches early enough.
Battery & Controller Fatigue
Starting batteries and transfer switches degrade quietly between tests, and a controller fault that would prevent an automatic start often only surfaces the moment it is actually needed.
Paper Test Logs, No Trend
Weekly churn readings get written on a clipboard and filed for the AHJ, but nobody is plotting pressure or start-time trend across months, so a slow decline never gets flagged until it becomes a failed annual flow test.
Failure Modes & Warning Windows
What Degrades First, and How Much Notice It Gives
Failure Mode
Early Warning Signal
Typical Lead Time
Churn Pressure Drop
Gradual decline in no-flow churn pressure reading week over week
Weeks to months
Packing Gland Leak
Rising leak rate past the recommended drip range on shaft seal
Weeks
Diesel Engine No-Start Risk
Cranking time and oil pressure buildup trending slower across successive starts
Several weeks
Battery Voltage Decay
Starting battery voltage under load trending downward between weekly starts
A few weeks
Controller Fault
Intermittent transfer switch or pressure-sensing line fault codes logged but not reviewed
Days to weeks
NFPA 20 / NFPA 25 Testing Cadence
Where Code-Mandated Testing Ends and Continuous Monitoring Begins
Test Type
Frequency
What It Confirms
No-Flow Churn Test
Weekly (diesel), monthly (electric)
Pump starts and runs at churn pressure
Annual Flow Test
Once per year
Pump delivers rated flow and pressure under load
Continuous Condition Monitoring
Every start, every cycle
Trend on pressure, start time, engine and battery health between tests
How the Monitoring Program Runs
From Sensor Reading to Prioritized Work Order
1
Baseline Capture
Churn pressure, start time, and engine parameters are recorded across a run of normal starts to establish a pump-specific baseline.
2
Continuous Logging
Every weekly or monthly churn test automatically logs pressure, start time, and controller status against that baseline.
3
Trend Analysis
AI models track drift across successive starts, distinguishing normal seasonal variation from genuine mechanical or electrical degradation.
4
Alert Generation
A flagged trend generates a graded alert tied to the specific pump, component, and observed deviation — not a generic reminder.
5
Work Order Routing
The alert routes into the maintenance system as a prioritized work order, scheduled ahead of the next required flow test.
A Fire Pump That Passes Its Weekly Test Can Still Fail the Day It Actually Matters.
Continuous condition monitoring catches the drift a clipboard test cannot — before the annual flow test, before an AHJ finding, before an actual demand event.
Manual Testing vs. Continuous Monitoring
Where the Two Approaches Diverge
Aspect
Manual Logbook Testing
AI-Guided Monitoring
Data Captured
Single reading written per weekly test
Full parameter set logged automatically every start
Trend Visibility
Requires someone to manually review paper logs across months
Trend surfaced automatically as it develops
Alerting
None between scheduled tests
Graded alert the moment a deviation is confirmed
Audit Record
Paper logs, easy to lose across staff turnover
Digital, searchable record tied to each pump over years
Common Mistakes
Where Fire Pump Programs Fall Short
Treating Churn Pass as Reliability Proof
A successful weekly churn test is treated as confirmation the pump is fully reliable, when it only confirms the pump starts — not that it will deliver rated flow.
No Cross-Test Comparison
Each weekly reading is recorded in isolation, with no one comparing this week's churn pressure to last month's to catch a slow decline.
Battery Checks Skipped
Starting battery voltage under load is rarely tracked between annual tests, leaving a common no-start cause largely unmonitored.
Findings Not Routed to Maintenance
A borderline reading gets noted on the test sheet but never becomes an actual work order until the annual flow test flags it as a failure.
Field Example
Catching a Diesel Engine Start-Time Drift Before the Annual Flow Test
A mid-size airport running a diesel fire pump serving its main terminal and adjacent cargo building had been passing its weekly churn tests without incident for over a year, with the annual flow test still five months out. Engine start time and oil pressure buildup were being logged automatically alongside the churn pressure reading during each test.
Trend analysis flagged a gradual increase in cranking time across eight consecutive weekly starts, along with a slower-than-baseline oil pressure buildup — both consistent with early starter motor and battery degradation rather than random variation. The alert was routed as a prioritized work order well ahead of the next required test.
Maintenance replaced the starter motor and starting battery bank during a scheduled window, and subsequent weekly starts returned to baseline cranking time. The airport avoided entering its annual flow test with a degrading start system, and the fire pump program now uses trend flags rather than a pass or fail result alone to schedule preventive work.
8 weeks
Of trend data before the drift was flagged
5 months
Ahead of the next required annual flow test
Baseline
Cranking time restored after starter and battery replacement
Readiness Checklist
Is Your Fire Pump Program Ready for Continuous Monitoring
01
Every jockey, electric, and diesel fire pump on site is identified with its current test schedule and location
02
Weekly and monthly churn test data is captured somewhere beyond a paper clipboard log
03
Someone owns reviewing trend data between annual flow tests, not just filing the pass or fail result
04
A path exists for a flagged trend to become a scheduled work order before the next required test
Frequently Asked Questions
What Airport Fire Safety Teams Ask First
Does condition monitoring replace NFPA 25 required testing?
No, and it is not meant to. NFPA 25 churn and annual flow testing remain the code-required basis for demonstrating fire pump readiness to the authority having jurisdiction. What continuous monitoring adds is visibility in the months between those required tests, catching gradual degradation in pressure, start time, or battery condition long before it would otherwise surface as a failed annual flow test. Airports running both together typically enter each required test with far more confidence in the outcome. Details on how the two work together can be reviewed during a
demo walkthrough.
What data does the system pull from an existing fire pump controller?
Most modern fire pump controllers already log start time, run time, pressure readings, and fault codes internally, and that data can typically be pulled directly without adding significant new hardware. For older electromechanical controllers without native logging, lightweight sensors are added to capture pressure, current draw, and start timing. The exact integration approach depends on the controller generation installed at each pump, which is scoped during initial deployment planning.
How does this help during an actual AHJ inspection or audit?
Instead of producing a stack of paper logs for the inspector to flip through, the digital record shows a continuous trend line for every fire pump alongside every required test result, making it straightforward to demonstrate that degradation was caught and corrected proactively. Many fire marshals and insurance auditors view a documented trend-based program favorably compared to a program that only shows pass or fail results with no supporting history. The
support team can share example audit-ready reports during scoping.
Can this cover multiple fire pump houses across a large airport campus?
Yes, the platform is built to monitor every fire pump across a campus — from a single terminal pump house to multiple pump stations serving cargo facilities, hangars, and remote fuel farm areas — from one unified dashboard. Each pump gets its own baseline and trend history, so a degrading unit at a remote cargo building gets the same visibility as one inside the main terminal pump room, without requiring staff to physically visit every location to compare readings.
How long does it take to establish a reliable baseline for a new installation?
A workable baseline typically forms within the first several weekly or monthly test cycles once monitoring begins, since most fire pumps already run their required churn tests on a fixed schedule and each cycle adds another data point. Seasonal variation, such as cold-weather effects on diesel engine starts, is factored in as additional cycles accumulate across different conditions. Full deployment scoping, including baseline timelines for a specific site, can be arranged by booking a
demo.
Stop Finding Out Your Fire Pump Was Degrading When the Annual Flow Test Says So
Continuous condition monitoring across jockey, electric, and diesel fire pumps — catching drift between code-mandated tests, before it becomes a life-safety exposure.