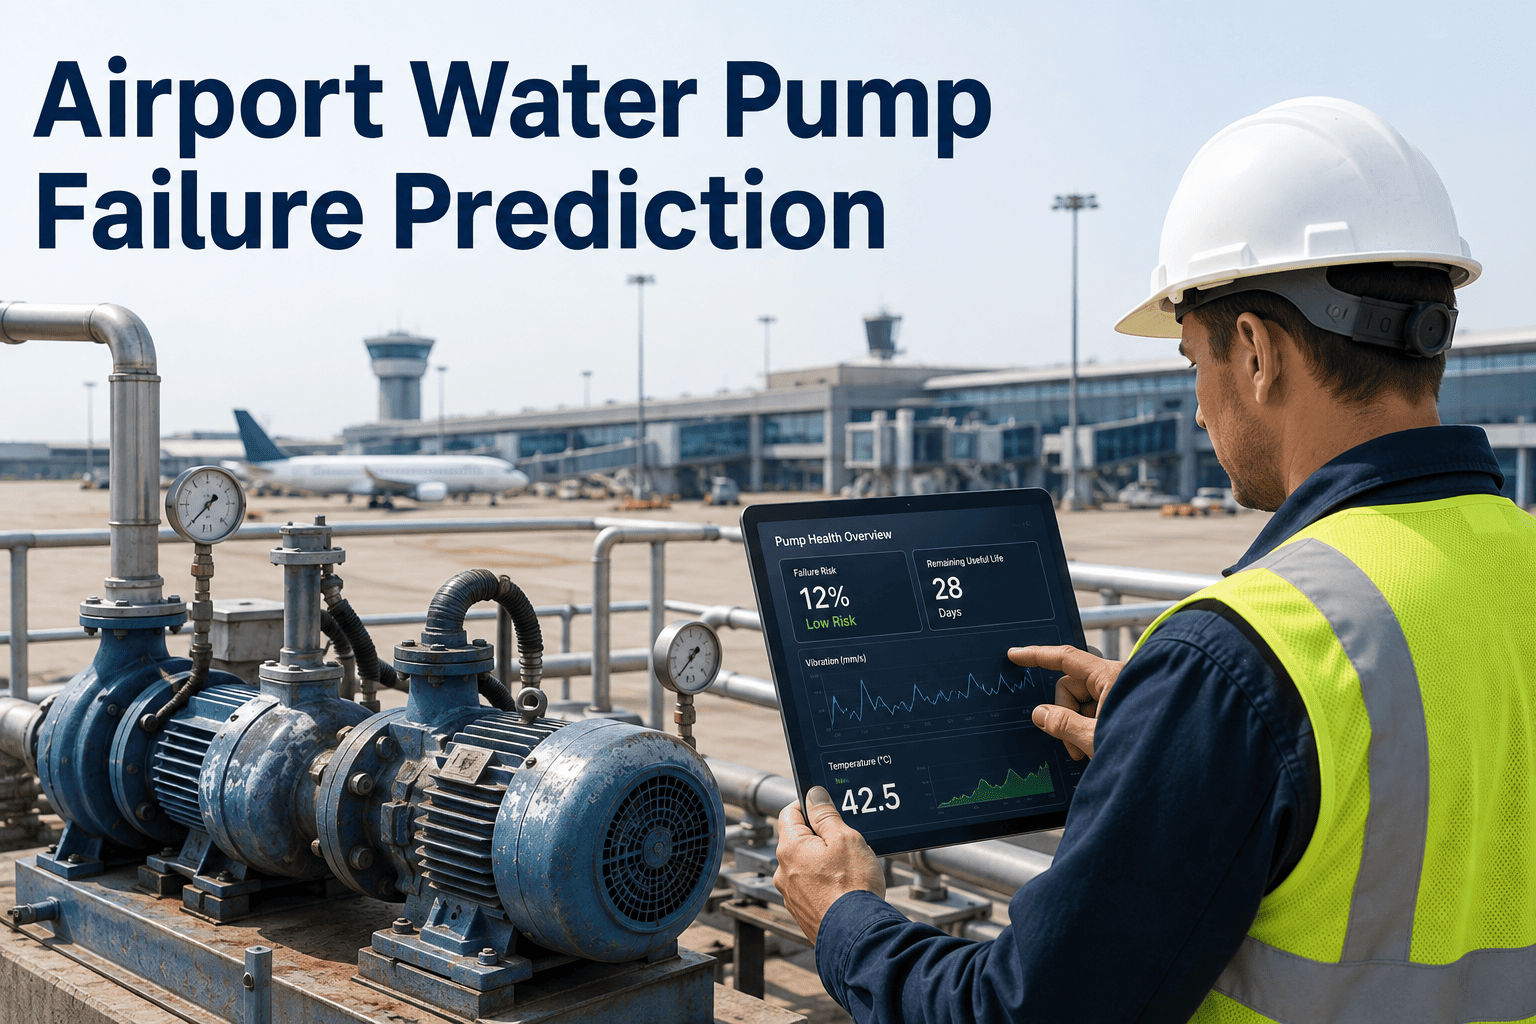
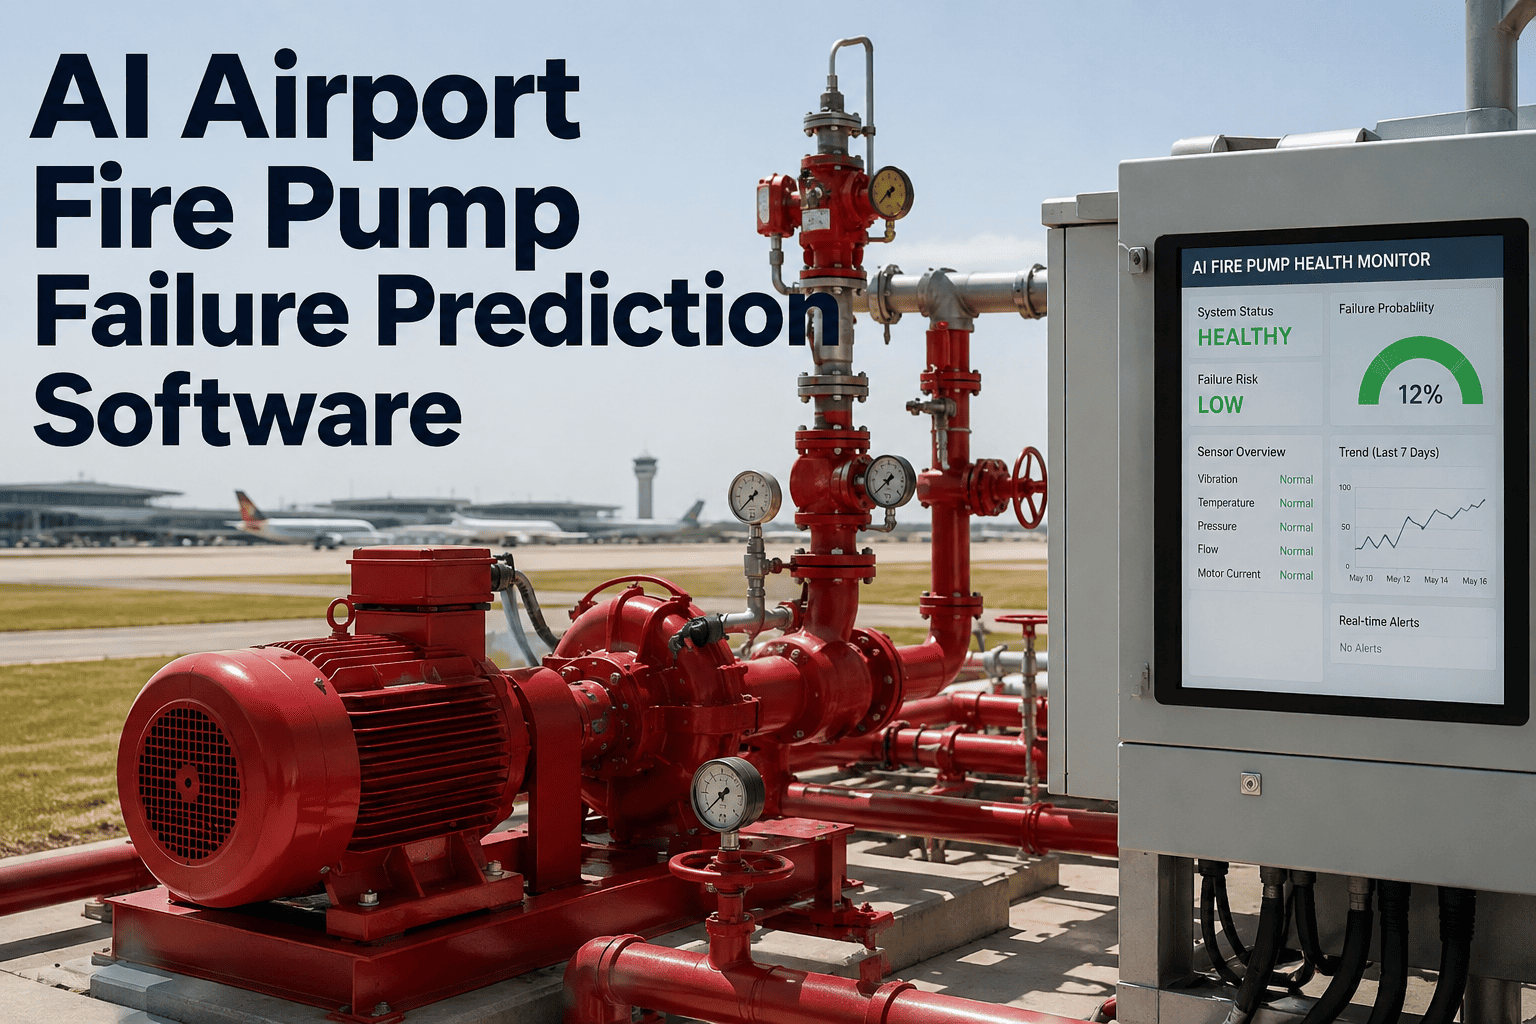
A terminal restroom bank going dry during a morning rush, a fire suppression pump failing its weekly churn test, a chiller water pump seizing on the hottest day of the summer — none of these events start suddenly. They start weeks earlier with a bearing that runs a few degrees warmer than normal, a flow curve that quietly drifts, or a seal that begins weeping before anyone walks past it. Airports run dozens of water pumps across potable supply, fire protection, stormwater, and HVAC loops, and most are still managed the same way: run until something goes wrong. Book a demo to see how condition data turns that guesswork into an early warning.
AVIATION MAINTENANCE · WATER PUMP RELIABILITY · FAILURE PREDICTION
Stop Airport Water Pump Failures Before They Reach the Terminal
iFactory turns vibration, pressure, temperature, and flow data from airport water pumps into early failure warnings, automated work orders, and an inspection record your operations team can actually trust.
2-8 Weeks
Typical Advance Warning Window
24/7
Continuous Condition Monitoring
4
Critical Water Systems Covered
THE HIDDEN RISK
Why a Single Pump Failure Can Disrupt an Entire Terminal
An airport is not a single building with one water system, it is a cluster of interdependent systems that all depend on pumps nobody notices until they stop. A fire pump that fails its churn test can halt occupancy approvals. A potable water booster pump losing pressure during a peak departure bank affects thousands of passengers within the hour. A chilled water pump seizing during a summer heat spike can push terminal HVAC into an emergency response. Each of these events is preventable, because the mechanical signs of failure almost always exist well before the failure itself.
01
Passenger-Facing Disruption
Restrooms, concessions, and drinking water stations across a concourse can go dry within minutes of a booster pump trip, generating complaints and negative press before maintenance even receives the alert.
02
Fire Protection Compliance Exposure
Fire pumps that fail a weekly or monthly churn test can trigger reporting obligations and, in severe cases, occupancy restrictions until the system is verified and returned to service.
03
Emergency Repair Cost Premiums
A pump that fails in service almost always costs more to fix than one caught early, since emergency labor, expedited parts, and secondary damage to bearings, seals, and motors stack on top of the original problem.
04
Cascading System Strain
When one pump in a redundant pair fails, the surviving unit runs harder and hotter than it was designed for, quietly shortening its own life until it becomes the next unplanned failure.
WHERE THEY OPERATE
The Four Water Pump Systems Every Airport Depends On
Not every pump on an airfield carries the same consequence when it fails, and a prediction program only earns its budget when it is aimed at the systems where downtime actually hurts. These four categories cover the overwhelming majority of water-pump-related disruption risk across a typical commercial airport, from the airside apron to the terminal roof.
Potable Water Booster Pumps
Maintain pressure to restrooms, concessions, galleys, and drinking fountains across every concourse and pier
Fire Protection and Sprinkler Pumps
Hold code-required pressure for standpipes, sprinkler zones, and hydrant loops across terminal and hangar buildings
HVAC Chilled and Condenser Water Pumps
Circulate cooling water that keeps terminal climate control, data rooms, and server closets within operating range
Stormwater and Sewage Lift Pumps
Move runoff and wastewater away from runways, aprons, and terminal buildings to prevent flooding and backup
Most of these pumps run in pairs or trios for redundancy, which is exactly why a slow failure is so easy to miss without condition data. A backup pump quietly absorbing extra load while its partner degrades looks like normal operation on a walk-through inspection, right up until the point where both units are compromised at the same time. Monitoring every pump in a redundant group, not just the lead unit, is what keeps that hidden risk visible.
FAILURE SIGNATURES
What Each Pump Failure Mode Looks Like Before It Happens
Every major pump failure mode leaves a distinct fingerprint in the data long before the pump actually stops delivering water. Cavitation sounds different from bearing wear, and a failing mechanical seal shows up in a completely different parameter than a winding fault. Reading these signatures correctly is what separates a maintenance team that reacts to failures from one that schedules around them.
Give Your Maintenance Team the Warning Window It Deserves
iFactory connects sensor data, inspection rounds, and CMMS work orders into one governed record for every water pump on the airfield, so your team schedules repairs on their terms instead of the pump's. Book a demo to see it mapped against your own pump inventory.
HOW PREDICTION WORKS
From Raw Sensor Signal to a Closed Work Order
Predicting a pump failure is not one step, it is a chain of four connected steps that has to work end to end or the warning never reaches the person who can act on it. A program that stops at data collection without closing the loop into a scheduled repair delivers dashboards, not reliability.
1
Continuous Parameter Monitoring
Vibration, bearing and motor temperature, suction and discharge pressure, flow rate, and motor current are streamed continuously instead of read on a periodic manual round.
2
Baseline Comparison and Trend Detection
Each pump's live readings are compared against its own learned normal operating range rather than a generic nameplate limit, catching drift specific to that installation.
3
Failure Mode Classification
When a parameter drifts outside its learned range, the pattern is matched against known failure signatures to identify whether the issue is cavitation, bearing wear, a seal, or a motor fault.
4
Automated Work Order and Routing
A work order is generated automatically with the failure mode, severity, and recommended action, and routed to the right technician before the pump reaches functional failure.
MEASURED IMPACT
What Facilities Teams Report After Moving to Predictive Pump Monitoring
These figures reflect outcomes commonly reported by facilities and reliability teams after shifting critical water pump fleets from reactive or calendar-based maintenance to continuous condition monitoring. The pattern holds across water utilities, manufacturing, and aviation facilities alike: the earlier a warning arrives, the cheaper and less disruptive the fix.
2-8 Weeks
Advance Warning Before Failure
Continuous vibration, pressure, and temperature monitoring routinely surfaces developing pump faults weeks ahead of functional failure.
Fewer
Emergency Callouts
Teams that act on early warnings convert emergency, after-hours repairs into planned work scheduled during low-traffic hours.
Longer
Pump and Motor Service Life
Catching bearing wear and seal leaks early prevents the secondary damage that turns a small repair into a full pump replacement.
1 Record
Auditable History Per Asset
Every alert, inspection, and closed work order lives against the pump's asset history instead of scattered paper logs and spreadsheets.
BUILDING THE PROGRAM
A Practical Checklist for Standing Up Pump Failure Prediction
Airports rarely need to instrument every pump on day one to see results. Reliability teams that get the most value start with the pumps whose failure carries the highest consequence, then expand the program once the first warnings prove out.
1
Rank Pumps by Consequence of Failure
Start with fire pumps, primary potable water boosters, and pumps with no redundant backup, since these carry the highest operational and compliance risk.
2
Instrument Vibration and Temperature First
A single vibration sensor and a bearing temperature reading together catch the majority of common mechanical failure modes at the lowest sensor cost.
3
Add Pressure and Flow for Full Coverage
Suction and discharge pressure transducers extend coverage into cavitation and seal degradation that vibration alone can miss on its own.
4
Connect Alerts Directly to Work Orders
An alert that does not automatically generate a routed, trackable work order tends to get missed during shift changes and busy operational periods.
5
Review and Tune Thresholds Quarterly
Seasonal load changes, duty cycle shifts, and new equipment installations all affect what counts as normal, so baselines need periodic review to stay accurate.
6
Expand Coverage Once Value Is Proven
Once the highest-risk pumps are monitored and the first prevented failures are documented, expanding to secondary and support pumps becomes an easier budget conversation.
GETTING TEAM BUY-IN
Making the Case to Operations, Finance, and Facilities Leadership
A pump prediction program rarely fails because the technology does not work, it fails because the wrong people were left out of the rollout conversation. Operations leadership cares about passenger-facing disruption, finance cares about the cost of emergency repairs versus planned ones, and facilities teams care about whether the alerts actually reduce their workload instead of adding another dashboard to check. Framing the program around each group's own priority, rather than a single generic reliability pitch, is what turns a pilot project into a funded, airport-wide rollout.
01
Operations: Fewer Service Interruptions
Show operations leadership the direct link between an early pump warning and avoiding a restroom outage, a fire pump compliance issue, or an HVAC disruption during a peak travel day.
02
Finance: Planned Versus Emergency Spend
Track the cost difference between a scheduled bearing replacement and an emergency motor swap with expedited parts and overtime labor, and present it as a recurring savings figure rather than a one-time avoided cost.
03
Facilities: Less Reactive Firefighting
Demonstrate how routed, pre-classified work orders reduce the diagnostic time technicians spend figuring out what is wrong before they can even start the repair.
04
Compliance: A Defensible Audit Trail
Give compliance and safety teams a continuous condition history for fire pumps and critical water systems that stands alongside required periodic testing records.
Once a pilot group of high-consequence pumps has a few months of data behind it, the conversation shifts from asking for budget to reporting results, and the case for expanding coverage across the rest of the airfield tends to make itself. Airports that document even a single avoided fire pump compliance failure or a single prevented terminal water outage during the pilot phase typically find the rest of the funding conversation moves quickly, since the alternative cost is easy for every stakeholder to picture.
FREQUENTLY ASKED QUESTIONS
Questions Airport Facilities Teams Ask About Pump Failure Prediction
How early can a pump failure actually be predicted before it happens?
Lead time depends on the failure mode, but continuous condition monitoring commonly surfaces developing faults anywhere from a few days to roughly eight weeks before functional failure occurs. Bearing wear and impeller imbalance tend to progress more slowly and give the longest warning window, while motor winding faults and severe cavitation can develop faster and offer a shorter but still actionable window. The key advantage over manual inspection rounds is that continuous monitoring catches the earliest stage of drift, rather than waiting for the next scheduled walk-through to notice a problem that has already been developing for days.
Book a demo to see typical lead times mapped against your own pump fleet.
Do we need to monitor every water pump in the airport, or just the critical ones?
Most airports see the strongest return by starting with a smaller set of high-consequence pumps rather than instrumenting the entire fleet at once. Fire protection pumps, primary potable water boosters, and any pump without a redundant backup unit typically deliver the majority of the program's value, since their failure carries the highest operational, safety, or compliance impact. Once those pumps are monitored and the program demonstrates prevented failures, expanding coverage to secondary and support pumps becomes a much easier decision to justify.
Contact our support team to help rank your pump inventory by failure consequence.
What sensors are actually needed to start a pump failure prediction program?
A minimum viable setup for a standard centrifugal pump is a vibration sensor on the bearing housing paired with a bearing temperature reading, which together catch the majority of common mechanical failure modes including bearing wear and impeller imbalance. Adding suction and discharge pressure transducers extends coverage into cavitation and seal degradation, and motor current monitoring closes the gap on electrical faults that mechanical sensors alone can miss. Airports can start with the minimum configuration on their highest-risk pumps and expand sensor coverage as the program proves its value.
Book a demo to review a sensor configuration suited to your pump types and mechanical rooms.
How does automated failure prediction fit alongside our existing CMMS and maintenance workflow?
A prediction system delivers the most value when it does not replace the existing maintenance workflow but instead feeds directly into it, generating work orders inside the CMMS your technicians already use rather than creating a separate dashboard nobody checks. When a pump parameter drifts outside its learned baseline, the system classifies the likely failure mode, assigns a severity level, and routes a work order to the appropriate technician automatically, keeping the response inside the same system used for routine preventive maintenance. This integration is what prevents early warnings from getting lost during shift changes or busy operational periods.
Contact our support team to discuss integrating pump monitoring with your current CMMS setup.
Does predictive monitoring help with fire pump compliance testing, or only routine water pumps?
Continuous condition monitoring complements rather than replaces the required periodic churn and flow testing for fire protection pumps, but it adds meaningful value between those scheduled tests by flagging developing bearing, seal, or motor issues before they cause a failed test result. Catching a degrading condition ahead of a scheduled compliance test gives the maintenance team time to correct it proactively, reducing the risk of a failed test that could trigger reporting obligations or occupancy concerns. It also builds a continuous condition history for the pump that supports documentation beyond the point-in-time test record alone.
Book a demo to see how condition data supports your fire pump testing program.
Every Pump Watched, Every Warning Actioned, Every Terminal System Protected
iFactory brings continuous condition monitoring, automated work orders, and a full asset history together for every water pump across your airfield, so failures get caught weeks early instead of discovered mid-shift. Book a demo to see your own pump inventory running on connected prediction data.