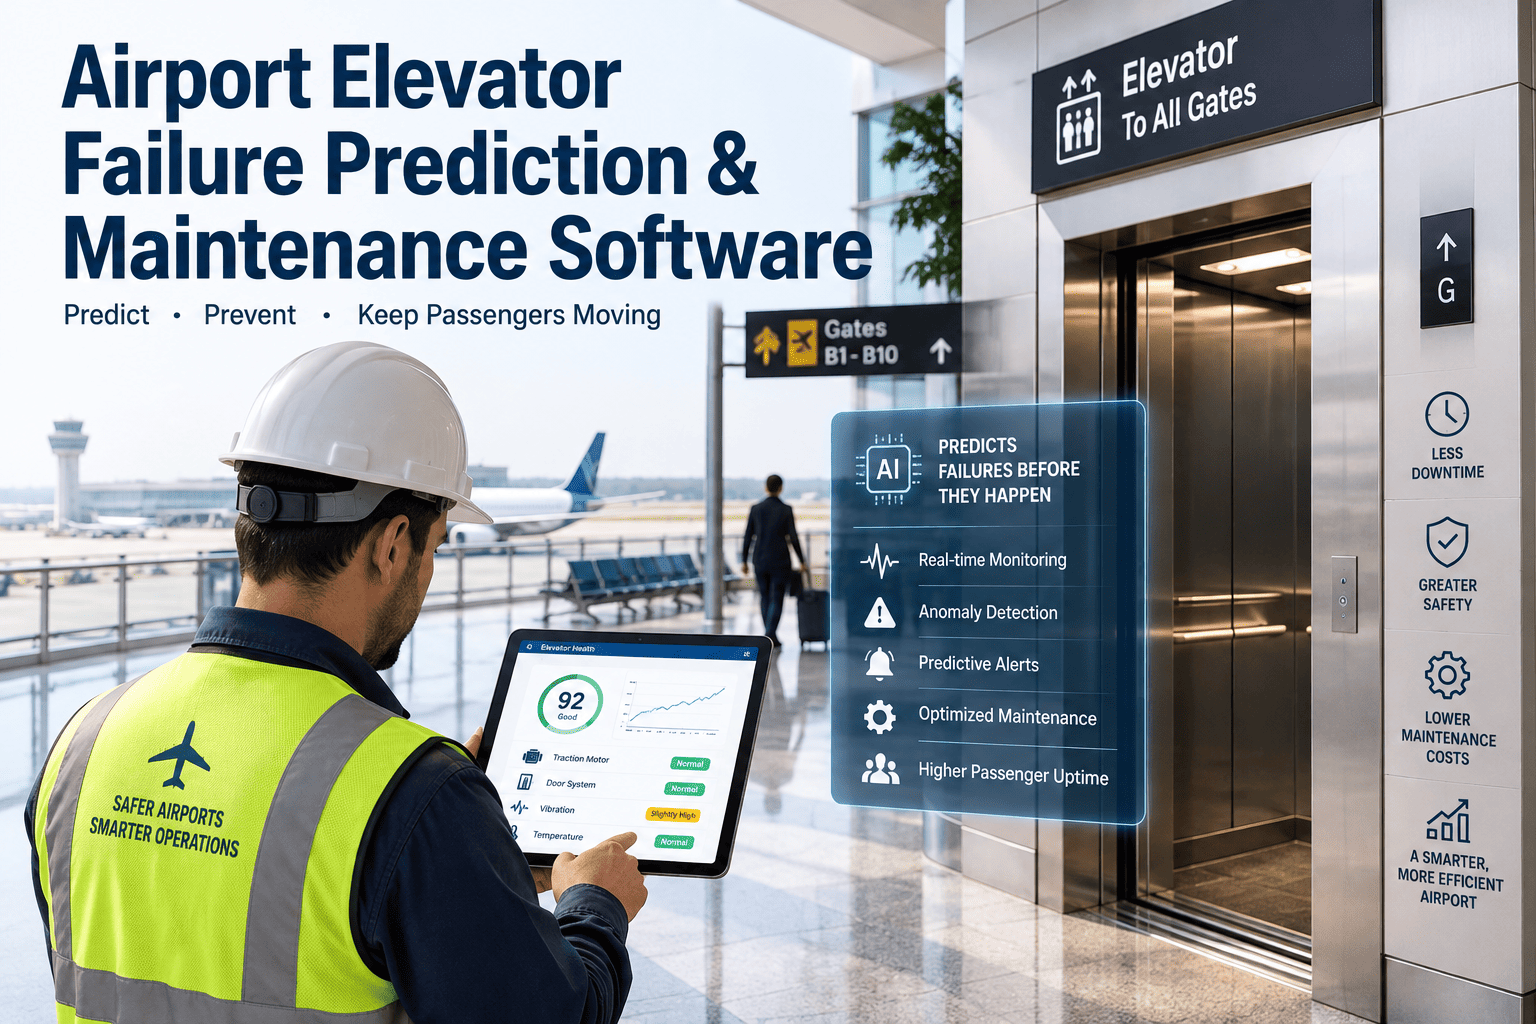
Airport terminals move hundreds of thousands of passengers between levels every week through a fleet of elevators that most travelers never think twice about until one stops working. A single elevator failure in a passenger terminal is not just an inconvenience, it is an accessibility barrier for wheelchair users, families with strollers, and anyone who cannot take the stairs, and it can trigger contractual penalties, missed connections, and an accessibility complaint that reaches airport leadership within hours. Most elevator maintenance programs still run on a fixed monthly or quarterly service interval, which means a bearing, brake pad, or door operator can degrade for weeks between visits without anyone noticing until the unit actually stops running. Predictive failure prediction software closes that gap by tracking how each elevator's own components are wearing in real time and forecasting the specific window before a failure would occur, rather than waiting for the next calendar-driven visit. Facilities teams that want to see this applied to their own terminal fleet can start by reaching out to the iFactory support team.
Your Terminal Elevators Fail Quietly for Weeks Before Anyone Notices
iFactory tracks door cycle counts, brake wear, motor load, and ride vibration on every elevator in your terminal, then converts gradual component wear into a specific predicted failure window your team can act on before a car goes out of service, without waiting on a fixed monthly or quarterly PM visit to catch it first.
Why Elevator Failures Catch Airport Teams By Surprise
A commercial office elevator can absorb a few weeks of undetected wear without much consequence because ridership is predictable and stairs are always a fallback. An airport terminal elevator carries a different burden entirely: it is frequently the only accessible path between a gate level and a baggage level, it runs through hours of continuous heavy-load cycling during bank pushes, and when it stops, there is no graceful fallback for a passenger in a wheelchair or pushing a loaded cart. Most facilities teams only learn a car is struggling when it actually goes out of service, and by then the component that failed had usually been showing measurable wear for weeks. The gap between when wear begins and when it becomes visible to a maintenance team is exactly the window a predictive model is built to close.
ADA Exposure With No Fallback
Airport terminals receive no exemption from accessibility requirements, so every elevator outage is a documented compliance gap the moment it happens, not just an inconvenience.
Continuous Heavy-Load Cycling
Bank pushes send dozens of full-load trips through a single car in under an hour, accelerating door operator, brake, and motor wear far faster than a fixed service interval assumes.
Fixed Intervals Miss Gradual Wear
A monthly or quarterly PM visit catches whatever condition the car happens to be in that day, but says nothing about a bearing or pad wearing down steadily between visits.
One Car Down Cascades Fast
When a single elevator serving a concourse level goes out of service, passenger flow redirects onto remaining units and stairs, creating congestion well beyond the affected car itself.
Elevator Failure Modes and How Much Warning Each One Gives
Not every elevator component degrades on the same timeline, and knowing which signal maps to which failure mode is what turns a vague health score into a maintenance plan a team can actually schedule around.
| Component | Typical Warning Window | What the Model Tracks | Impact if Missed |
|---|---|---|---|
| Door Operator | 3-5 weeks | Cycle torque trend and door reversal frequency | Door binding, stuck-open faults, out-of-service call |
| Brake Assembly | 2-4 weeks | Pad thickness estimate and stopping distance drift | Rough leveling, safety interlock trip, forced shutdown |
| Traction Motor Bearing | 4-6 weeks | Vibration signature and motor load current | Bearing seizure, full motor replacement |
| Rope or Belt Tension | 3-4 weeks | Tension differential across suspension members | Uneven car ride, accelerated sheave wear |
| Hydraulic Power Unit | 1-3 weeks | Fluid pressure trend and pump cycle time | Leak-down, car drift, emergency hydraulic service call |
Which Elevator Configurations This Applies To
Terminal vertical transportation fleets vary widely by concourse design and age, and a predictive program adapts to whatever elevator configuration is already in place rather than requiring new equipment first. Whether a terminal runs a single connector car or a full multi-bank concourse fleet, the underlying approach is the same: build a behavior baseline for each unit and let drift from that baseline drive the schedule.
Single-Unit Regional Connectors
One car serving a small connector between levels, where a single failure removes the only accessible path and early warning matters the most.
Multi-Car Concourse Banks
Several cars grouped at a central concourse point, where the model tracks each unit individually while accounting for shared passenger load patterns.
Parking Structure Elevators
Units exposed to temperature swings, road salt residue, and irregular but heavy-load traffic from travelers moving luggage between garage levels.
ADA-Critical Gate Connectors
Elevators serving as the sole accessible path to a specific gate or baggage claim level, where downtime carries the highest compliance and passenger-impact stakes.
What a Missed Elevator Failure Actually Costs a Terminal
The cost of an unplanned elevator outage rarely shows up as a single clean line item on a maintenance report, which is part of why it is so easy for a facilities budget to underestimate. The real cost spreads across several parts of terminal operations at once, and nearly all of it traces back to the same root cause: nobody saw the wear coming with enough lead time to plan the repair around passenger flow.
Accessibility Compliance Exposure
An out-of-service elevator serving a gate or baggage level becomes a documented accessibility barrier the moment it stops, regardless of how quickly the repair follows.
Passenger Flow and Congestion
Redirected traffic onto remaining cars and stairways slows connections terminal-wide, and the impact is felt well beyond the single concourse where the car sits.
Emergency Service Premiums
A same-day emergency elevator callout typically carries after-hours labor and expedited parts costs well above what the identical repair would cost on a planned schedule.
Accelerated Wear on Remaining Cars
When one car goes down, the remaining units in a bank absorb its share of the load, which can pull a second car's wear curve forward faster than expected.
From Fixed Interval to a Predicted Failure Window
A prediction only protects a terminal once it becomes a scheduled action rather than a number sitting in a dashboard. Here is how continuous elevator condition data becomes a work order a technician actually acts on.
Continuous Condition Data Collection
Door cycle counts, motor current, brake response time, and ride vibration stream in continuously from each elevator's existing controller.
Unit-Specific Baseline
The system builds a behavior baseline for each individual car rather than applying one generic wear curve across every unit in the fleet.
Degradation Detection
Live readings are compared against the baseline continuously, surfacing drift in door torque, brake response, or vibration long before a fault code fires.
Failure Window Prediction
Detected drift is converted into a specific dated failure window for the affected component rather than a vague health score.
Automatic Work Order Creation
The prediction is pushed directly into your maintenance system as a scheduled work order with the affected component and recommended timing attached.
Stop Discovering Elevator Problems When a Car Stops Moving
iFactory connects live elevator condition data to a prediction model built for terminal duty cycles, then turns that prediction directly into a scheduled work order in your maintenance system.
Reactive, Scheduled, and Predictive Elevator Maintenance Compared
| Approach | How Problems Surface | Typical Outcome |
|---|---|---|
| Reactive Repair | Car stops running or a fault code triggers a callback | Emergency service call, unit out of service until repaired |
| Fixed-Interval PM | Whatever condition the car happens to be in on the scheduled visit | Some issues caught early, others missed between visits |
| Predictive Monitoring | Continuous drift tracking against the unit's own baseline | Repairs scheduled around a predicted window, before failure |
Common Mistakes Airport Teams Make With Elevator Maintenance
Treating Every Car the Same
A car serving a high-traffic concourse bank wears at a very different rate than one serving a rarely used connector, yet both often sit on the same fixed PM schedule.
Waiting for a Fault Code
Controller fault codes fire after a threshold is already crossed, which is usually well past the point where a planned repair was still possible.
No Visibility Into Redundant Units
A second car in a bank that has not been monitored the same way as the primary unit can be quietly degrading, leaving less real redundancy than the fleet appears to have.
Repairs Scheduled Without Traffic Context
A technically sound repair still causes disruption if it is not timed against actual passenger volume for that specific concourse and time of day.
A Composite Scenario: The Concourse B Car That Never Went Down
A mid-size airport's Concourse B elevator bank had a recurring pattern of door operator faults on its busiest car, typically forcing an emergency service call twice a quarter during peak travel periods. After the team connected door cycle torque and motor load data to a predictive model trained on the car's own history, the system flagged a torque drift trend seventeen days ahead of what would have been the next forced outage.
The facilities team scheduled the door operator service for an overnight window with historically low passenger volume, staged the replacement parts in advance, and completed the work in under three hours with zero impact on terminal accessibility. The operator, once opened, showed wear consistent with the model's predicted severity, confirming the team had caught it at the right point in the degradation curve. The same monitoring approach was extended to the remaining cars across the terminal the following quarter, and the airport moved from two forced outages a quarter to a fully planned service calendar built around predicted wear windows instead of guesswork. Facilities leadership later cited the change as the reason the terminal's accessibility complaint count for vertical transportation dropped noticeably year over year, a metric that previously had no direct link back to maintenance scheduling decisions at all.
Is Your Elevator Fleet Ready for Predictive Maintenance
You can name the cars most likely to cause an accessibility gap
If your facilities and operations teams already agree on which units are oldest or busiest, that short list is the right starting scope for a first deployment.
Your elevator controllers already expose usable data
Existing cycle count, motor current, and fault log data from the controller accelerates deployment significantly, though a model can still be built around new instrumentation.
Your maintenance system can accept automated work order triggers
A prediction only turns into protection if it can create or flag a work order directly instead of requiring someone to manually translate a report into action.
Leadership is willing to act on an early warning
A predictive program only pays off if the team schedules planned work off the forecast instead of waiting to see whether the car actually fails first.
Frequently Asked Questions
How is this different from the fault codes our elevator controller already generates?
A controller fault code fires after a reading crosses a fixed threshold, which usually means the underlying wear has already been building for weeks. A predictive model instead learns how each specific car behaves and flags gradual drift in door torque, brake response, or motor load long before it would ever trigger a fault code, giving your team a real planning window instead of a same-day emergency callback. That planning window is what turns a repair from a disruptive callout into a scheduled overnight task. Teams can see this comparison applied to their own fleet by contacting iFactory support.
Do we need to replace our existing elevator controllers to use this?
No, the predictive model layers on top of the data your existing elevator controllers already generate, rather than requiring a mechanical or controls replacement. Most deployments start by pulling existing cycle count, current draw, and fault log data into the model, then add targeted sensing only where a specific car lacks the signal needed for an accurate prediction. This approach keeps the initial rollout limited to software integration rather than a machine room retrofit.
How much advance warning can we realistically expect before a failure?
Warning windows vary by component, ranging from roughly one to three weeks for faster-developing issues like a hydraulic power unit leak up to four to six weeks for gradual wear like a traction motor bearing. The model provides a specific predicted window rather than a single fixed number, so the exact lead time depends on which failure pattern is developing on a given car, and that window typically widens as more historical data accumulates on a specific unit.
Can this scale across a multi-terminal airport with several elevator banks?
Yes, the model tracks every car individually even when several units share a concourse bank or parking structure, and the platform is built to scale from a single connector car up to a full multi-terminal fleet without requiring a separate system for each bank. Most multi-terminal deployments start with the highest-criticality cars identified by the facilities team and expand from there. Book a demo to see how a fleet-wide rollout is typically scoped and sequenced.
How does a predicted failure actually turn into scheduled maintenance work?
Once the model predicts a failure window for a specific car, that prediction is pushed directly into your maintenance system as a work order with the relevant asset, component, and recommended timing already attached, rather than sitting in a dashboard someone has to remember to check. That closed loop between detection and action is usually the single biggest reason an accurate prediction still fails to prevent downtime when it is left out of the process. Parts staging and crew assignment can then happen well ahead of the actual service date.
Give Your Terminal Elevators the Warning System They Actually Need
iFactory builds predictive maintenance models around your airport's specific elevator fleet, turning live condition data into early warnings and scheduled work orders before an accessibility gap ever reaches the concourse.