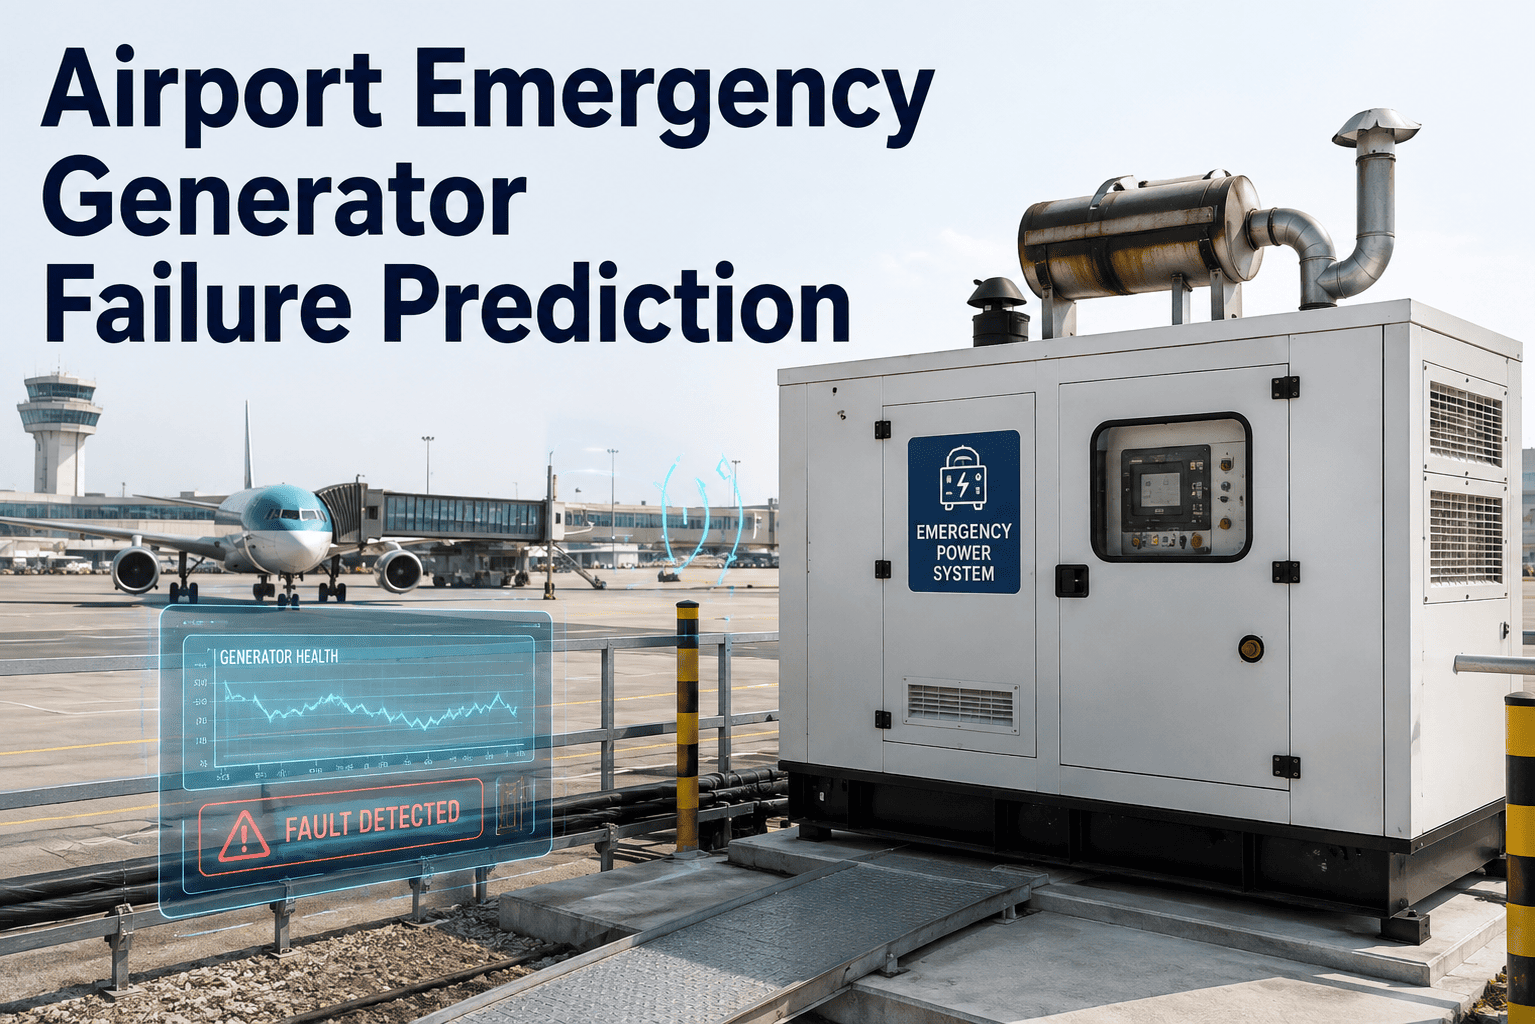
An airport emergency generator that passes its monthly 30-minute load test on Tuesday can still fail to start on Wednesday when the actual outage hits. This is not a paradox. Monthly tests verify that the generator can run under load for a short window, but they do not capture the battery degradation, fuel contamination, controller drift, and bearing wear that develop steadily between test intervals. The gap between a passing test and a real-world start failure is where most airport backup power vulnerabilities live. Book a demo to see how iFactory closes that gap with continuous AI-driven generator health monitoring.
iFactory monitors battery health, fuel systems, engine mechanicals, and control electronics across your emergency generator fleet, predicting start failures weeks before they happen.
The 17-Second Test That Misses 6 Months of Degradation
Most airport emergency generators are validated through a monthly or quarterly load test that runs the unit for 30 minutes under controlled conditions. The test confirms the generator starts, accepts load, and maintains voltage and frequency within spec. What it does not confirm is whether the battery will deliver sufficient cranking amps at 2 AM in January when ambient temperature drops well below freezing. It does not reveal whether fuel in the day tank has accumulated enough water and microbial growth to clog the secondary filter during a sustained run. It does not show whether the automatic transfer switch contacts have developed enough pitting to fail on the next transfer. Between any two scheduled tests, there are roughly 720 hours of quiet degradation that nobody is watching. Continuous AI monitoring fills that gap by tracking the exact signals that predict start failure, battery capacity loss, fuel contamination, and controller anomalies every minute of every day, not just during a 30-minute window once a month.
What Happens When Backup Power Fails at 2 AM
A single generator start failure during a real utility outage triggers a predictable cascade of operational consequences. The timeline below traces the exact sequence of events from the moment the engine fails to crank through full airport shutdown, illustrating why prediction matters more than rapid response.
Main utility power fails. The automatic transfer switch signals the emergency generator to start. The starter motor engages, but cranking speed stays below the ignition threshold due to degraded battery capacity. After two crank attempts, the controller registers a start failure. The generator that was listed as fully operational on last month's test report cannot deliver power when it is actually needed.
The ATS initiates a second retry cycle on the redundant generator for this electrical bus. The second unit also fails to start, or the single generator assigned to this bus is the one that failed. Either way, backup power for this distribution bus is now confirmed unavailable. Critical loads begin transferring to uninterruptible power supply battery systems, which are designed for minutes of ride-through, not hours of sustained operation.
UPS batteries are sustaining essential loads, but capacity is limited to 15 to 30 minutes depending on the load profile and battery age. Airfield lighting, navigation aids, and terminal critical systems are running on borrowed time. The airport operations center initiates emergency power procedures, dispatching maintenance crews to the generator room and notifying air traffic control of a potential loss of critical electrical services.
UPS capacity on affected circuits begins depleting. Airfield lighting on affected circuits goes dark or enters reduced operation. Instrument landing system and approach lighting for at least one runway may be compromised. Arriving aircraft are diverted to alternate airports. Departing aircraft are held at gates. The ripple effect spreads across the national airspace system as downstream airports absorb the displaced traffic.
If the failure affects terminal power systems, passenger processing, baggage handling, and security screening halt entirely. The airport may be forced to suspend all operations pending power restoration. Financial exposure at a major hub starts compounding at an estimated $80,000 to $150,000 per minute when accounting for airline delays, passenger rebooking costs, and contractual penalties. A single preventable generator failure can produce a multi-million-dollar event that a few weeks of predicted maintenance would have avoided entirely.
The Five Subsystems That Kill Generator Reliability
A diesel emergency generator is not a single machine. It is a system of five interdependent subsystems, and a failure in any one of them can prevent the generator from delivering power regardless of how healthy the other four may be. Understanding which subsystem is most likely to fail, and what signals it produces before failing, is the foundation of effective predictive monitoring.
Starting System — Battery and Starter Motor
Battery sulfation, plate degradation, and charge system faults reduce cranking amp capacity over months. A battery that delivers adequate cranking power at 25 degrees Celsius may fail completely at minus 5 degrees when the engine oil is thick and the starter needs maximum current. Starter motor brush wear and solenoid contact degradation add further resistance to the cranking circuit. Continuous monitoring of battery voltage, cranking voltage profile during test starts, recharge current, and temperature-compensated state of health provides weeks of advance warning before the battery reaches the point where it cannot crank the engine under worst-case conditions.
Fuel System — Supply, Filtration, and Quality
Diesel fuel degradation, microbial contamination, water accumulation, and filter clogging develop silently in day tanks and bulk storage between test runs. A generator that starts and runs fine on a clean fuel supply during a monthly test may fail to sustain operation when contaminated fuel reaches the secondary filter under extended run conditions during an actual outage. Fuel polishing systems help but are themselves subject to failure and schedule gaps. Monitoring fuel level, filter differential pressure, day tank temperature, and water detection sensor outputs catches contamination before it becomes a start-or-sustain failure.
Control and Protection System — Controller, ATS, and Relays
The generator controller, automatic transfer switch, and protection relays are electronic systems that can develop faults without any visible external symptom. ATS contact pitting from repeated transfer operations increases contact resistance over time. Relay contact degradation can cause intermittent signaling failures. Controller firmware errors, communication bus faults between the controller and the building management system, and failed sensors feeding incorrect data to the controller can all prevent a successful transfer even when the generator engine and alternator are mechanically and electrically sound. Monitoring transfer timing, contact resistance trends, and controller diagnostic codes provides early detection of these hidden failure modes.
Engine Mechanical System — Cooling, Lubrication, and Combustion
Cooling system degradation, oil condition changes, turbocharger bearing wear, and injector fouling all reduce engine reliability over time. These mechanical degradation modes develop gradually and are invisible to a monthly load test that runs for only 30 minutes, which is not enough time for thermal stress or oil degradation to manifest. A cooling system that is marginal at 30 minutes may overheat during a 4-hour sustained outage run. Continuous monitoring of coolant temperature trends, oil pressure, exhaust temperature, and engine block vibration provides diagnostic insight into mechanical health between scheduled maintenance intervals, catching problems that a short-duration test never will.
Alternator and Electrical Output — Windings, Regulator, and Excitation
Alternator bearing wear, winding insulation degradation, voltage regulator drift, and excitation system faults affect the generator's ability to produce stable power output that meets airport voltage and frequency specifications. Voltage regulator drift may cause output voltage to slowly migrate outside the acceptable band over weeks, which a single load test at one point in time may not capture if the drift is load-dependent or temperature-dependent. Winding insulation degradation leads to partial discharge events that progressively weaken the insulation until a ground fault occurs during a high-stress transfer event. Monitoring output voltage, current balance, frequency stability, and winding temperature trends catches electrical system degradation before it results in an out-of-spec or failed power supply.
From Monthly Test Pass to Real-Time Health Score
The comparison below quantifies how much of each generator subsystem's behavior is actually visible under a monthly testing protocol versus continuous AI monitoring. The gap in coverage is the gap where failures hide between tests.
Prediction Signals by Generator Subsystem
The table below maps each generator subsystem to its most critical failure modes, the sensor signals that reveal them, the AI indicators that iFactory tracks, and the typical lead time between first detection and actual failure. This lead time is the operational window that predictive monitoring creates for your maintenance team.
| Subsystem | Failure Mode | Detection Signal | AI Indicator | Lead Time |
|---|---|---|---|---|
| Starting | Battery capacity loss | Cranking voltage drop during test start | Cranking profile trend vs. baseline | 14-30 days |
| Starting | Starter motor degradation | Extended crank time, high current draw | Crank duration and current trend | 7-21 days |
| Fuel | Filter clogging | Differential pressure rise across filter | dP rate of change vs. baseline | 3-7 days |
| Fuel | Fuel contamination | Water sensor alarm, microbial indicators | Fuel quality sensor trend | 7-14 days |
| Control | ATS contact pitting | Transfer time increase over successive tests | Transfer timing degradation rate | 21-45 days |
| Control | Controller fault | Diagnostic error codes, comm loss events | Error frequency and type clustering | 1-7 days |
| Engine | Cooling system degradation | Coolant temp rise, flow rate change | Temp vs. load correlation drift | 7-21 days |
| Engine | Oil degradation | Oil pressure drop, temperature increase | Oil condition parameter trend | 14-30 days |
| Alternator | Bearing wear | Vibration increase at bearing frequencies | Vibration spectral amplitude trend | 14-28 days |
| Alternator | Voltage regulator drift | Output voltage migration from setpoint | Voltage deviation rate and pattern | 7-21 days |
iFactory calculates a real-time subsystem health score for each generator, showing you exactly which unit is degrading and how many days remain before predicted failure.
Regulatory Compliance Without the Manual Burden
Airport emergency generators sit at the intersection of multiple regulatory frameworks, each requiring documented evidence of testing, maintenance, and operational readiness. The traditional approach to compliance is manual, repetitive, and vulnerable to gaps. iFactory automates the evidence collection and reporting process by turning continuous monitoring data into audit-ready records.
Maintenance teams manually schedule each monthly load test, record results on paper or spreadsheets, photograph instrument readings, and compile test records into binders for FAA inspector review. Compliance calendars are tracked separately from work orders, creating risk of missed test windows and documentation gaps that inspectors flag during audits.
Every start event, load test result, voltage and frequency recording, and anomaly is logged automatically with timestamps. Compliance reports are generated on demand in the format inspectors expect. Approaching test deadlines trigger automated reminders tied to actual operating hours, not calendar dates, ensuring tests happen when they are operationally meaningful.
Fuel quality testing intervals, cooling system inspections, battery maintenance schedules, and EPSS level documentation are tracked through spreadsheets and physical logbooks. Fuel sampling is scheduled on fixed intervals regardless of actual fuel condition, leading to either unnecessary testing or dangerous gaps when fuel degrades faster than the schedule assumes.
Continuous monitoring replaces periodic spot-checks for systems where real-time data is available. Fuel quality data from inline sensors is logged automatically. Battery condition is assessed on every test start, not just during annual inspections. Maintenance schedules are generated from actual condition data rather than fixed calendar intervals, producing documentation that demonstrates proactive compliance rather than reactive checkbox completion.
Demonstrating backup power reliability to ICAO auditors requires assembling periodic testing records, maintenance logs, and incident reports into an evidence package. Gaps between test intervals are invisible in the record, making it difficult to demonstrate that reliability was maintained continuously rather than only at the moments when tests were conducted.
Continuous reliability data provides a complete evidence trail with no gaps. Prediction records show that degradation was detected and addressed proactively before it could affect operational readiness. Audit-ready reports are generated automatically and demonstrate continuous compliance rather than point-in-time test passing, which is a fundamentally stronger position during regulatory review.
How iFactory Monitors Your Generator Fleet
The monitoring pipeline below shows the path from raw sensor data to actionable maintenance decisions. Each stage adds a layer of processing that moves the system from simply recording what the generator is doing to predicting what it will fail to do, and when.
Sensor Integration
Connect to existing generator controllers, facility BMS, fuel management systems, and standalone sensors through OPC-UA, Modbus TCP, or REST APIs. No hardware replacement required.
Signal Ingestion
Battery voltage, cranking profiles, fuel system pressures, temperatures, vibration, and electrical output data are streamed continuously at rates matched to each signal type.
Health Scoring
AI models calculate a real-time health score for each generator subsystem, weighted by failure criticality and the consequence of that subsystem failing during an actual outage event.
Failure Prediction
Machine learning models identify degradation trends, correlate signals across subsystems, and estimate failure windows for each detected anomaly with a specific failure mode classification.
Action Delivery
Risk alerts, maintenance recommendations, and automated work orders are pushed to your maintenance team and CMMS with full diagnostic context attached to each notification.
Frequently Asked Questions
Can AI actually predict a generator start failure before it happens?
Yes. The most common cause of generator start failure is battery degradation, which produces measurable signals weeks in advance. Cranking voltage during test starts drops gradually as battery capacity declines, and the AI tracks this trend against temperature-compensated baselines to predict when the battery will no longer deliver sufficient cranking amps under worst-case conditions. Fuel system contamination, ATS contact degradation, and controller faults each produce their own detectable leading indicators. The AI does not predict random sudden failures like a snapped cable, but those represent a small fraction of real-world generator failures. The majority of failures that leave airports without backup power are slow-developing degradation modes that continuous monitoring catches well in advance. Book a demo to see prediction lead times on real airport generator data.
Does predictive monitoring replace our required monthly load testing?
No. FAA and NFPA regulations require periodic load testing as a compliance activity, and iFactory does not eliminate that requirement. What it does is dramatically increase the value of each load test by using the test data as a calibration point for the continuous monitoring models. Instead of a monthly test being the only data point you have about generator health, it becomes one of thousands of data points, and the AI can tell you whether the generator's performance during the test is consistent with its trend or represents an anomaly that warrants investigation. You still run the tests, but you are no longer dependent on them as your sole window into generator condition. Contact support to discuss how iFactory integrates with your existing test schedule.
What sensors need to be installed to get started with generator prediction?
In most cases, the majority of data needed for generator prediction is already available from the generator controller, the automatic transfer switch, and the facility building management system. Battery voltage, cranking profiles, start sequence timing, output voltage, current, frequency, coolant temperature, and oil pressure are standard controller outputs that iFactory can ingest without additional sensors. Where gaps exist, common additions include battery monitoring modules that provide state-of-health calculations, fuel filter differential pressure transmitters, and vibration sensors on the engine block and alternator bearings. iFactory conducts a sensor gap analysis during the initial assessment to identify exactly what additional instrumentation, if any, is needed for your specific generator models and installation configuration.
How does iFactory integrate with our existing facility management system?
iFactory connects through standard industrial protocols that are already supported by most airport facility management systems, SCADA platforms, and building automation systems. OPC-UA is the most common integration path for real-time data exchange, with Modbus TCP as a fallback for older equipment. REST APIs handle non-real-time data like work order synchronization and report generation. The platform is designed to sit alongside your existing systems as an intelligence layer, not a replacement. Your operators continue to use the interfaces they know, while iFactory adds predictive analytics and automated alerting in the background. Configuration, not custom development, is the integration model. Book a demo to review integration options for your specific systems.
What is the typical return on investment for airport generator predictive maintenance?
The ROI calculation is driven by three factors. First, avoided outage costs: a single generator start failure during a real utility outage at a major hub can cost between $500,000 and $5 million depending on duration, affected systems, and time of day. Even one prevented failure typically justifies the entire monitoring investment. Second, reduced maintenance waste: condition-based maintenance eliminates unnecessary battery replacements, oil changes, and filter changes that are performed on calendar schedules regardless of actual condition, typically reducing maintenance material costs by 20 to 30 percent for monitored assets. Third, compliance automation: eliminating manual test documentation, report compilation, and audit preparation saves maintenance management time that can be redirected to higher-value activities. Most airports see full payback within the first year of deployment through a combination of these three value streams.
Talk to iFactory about building a continuous monitoring capability for your airport emergency generator fleet before your next scheduled load test.