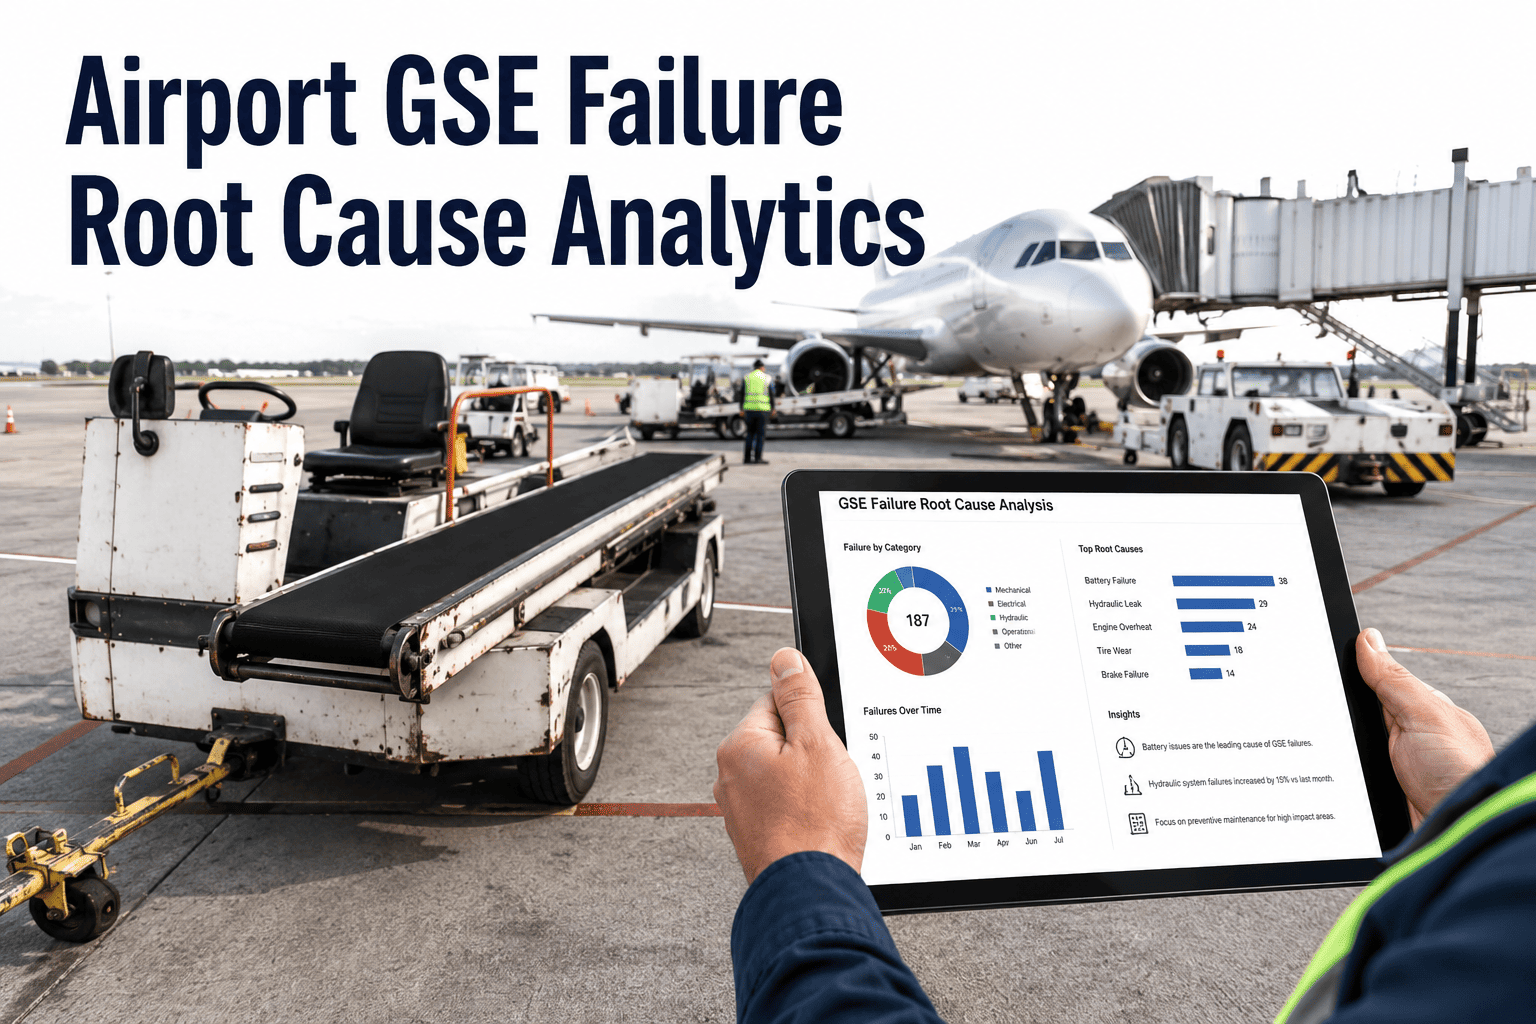
The work order says "hydraulic leak, repaired." So does the one from four months ago. And the one before that. Ground support equipment doesn't usually fail once — the same pushback tractor, belt loader, or GPU keeps coming back to the shop with a variant of the same complaint, because the technician fixed what was leaking, not why it was leaking. Every repeat visit costs another gate delay, another rush parts order, another shift of overtime, and the fleet never gets any closer to zero. Book a Demo to see how root cause analytics finds the pattern your work order history has been hiding all along.
Stop Re-Diagnosing the Same GSE Failure Every Quarter.
iFactory AI correlates asset history, inspection findings, parts consumption, and technician notes across your entire GSE fleet to surface the actual root cause behind repeat breakdowns — not just the fault that was easiest to log.
Same Asset, Same Fault, Four Times in a Row — and No One Connected the Dots
Ground handlers do not usually lose fleet reliability to one catastrophic failure. They lose it to the same fault recurring on the same asset, logged under four different work order numbers, closed out four different ways, with nobody ever pulling the full history side by side. A single pushback tractor's hydraulic case file below is typical of what sits buried in a paper or spreadsheet-based maintenance log at a mid-size ground handling operation.
Four work orders, four different technicians, four partial fixes — and the actual root cause, a wrong-spec hose installed at the very first visit, was never visible because no one ever looked at the four tickets together. That is the gap AI-assisted root cause analytics is built to close.
Four Reasons the Same GSE Fault Keeps Coming Back
Ground support equipment operates in one of the harshest maintenance environments in transportation — jet blast, chemical exposure, multi-shift use, and constant handoffs between technicians who may never see the same asset twice. Root cause analysis fails in this environment for structural reasons, not because of any one technician's judgment.
Work Orders Live in Isolation
Each repair is closed as its own ticket with its own symptom description. Without a system that automatically groups every ticket by asset and fault type, a technician closing visit three has no easy way to see that visits one and two described the same problem.
Inspection Findings Sit Separately from Repairs
The pre-shift inspection checklist that flagged a minor fluid weep two weeks earlier is filed in a different system than the corrective work order it eventually caused. The two records never meet, so the early warning never informs the diagnosis.
Technician Turnover Erases Tribal Knowledge
Ground handling has some of the highest technician turnover of any maintenance trade. The one mechanic who remembered that a specific vendor's replacement part never fit the original spec often leaves before that knowledge gets written down anywhere searchable.
Symptom Codes Reward the Fast Fix
Under gate-pressure timelines, a technician logs the fastest closing code available — "hose replaced," "fluid topped off" — because the shift board needs the asset back in rotation. The underlying cause never gets a field to be recorded in even if it were known.
Unresolved Root Cause Is a Fleet-Wide Cost, Not a One-Asset Nuisance
Industry reporting on ground handling reliability points to the same underlying story across airports of every size: equipment failures are rarely a single-incident problem, and the cost of leaving root cause unresolved compounds every time the same fault reaches a gate. A meaningful share of ramp-level incidents trace back to equipment condition rather than operator error, and unplanned GSE downtime carries a real per-hour cost in delay penalties, crew standby time, and repositioning that most ground handlers already track but rarely connect back to a specific unresolved fault pattern.
of tracked airport ramp incidents have been attributed to ground support equipment condition rather than operator error, pointing directly at maintenance and diagnosis gaps.
estimated cost per hour of unplanned GSE downtime at a busy gate, once delay penalties, crew standby, and repositioning are counted together.
of maintenance teams across the ground support equipment market report adopting predictive tools, reflecting how fast the industry is moving away from reactive, symptom-level repair.
What Gets Logged vs. What Is Actually Wrong
Across ground support fleets, a handful of failure symptoms account for the overwhelming majority of repeat work orders. The table below shows the symptom most commonly logged at the point of repair against the root cause that AI-assisted pattern analysis most often uncovers once the full asset history is correlated.
| Symptom Logged at Repair | Typical Recurrence | Common Quick-Fix | Root Cause Found on Correlation |
|---|---|---|---|
| Hydraulic fluid leak | 3–5 visits over 6–9 months | Hose or fitting replaced | Wrong-spec replacement part or fitting torque outside tolerance |
| Battery / charging fault (electric GSE) | 2–4 visits over 3–6 months | Battery swapped or charger reset | Charging cycle mismatched to duty pattern, shortening cell life |
| Brake drag or uneven wear | 2–3 visits over 4–8 months | Pads replaced, brakes adjusted | Alignment issue traced to a prior collision or curb strike never logged as a defect |
| Engine won't start / stalls | 3–4 visits over 2–5 months | Battery or starter replaced | Fuel or sensor fault masked by an intermittent electrical connection |
| Belt loader lift malfunction | 2–4 visits over 5–10 months | Hydraulic pump serviced | Contamination in fluid reservoir traced to a seal failure upstream |
See Your Own Fleet's Repeat-Offender List in Your First Working Session.
Bring your last twelve months of GSE work orders. iFactory AI will map every asset with more than two visits for a related fault and show you where the real root cause is hiding.
From Scattered Records to a Confirmed Root Cause in Five Steps
AI-assisted root cause analytics does not replace the technician's judgment — it removes the manual burden of cross-referencing years of records so the technician's judgment has the full picture to work with. No system can walk out to the tarmac and diagnose a hydraulic cylinder by feel, but a system can absolutely notice that four tickets across seven months describe the same fault before a fifth, more expensive failure ever happens. Here is how iFactory AI structures that process for a GSE fleet.
Ingest Every Record Source
Work orders, pre-shift inspection findings, parts consumption logs, and free-text technician notes are pulled into a single asset-centric timeline, regardless of which system originally captured them.
Cluster Related Faults by Asset and Symptom
Natural-language processing groups tickets that describe the same underlying complaint even when technicians used different wording — "leak at steering ram" and "hydraulic drip near front axle" are recognized as the same recurring fault.
Rank Root Cause Candidates
The system cross-references parts installed, dates, vendors, and prior inspection findings against the fault cluster and ranks the most statistically likely root causes, learning from patterns already confirmed across your fleet and comparable assets.
Surface the Case File to the Technician
Before the next repair begins, the technician sees the asset's full recurrence history and the leading root cause candidate directly in the work order — turning a cold diagnosis into a guided one.
Track the Fix and Close the Loop
Once a root cause is confirmed and corrected, the system watches that fault signature across the fleet — if it recurs on the same or a similar asset, it is flagged immediately rather than treated as a fresh, unrelated complaint.
Diagnosing by Memory vs. Diagnosing by Correlated History
The difference between a repeat breakdown and a permanently closed one usually comes down to whether the person doing the repair had access to the asset's full pattern — or just the ticket in front of them.
| Diagnostic Approach | Manual / Spreadsheet-Based | AI-Assisted Root Cause Analytics |
|---|---|---|
| Fault history visibility | Depends on technician memory or manual ticket search | Full correlated timeline surfaced automatically at the point of repair |
| Cross-source correlation | Inspection findings and work orders rarely reviewed together | Inspection findings, work orders, and parts history correlated by default |
| Recurrence detection | Noticed only after three or more visits, if at all | Flagged after the second related fault on the same asset |
| Knowledge retention | Lost when the technician who remembers it leaves | Retained as structured, searchable asset history |
| Fleet-wide pattern spread | Same design or vendor fault repeats unnoticed across similar assets | Confirmed root causes checked automatically against comparable assets |
Four Record Types the Analysis Pulls Together
Root cause rarely lives in a single data source. It emerges from the overlap between several record types that, in most ground handling operations today, are never reviewed side by side.
Work Order History
Every repair, part replaced, technician assigned, and time to close — the baseline record most fleets already have but rarely mine for patterns across assets.
Inspection Findings
Pre-shift and periodic inspection checklist entries, including minor defects marked "monitor" that often precede a failure by weeks.
Parts and Vendor History
Which part, from which vendor, installed on which date — the detail most likely to expose a wrong-spec component or a bad batch across multiple assets.
Technician Notes
Free-text observations that never make it into a structured field, mined for recurring language that points to the same underlying condition.
A Belt Loader Fleet's Repeat Lift Failures, Before and After
A regional ground handler running 40 belt loaders across three gates had logged nine separate lift-malfunction work orders on five different units over eight months — each closed as a standalone hydraulic pump service. No one had compared the five case files against each other, because each unit's maintenance record was reviewed on its own, and nothing in the existing system prompted a technician to check whether a sister unit had failed the same way a few weeks earlier.
Before Root Cause Analytics
Each belt loader was serviced in isolation. The pump was rebuilt or replaced five separate times at an average cost of $1,450 per repair, with lift malfunctions recurring on three of the five units within four months of the previous fix. No pattern across units was ever surfaced.
After Root Cause Analytics
Correlating the five case files showed all nine failures traced to fluid contamination from a single reservoir seal design shared across that equipment generation. One seal-design correction across all 40 units eliminated the recurring fault fleet-wide instead of one unit at a time.
What to Bring to Your First Root Cause Analytics Session
A useful first working session does not require a clean data set — it requires the records you already have, however scattered they are today. The goal of that first session is not a finished analysis but a clear demonstration, on your own fleet's history, of where a pattern has been sitting unnoticed across separate tickets and separate systems.
Work Order Export
The last 12 to 24 months of closed and open work orders across the GSE fleet, in whatever format your current system produces.
Inspection Checklist Records
Pre-shift and periodic inspection findings, even if they live in a separate paper or spreadsheet system from repairs.
Parts and Vendor Logs
Whatever record exists of which parts were installed on which asset and when, even partial history is enough to start.
Your Top Five Repeat Offenders
A quick list, from memory, of the assets your team already suspects keep coming back for the same fault — the session will confirm or correct it.
GSE Failure Root Cause Analytics — FAQs
How is root cause analytics different from a standard CMMS work order history?
A standard CMMS stores each work order as an independent record, which is useful for compliance and billing but does not automatically connect visits that describe the same underlying fault in different words. Root cause analytics adds a correlation layer on top of that history, clustering related tickets, inspection findings, and parts records by asset and fault signature so the pattern becomes visible without manual searching. To see this applied to your own fleet's records, book a demo with the iFactory team.
How many repeat visits does it take before a pattern is flagged?
Most fleets do not notice a recurring fault until the third or fourth visit, if at all, because each ticket is reviewed in isolation. iFactory AI flags a likely recurring fault after the second related visit on the same asset, comparing fault descriptions, timing, and parts history rather than waiting for a technician to happen to remember the earlier repair.
Does this require replacing our existing CMMS or work order system?
No — the analytics layer is designed to ingest records from whatever system currently holds them, including spreadsheets, paper-derived exports, and existing CMMS platforms. Most ground handling operations start with a data export from their current tools rather than a system migration, and expand from there as the value becomes clear.
Can this catch a fault pattern shared across multiple GSE units, not just one asset?
Yes — once a root cause is confirmed on one asset, the system checks whether the same equipment generation, part, or vendor is present on comparable units across the fleet, which is how design-level or batch-level defects like a shared seal or fitting issue get surfaced before they cause failures on every affected unit individually.
What does a working session with iFactory AI actually involve?
A working session starts with your own recent work order, inspection, and parts records, mapped into the platform to identify assets with recurring or related faults across the review window. The team walks through what the correlation surfaces, discusses how it compares to your team's current diagnosis process, and outlines a rollout path. Contact our support team if you would like to prepare your data ahead of the session.
Your Repeat-Offender Assets Are Already in Your Work Order History.
Bring your GSE maintenance records to a working session and see the recurring faults, the likely root causes, and the fleet-wide exposure your team has not had a way to see until now.