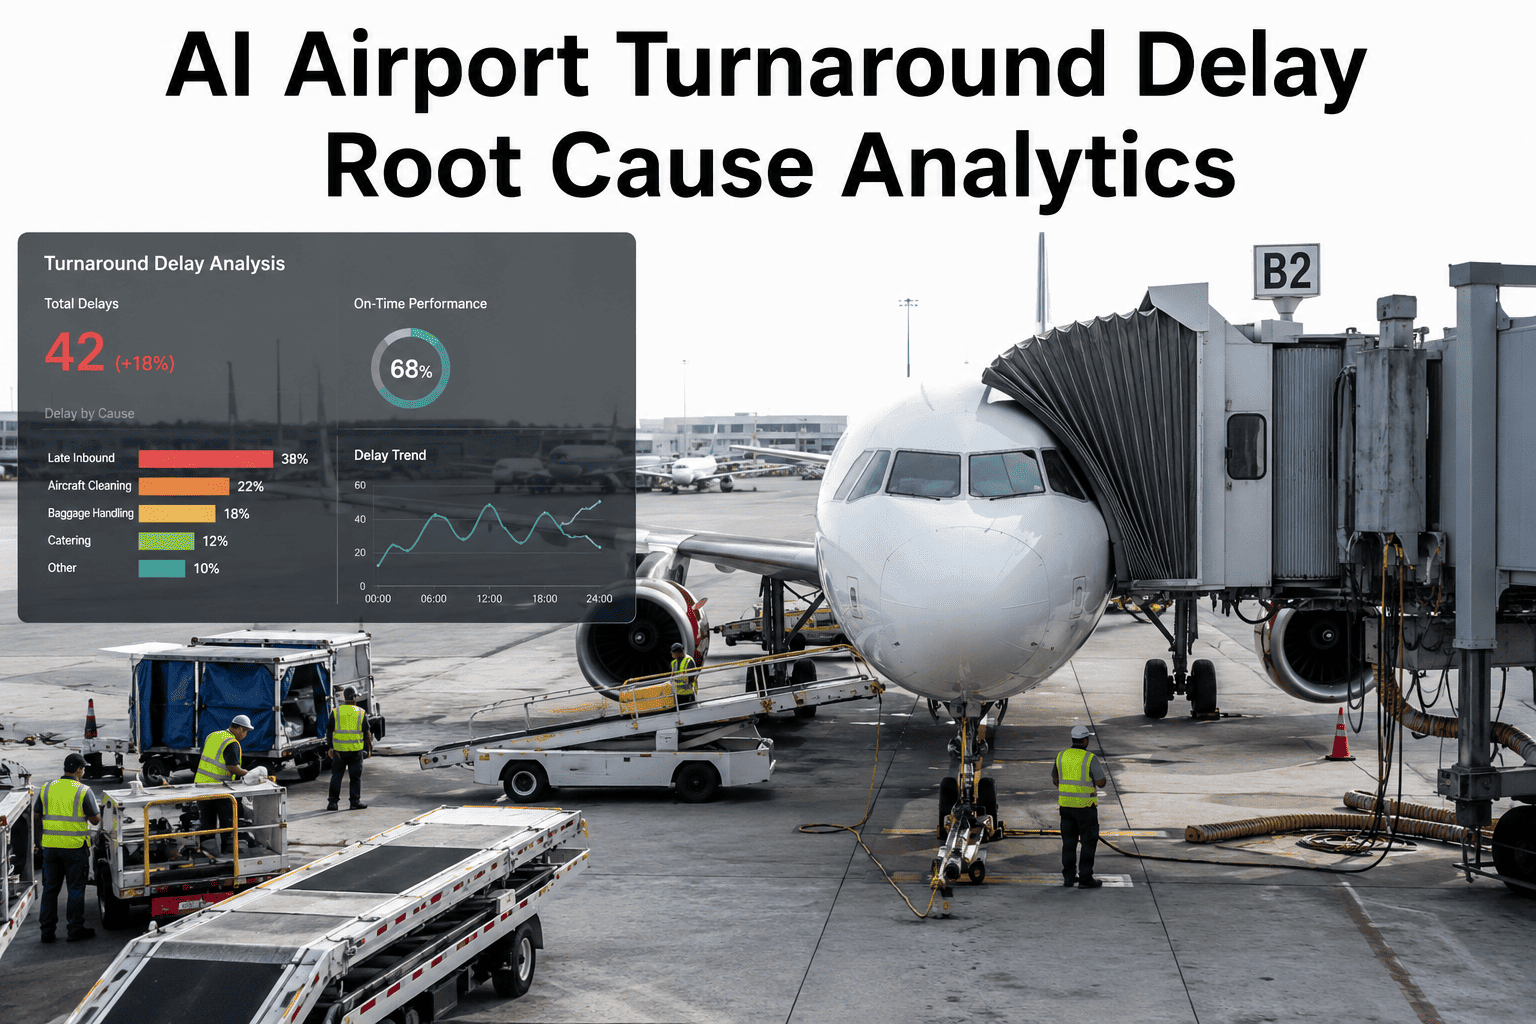
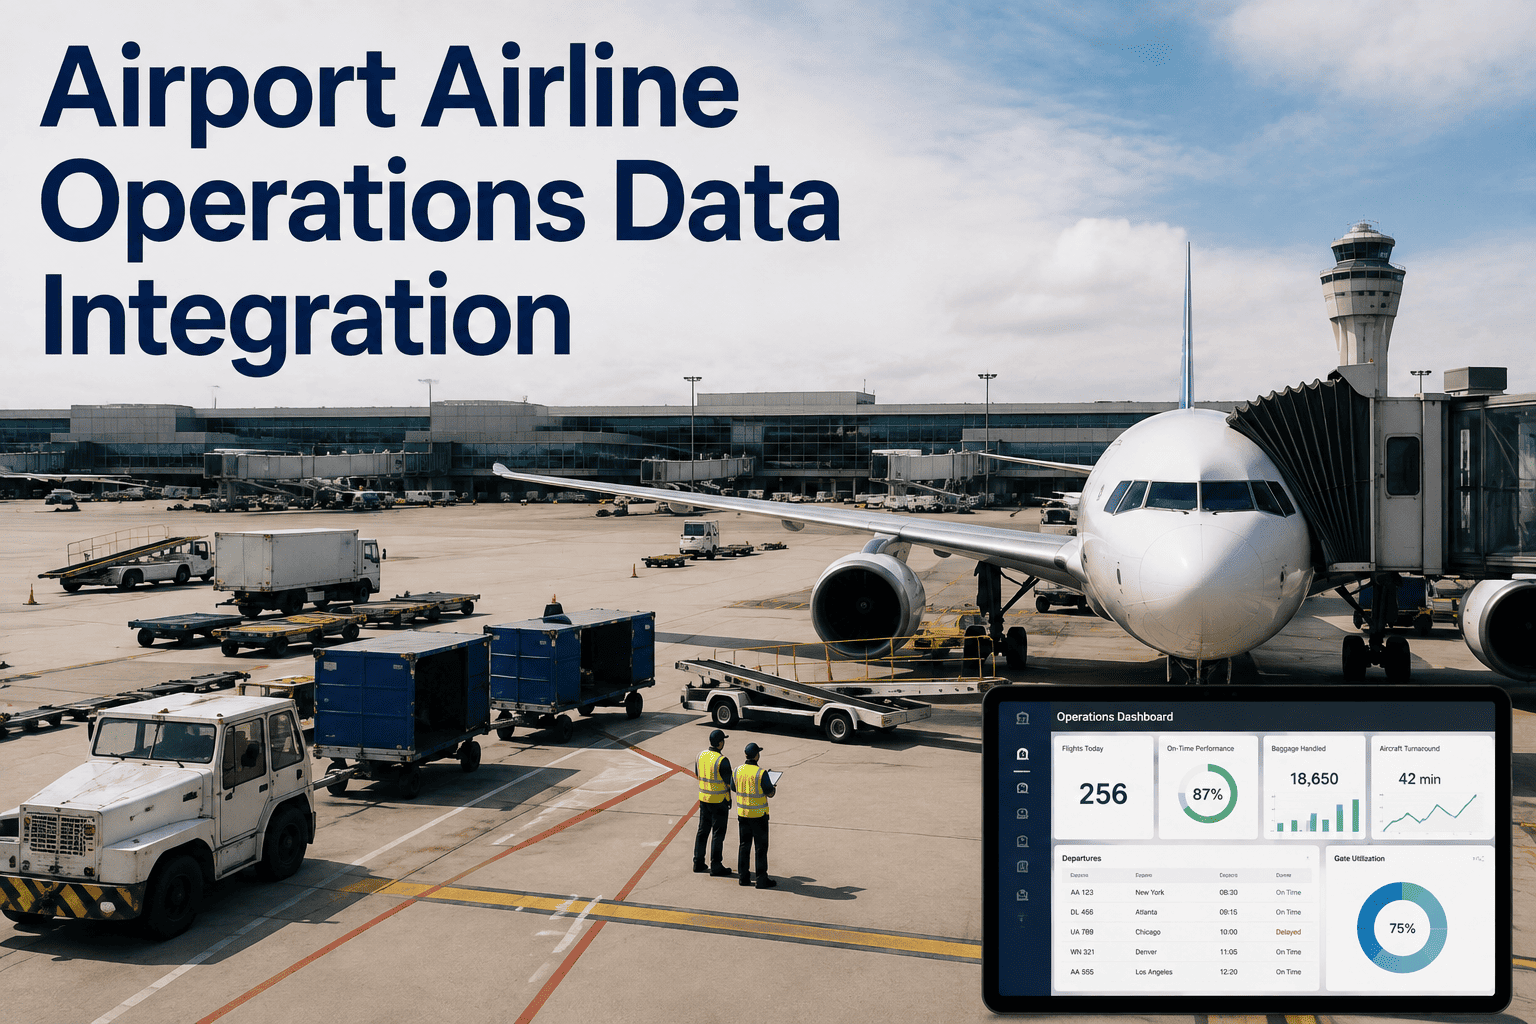
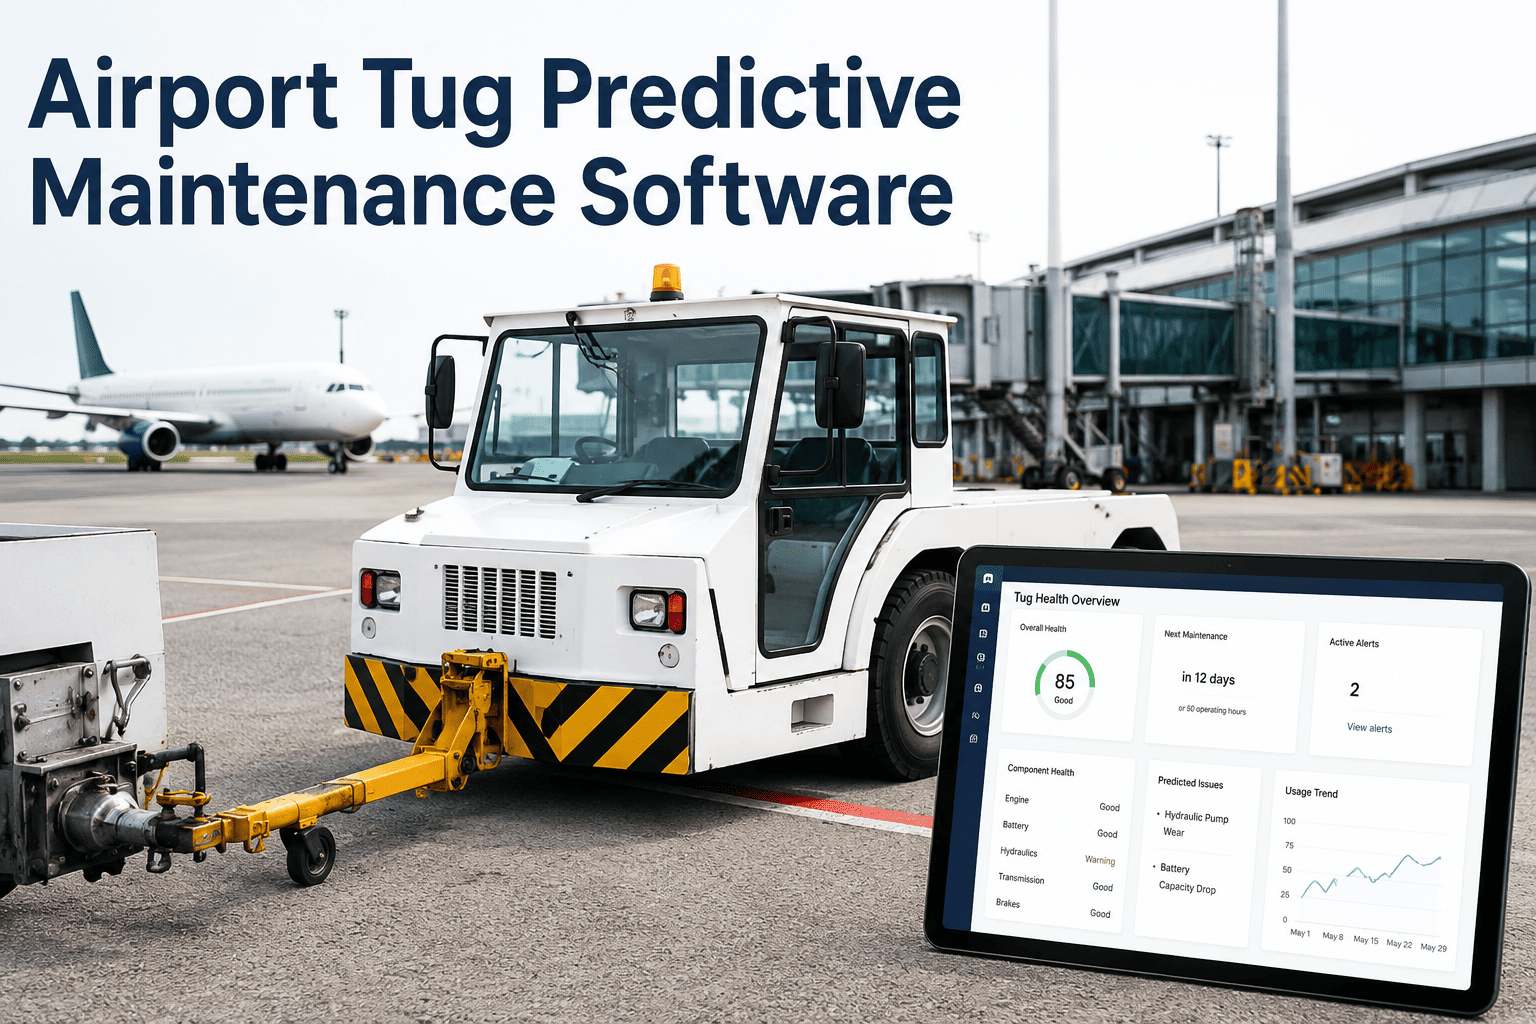
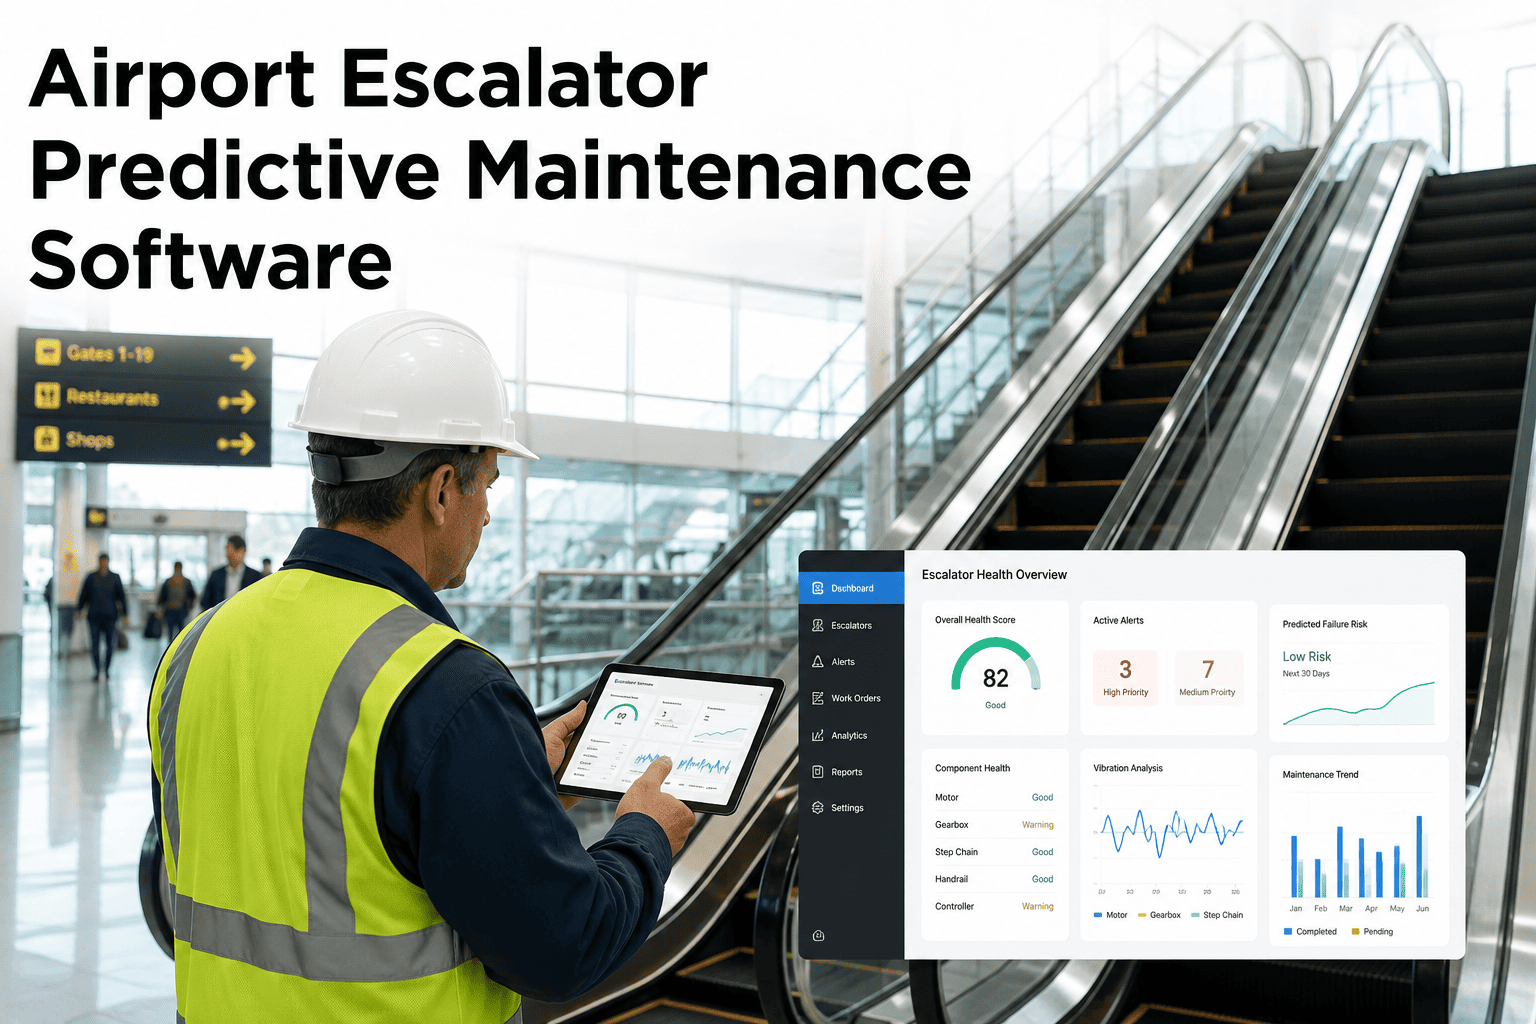
A ten-minute turnaround overrun rarely has one clean cause. It is usually a belt loader that arrived four minutes late because it was still finishing another aircraft, a GPU that took longer to connect than scheduled, and a jet bridge alignment that needed a second attempt, all stacking on top of each other until the gate agent is reporting a delay with no single obvious culprit. Root cause analytics pulls asset, work order, and operational timing data into one view so the actual driver of a delay pattern, not just the symptom on the day, becomes visible — the full breakdown of how this works is available at iFactory support.
Root Cause Analytics · Turnaround Delay
Airport Turnaround Delay Root Cause Analytics Software
Correlate GSE performance data, maintenance work orders, and turnaround timing records to find out which equipment, process, or crew pattern is actually driving your delay minutes — not just which flight was late today.
15-30 min
Turnaround extension from a single GSE failure
$50-100
Estimated cost per minute of gate delay
10-15%
Typical turnaround improvement from structured analytics
Why "Late Aircraft" Is Not a Root Cause
Most Turnaround Delay Tracking Stops at the Symptom
Ask most ramp operations teams why a given flight pushed back late, and the honest answer is a delay code entered by a gate agent under time pressure, usually something broad like "ground handling" or "equipment." That code satisfies the reporting requirement, but it tells the reliability team almost nothing useful about the underlying cause, and it certainly does not tell them whether the actual driver was a specific tug that keeps breaking down, a belt loader shortage during a particular bank of flights, or a jet bridge that has been drifting out of alignment for months. Without connecting delay events back to specific asset IDs, work order history, and staffing patterns, the same root cause keeps generating the same delay minutes indefinitely, quarter after quarter, while the reporting metrics move around it without ever pointing at what would actually fix it.
A
Generic Delay Codes
Standard delay reporting categories were built for regulatory reporting, not root cause diagnosis, so most codes describe the type of disruption without identifying the specific asset or process behind it.
B
Disconnected Systems
GSE maintenance records, turnaround timing logs, and staffing schedules typically live in three separate systems that were never designed to be queried against each other.
C
Recency Bias in Manual Review
When someone does dig into delay patterns manually, they tend to focus on the most recent or most memorable incidents rather than the pattern that is quietly costing the most minutes across a full quarter.
D
No Feedback Loop to Maintenance
Even when a pattern is identified, there is often no structured path connecting the operations team's delay findings back to the maintenance team's scheduling priorities.
Where Turnaround Minutes Actually Go
Ranked Contribution of Common Delay Drivers
Not every delay category contributes equally to total lost turnaround minutes across a network. Root cause analytics ranks delay drivers by their actual minute contribution over a rolling window, rather than by how often they get mentioned in shift handover notes, which is usually where manual review focuses attention instead. The ranking below reflects the pattern seen consistently across mid-size and major hub ground operations, though the exact order can shift depending on fleet age, gate density, and seasonal traffic mix at a given airport.
GSE Mechanical Failure
Highest
Equipment Positioning Delay
High
Baggage/Cargo Handling
Moderate
Fueling Sequence
Moderate
Jet Bridge Alignment
Lower
Manual Review vs. Root Cause Analytics
Where the Two Approaches Diverge in Practice
The gap between a manual delay review and a continuous root cause program is not really about effort. A dedicated analyst reviewing delay codes by hand can produce a thoughtful report, but the underlying data connections that would let that analyst attribute a pattern to a specific asset rather than a general category usually do not exist without a system built to maintain them.
Aspect
Manual Delay Review
Root Cause Analytics
Data Sources
Gate agent delay codes reviewed in isolation
GSE telemetry, work orders, and turnaround timing correlated together
Pattern Detection
Depends on which incidents an analyst happens to remember
Every delay event over the analysis window scored consistently
Attribution
Broad category codes without a specific asset or crew tie-back
Delay minutes attributed to specific asset IDs and process steps
Turnaround Time
Weeks to compile a quarterly delay review report
Continuously updated dashboard, reviewed as patterns emerge
Action Path
Findings often stop at a presentation slide
Findings feed directly into maintenance scheduling and GSE deployment plans
Every Turnaround Delay Has a Cause. Most Airports Only Have the Symptom on Record.
Root cause analytics connects the delay minute back to the specific asset, process, or pattern actually driving it — so the fix targets the real problem, not this week's most memorable incident.
How Root Cause Analytics Works
From Scattered Delay Codes to a Prioritized Fix List
Getting from a pile of delay codes to a specific, fundable fix takes a defined analytical path, not a one-off spreadsheet exercise. The five stages below describe how that path runs in a functioning root cause analytics program, from the moment raw operational data is pulled together to the moment a specific action lands on a maintenance or operations lead's desk.
Stage 01
Data Integration
GSE telemetry, maintenance work order history, turnaround timing logs, and staffing schedules are pulled into a common data model, tagged by gate, aircraft type, and time of day.
Stage 02
Delay Event Correlation
Each recorded delay event is cross-referenced against asset condition, prior work order frequency, and equipment availability at that gate during that time window.
Stage 03
Pattern Scoring
Recurring drivers are ranked by total minute contribution across the analysis period, separating a chronic low-grade issue from a one-time incident that happened to be memorable.
Stage 04
Operations Review
Ramp and maintenance leads review the ranked findings together, since the fix for a scored pattern often spans both equipment reliability and staffing or scheduling decisions.
Stage 05
Targeted Action
Confirmed drivers translate into a specific action, whether that is a maintenance work order, a GSE fleet reallocation, or a staffing adjustment for a specific bank of flights, and the outcome of that action is tracked back into the next analysis cycle to confirm the fix actually held.
What Changes After Deployment
Outcomes Reported by Ground Operations Teams
The value of root cause analytics is measured less in the number of dashboards produced and more in whether the same delay pattern stops recurring quarter over quarter once it has actually been fixed at the source, rather than simply being re-labeled under a slightly different delay code the next time it happens.
10-15%
Turnaround Time Improvement
Structured, data-backed root cause programs report meaningful turnaround time gains compared to teams relying on delay codes alone.
30-50%
Fewer Unplanned GSE Breakdowns
Feeding root cause findings directly into CMMS scheduling substantially cuts the unplanned equipment failures that drive turnaround overruns in the first place.
$240K+
Annual Loss From an Untracked Pattern
A fifty-asset GSE fleet losing just four hours a week to unplanned failures bleeds well into six figures annually if the pattern goes unaddressed.
Faster
Time to Root Cause
Continuously correlated data replaces a multi-week quarterly review cycle with findings that surface as soon as a pattern crosses a meaningful threshold.
Field Example
Finding the Real Driver Behind a Concourse's Recurring Delays
A mid-size hub's ground operations team had spent two consecutive quarters seeing above-average turnaround delays on one concourse, with gate agents logging the cause as "ground handling" or "equipment" on the majority of affected flights. The operations team had assumed the issue was simply higher aircraft traffic density on that concourse compared to others.
Root cause analytics correlating GSE work order history, equipment positioning data, and turnaround timing logs told a different story. A specific pool of belt loaders assigned to that concourse had a work order frequency nearly double the fleet average, and the delay events clustered tightly around turnarounds where one of those specific units had been dispatched, not around traffic density at all.
The maintenance team pulled the two highest-frequency belt loaders from the shared pool for a full inspection, which found worn hydraulic seals contributing to slow lift cycles on both units. Once those units were repaired and rotated out of the concourse's primary pool, average turnaround delay on that concourse dropped meaningfully within the following month, without any change to staffing or traffic scheduling.
The finding also changed how the fleet was managed going forward. Because the correlation between those two specific units and the delay pattern was documented rather than anecdotal, the maintenance team added a shorter inspection interval for any belt loader crossing a similar work order frequency threshold, catching the next comparable issue before it built up two quarters of unexplained delay minutes.
2 quarters
Of unresolved recurring delay pattern
2 units
Belt loaders identified as the actual driver
1 month
To measurable delay reduction after the fix
Common Missteps
Where Turnaround Delay Programs Fall Short
A root cause analytics rollout can produce accurate correlations and still fail to reduce delay minutes, usually because the findings never make it into a decision that actually changes equipment or staffing on the ground. The four patterns below account for most of the programs that generate good data but never translate it into a lower delay count.
A
Treating Every Delay Equally
Reviewing delay events one at a time, rather than ranked by total minute contribution, means the loudest recent incident gets attention while a chronic low-grade pattern keeps quietly costing more overall.
B
Keeping Maintenance and Ops Data Separate
Delay analysis performed without GSE work order history attached can identify that a problem exists on a given concourse without ever identifying which specific asset is behind it.
C
No Defined Action Owner
A ranked list of delay drivers without a named owner for each finding tends to sit in a review deck rather than becoming a scheduled fix.
D
One-Time Analysis Instead of Continuous Tracking
A single quarterly deep dive catches whatever pattern existed at that moment, but equipment condition and staffing patterns shift continuously, and a one-time report goes stale within weeks of being presented, well before the next review cycle would catch the change.
Who Acts on What
Root Cause Findings Rarely Belong to Just One Team
A ranked list of delay drivers is only useful once it is clear who is responsible for acting on each finding. Most confirmed root causes span more than one function, which is exactly why they tend to stall when ownership is left implicit rather than assigned as part of the review process itself. Naming an owner at the moment a pattern is confirmed, rather than after the fact in a follow-up meeting, is what actually separates a finding that gets fixed from one that gets filed away.
Maintenance Planning
Owns findings tied to a specific piece of GSE with elevated work order frequency, converting a scored pattern into a scheduled inspection or repair before the next season's peak volume.
Ground Operations Leadership
Owns findings tied to equipment positioning or staffing patterns, deciding whether a fix requires reallocating GSE across gates or adjusting crew assignments for a specific bank of flights.
Ramp Supervisors
Provide the operational context that turns a statistical pattern into a confirmed cause, since supervisors on the ground often recognize immediately why a specific gate or asset keeps surfacing in the data.
Airline & Airport Operations Committees
Review recurring cross-functional patterns that require capital investment, such as a fleet-wide GSE replacement decision, once a driver has been confirmed across multiple analysis cycles.
Frequently Asked Questions
What Ground Operations Teams Ask Before Deploying
What data do we need to have in place before this kind of analysis is useful?
The most useful starting combination is turnaround timing records with gate and time-of-day detail, GSE work order history from whatever maintenance system is currently in use, and asset assignment records showing which specific unit served which turnaround. Airports rarely have all three cleanly connected at the outset, and building that connection is typically the first phase of a deployment rather than a prerequisite the airport has to solve on its own beforehand. A scoping conversation can confirm what is already available in your current systems —
book a demo to walk through it.
How is this different from the delay code reporting we already submit for regulatory purposes?
Regulatory delay codes were designed to satisfy reporting requirements across an entire industry using a standardized, relatively coarse category set, not to diagnose the specific asset or process behind an individual airport's delay pattern. Root cause analytics uses those same delay events as a starting point but layers in the airport's own GSE telemetry, work order history, and turnaround timing to identify the actual driver underneath the category code, which is detail the regulatory reporting format was never built to capture.
Can this integrate with our existing CMMS and ground operations systems?
Yes. Root cause analytics is designed to read from the maintenance system and turnaround tracking tools an airport already has in place, rather than requiring a separate system that ground crews and maintenance planners would need to check independently. Findings are written back into the existing maintenance workflow as prioritized action items. Integration specifics for a particular CMMS or ground operations platform are best confirmed with the
support team during scoping.
How quickly can we expect to see a meaningful pattern identified after deployment?
Initial patterns typically surface within the first four to eight weeks of continuous data correlation, though the exact timeline depends on delay event volume and how much historical work order and turnaround data is available to establish a baseline. Chronic, high-frequency drivers such as a specific problem asset tend to surface faster than lower-frequency patterns that need a longer observation window to separate from normal operational variation.
Does this replace the judgment of our ramp operations and maintenance leads?
No. The analytics rank and correlate the data, but deciding what to do about a confirmed pattern, whether that means pulling an asset for inspection, reallocating GSE across gates, or adjusting a staffing schedule, still requires the operational judgment of the ramp and maintenance teams who understand the constraints on the ground. What changes is that those decisions get made against a ranked, evidence-backed list of drivers instead of whichever incident happened to be most recent or most visible.
Stop Fixing the Symptom While the Same Root Cause Keeps Costing You Minutes
Root cause analytics connects turnaround delays back to the specific asset, process, or pattern actually driving them, so every fix targets the real problem.