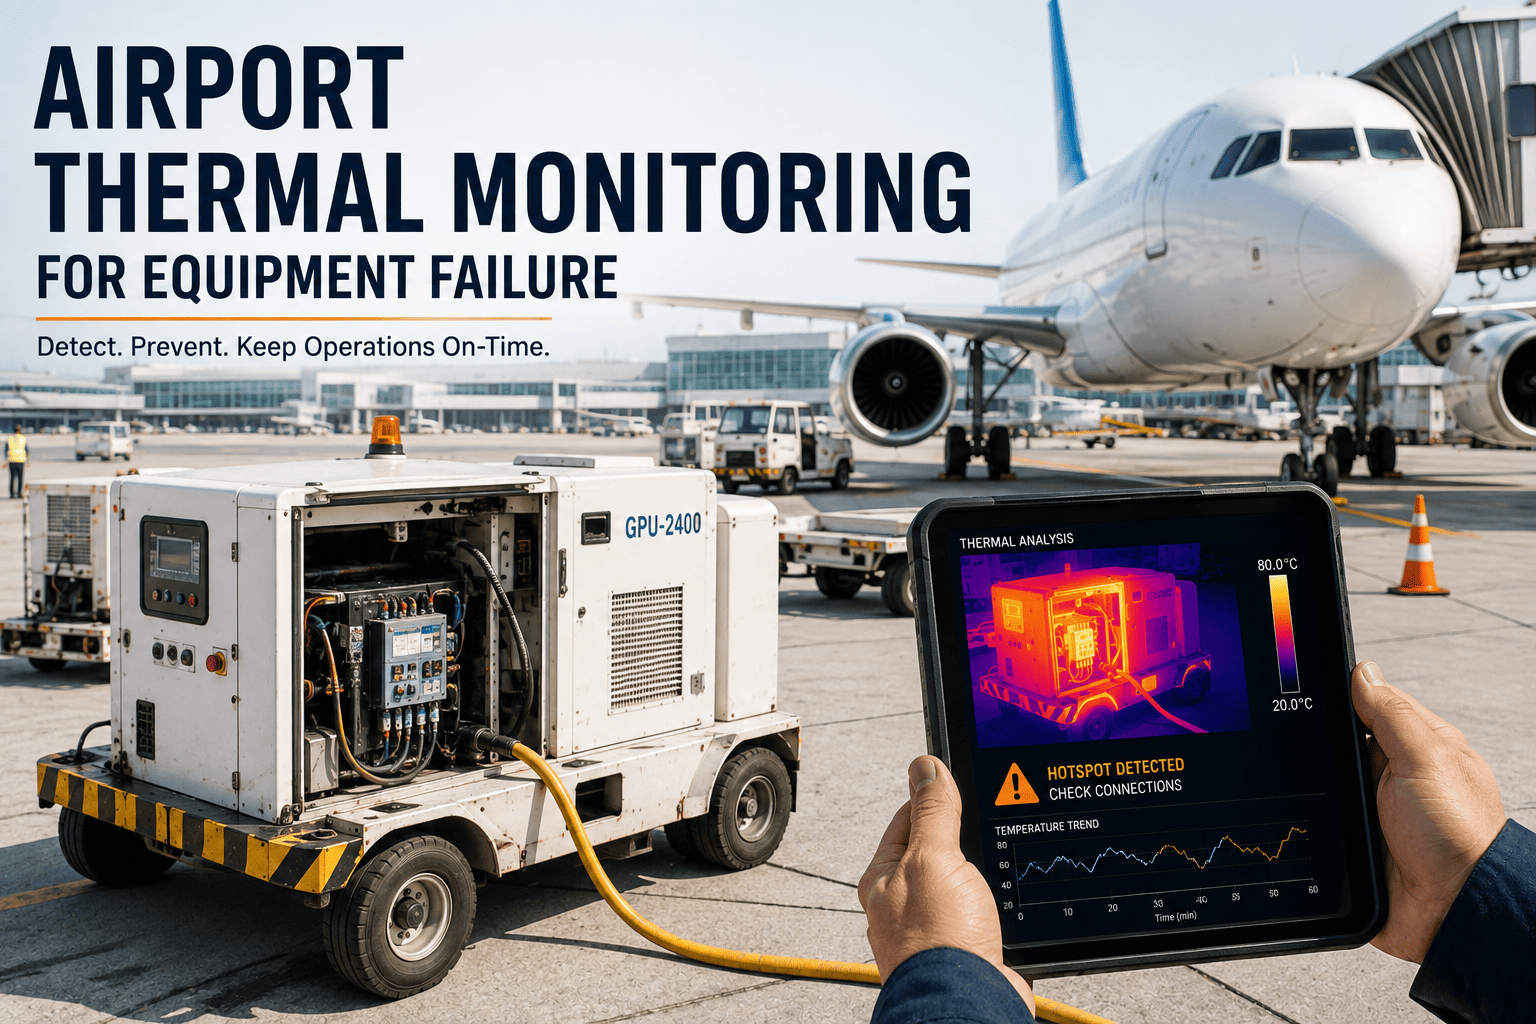
Most airport equipment failures do not begin with a bang, they begin with a temperature that started climbing three days ago and nobody was watching a screen wide enough to notice. Electrical panels, motor control centers, and baggage handling drives all radiate heat differently right up until the moment they overheat completely and take a critical system offline. Facility and maintenance teams commonly manage this with an annual or quarterly handheld thermal scan that treats each connection point as a single frozen photo instead of an ongoing signal, which means a fault developing in the weeks between scans stays invisible until it fails. iFactory closes that gap with continuous thermal monitoring paired with AI-driven alerts, and you can book a demo to see how it applies across your terminal's electrical and mechanical assets.
If Nobody Is Watching the Temperature, the Failure Gets to Announce Itself
iFactory turns scattered handheld thermal scans into a continuous, AI-monitored temperature feed across your electrical, mechanical, and baggage handling assets, so a developing fault shows up as a trend line instead of an outage.
Why Most Airport Facilities Are Flying Blind Between Scans
Periodic handheld thermal inspection has been the standard approach for decades, and it still catches plenty of obvious problems. What it structurally cannot catch is anything that develops and worsens inside the gap between two scheduled visits, which for most facilities is measured in months, not days.
Six Categories of Airport Equipment Where Thermal Drift Precedes Failure
Thermal monitoring is not limited to one system. Almost every powered asset across a terminal generates a heat signature that changes measurably before it fails, and these six categories consistently show the clearest early patterns.
Electrical Switchgear and Panels
Loose connections and overloaded breakers generate localized heat at the connection point long before a panel fault trips power to a concourse or gate.
Motor Control Centers
Starter contacts and VFD components heat unevenly as they degrade, a pattern that is essentially invisible without a live thermal feed on that cabinet.
Baggage Handling Drive Motors
Continuous-duty drive motors along the belt line run measurably hotter under developing bearing wear, well before a quarterly scan would catch it.
Jet Bridge Drive and Lift Systems
Motor and gearbox components inside the passenger boarding bridge overheat under repeated cycling, with no continuous visibility on most bridges today.
HVAC and Chiller Equipment
Compressor bearing wear and refrigerant issues in terminal HVAC systems frequently surface first as an unnoticed thermal drift in the equipment room.
GSE Charging and Battery Stations
Resistive heating at charging connections and battery terminals can develop into a serious hazard well before a periodic visual check would flag it.
What a Rising Temperature Signature Looks Like Before It Becomes a Failure
A developing thermal fault rarely jumps straight from normal to critical. It typically moves through recognizable stages, and the earlier stages are exactly where continuous monitoring provides the most useful warning.
Stage 1: Baseline Operation
The component runs within its normal established temperature range, with only minor fluctuation tied to load and ambient conditions.
Stage 2: Gradual Drift
Temperature begins trending upward slowly, often too subtle for a single scan to distinguish from normal operating variation.
Stage 3: Accelerated Rise
The rate of temperature increase itself speeds up, a pattern that trend-based AI monitoring is specifically built to flag.
Stage 4: Critical Threshold
Temperature crosses a failure-risk threshold, and without intervention the component is now on a short path to outright failure.
Periodic Handheld Scans vs iFactory Continuous Thermal Monitoring
The table below sets out what actually changes for a maintenance team once thermal data moves from an occasional walk-through to an always-on feed with AI trend analysis behind it.
| Factor | Periodic Handheld Scan | iFactory Continuous Monitoring |
|---|---|---|
| Detection Window | Limited to whatever was hot at the moment of the scan | Trend visible across every hour between scheduled visits |
| Lead Time Before Failure | Depends entirely on scan timing relative to fault onset | Days to weeks of lead time based on trend velocity |
| Coverage Consistency | Technician availability and scan route determine coverage | Every monitored asset covered on the same continuous basis |
| Data Record | Individual point-in-time images filed per inspection | Continuous historical trend per asset available on demand |
| Alert Timing | Only as current as the last completed scan | Real-time alert the moment a trend crosses threshold |
A Trend Line Beats a Single Snapshot Every Time
iFactory keeps a continuous thermal signature on the assets that matter most, so a developing fault shows up as a pattern days or weeks before it becomes an outage.
From Thermal Sensor to Work Order in Five Steps
The monitoring pipeline is designed to route straight into existing maintenance workflows, so an alert becomes an actionable task rather than another dashboard to check manually.
Sensors Installed at Priority Points
Fixed thermal sensors or periodic AI-analyzed imaging are positioned at the electrical, motor, and mechanical points identified as highest risk.
Per-Asset Baseline Established
Each monitored point gets its own normal operating temperature range built from actual historical data, not a generic industry threshold.
Continuous AI Trend Analysis
The platform compares live readings against each asset's baseline continuously, watching for the rate of change, not just the absolute temperature.
Anomaly Classification and Threshold Alerts
When a reading pattern indicates a developing fault, the AI classifies severity and estimated urgency before an alert ever reaches a technician.
Automated Work Order Routing
A prioritized alert routes into the maintenance team's existing workflow with the specific asset and thermal pattern already documented.
Results Reported After Continuous Thermal Monitoring Goes Live
These figures reflect outcomes tracked at facilities that layered continuous thermal monitoring and AI trend analysis onto electrical and mechanical assets previously covered only by periodic manual scans.
Rolling Out Continuous Thermal Monitoring Across a Live Terminal
Sensor deployment is phased to start with the highest-consequence assets first, so the program proves out its value before expanding across the rest of the facility.
Frequently Asked Questions About Airport Thermal Monitoring
Stop Waiting for the Next Scheduled Scan to Find Out Something Is Wrong
iFactory gives your maintenance team a continuous, AI-monitored thermal feed across the electrical, mechanical, and baggage handling assets that matter most, with alerts that arrive while there is still time to act. Book a demo and see it running against your own terminal's asset list.